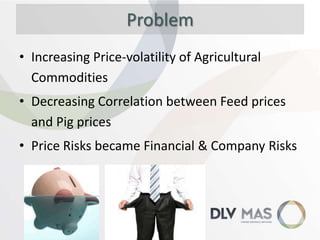
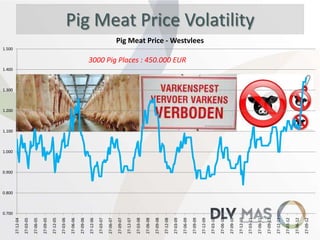
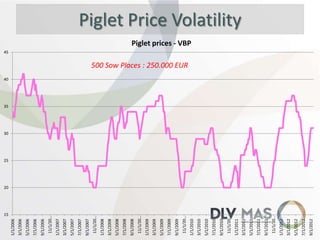
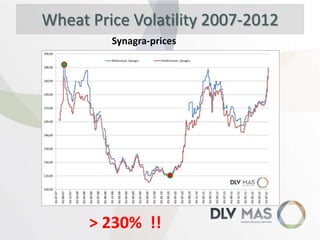
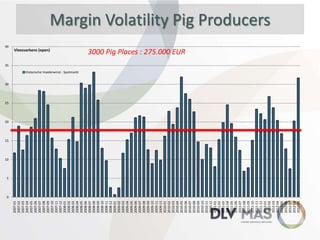
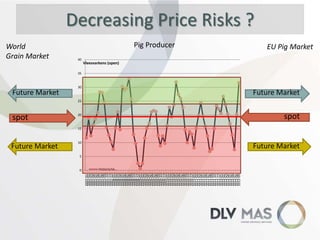
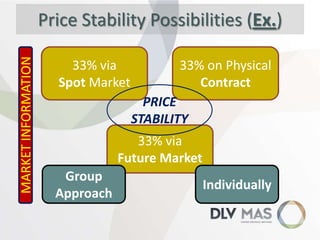
Risk Management Control :
The Agricultural Derivatives Market as
Price Risk Stability Tool
A practical approach

DLV Market Advisory Services
Carl De Braeckeleer
Problem
• Increasing Price-volatility of Agricultural
Commodities
• Decreasing Correlation between Feed prices
and Pig prices
• Price Risks became Financial & Company Risks
27-09-12

27-06-12

27-03-12

27-12-11

27-09-11

27-06-11

27-03-11

27-12-10

27-09-10

27-06-10

27-03-10

27-12-09

27-09-09

27-06-09

27-03-09

27-12-08

27-09-08

27-06-08

27-03-08

27-12-07

27-09-07

27-06-07

27-03-07

27-12-06

27-09-06

27-06-06

27-03-06

27-12-05

27-09-05

27-06-05

27-03-05

27-12-04

Pig Meat Price Volatility
Pig Meat Price - Westvlees

1.500

3000 Pig Places : 450.000 EUR

1.400

1.300

1.200

1.100

1.000

0.900

0.800

0.700
15
9/1/2012

7/1/2012

5/1/2012

3/1/2012

1/1/2012

11/1/20…

9/1/2011

7/1/2011

5/1/2011

3/1/2011

1/1/2011

11/1/20…

9/1/2010

7/1/2010

5/1/2010

3/1/2010

1/1/2010

11/1/20…

9/1/2009

7/1/2009

5/1/2009

3/1/2009

1/1/2009

11/1/20…

9/1/2008

7/1/2008

5/1/2008

3/1/2008

1/1/2008

11/1/20…

9/1/2007

7/1/2007

5/1/2007

3/1/2007

1/1/2007

11/1/20…

9/1/2006

7/1/2006

5/1/2006

3/1/2006

1/1/2006

Piglet Price Volatility
Piglet prices - VBP

45

500 Sow Places : 250.000 EUR

40

35

30

25

20
Wheat Price Volatility 2007-2012
Synagra-prices

> 230% !!
50.00

0.00
2007-01
2007-02
2007-03
2007-04
2007-05
2007-06
2007-07
2007-08
2007-09
2007-10
2007-11
2007-12
2008-01
2008-02
2008-03
2008-04
2008-05
2008-06
2008-07
2008-08
2008-09
2008-10
2008-11
2008-12
2009-01
2009-02
2009-03
2009-04
2009-05
2009-06
2009-07
2009-08
2009-09
2009-10
2009-11
2009-12
2010-01
2010-02
2010-03
2010-04
2010-05
2010-06
2010-07
2010-08
2010-09
2010-10
2010-11
2010-12
2011-01
2011-02
2011-03
2011-04
2011-05
2011-06
2011-07
2011-08
2011-09
2011-10
2011-11
2011-12
2012-01
2012-02
2012-03
2012-04
2012-05
2012-06
2012-07
2012-08
2012-09

Feed Cost Volatility
Pig Meal Prices - BEMEFA

350.00

300.00

250.00

200.00

150.00

100.00

3000 Pig Places : 300.000 EUR
500 Sow Places : 150.000 EUR
40

2007-01
2007-02
2007-03
2007-04
2007-05
2007-06
2007-07
2007-08
2007-09
2007-10
2007-11
2007-12
2008-01
2008-02
2008-03
2008-04
2008-05
2008-06
2008-07
2008-08
2008-09
2008-10
2008-11
2008-12
2009-01
2009-02
2009-03
2009-04
2009-05
2009-06
2009-07
2009-08
2009-09
2009-10
2009-11
2009-12
2010-01
2010-02
2010-03
2010-04
2010-05
2010-06
2010-07
2010-08
2010-09
2010-10
2010-11
2010-12
2011-01
2011-02
2011-03
2011-04
2011-05
2011-06
2011-07
2011-08
2011-09
2011-10
2011-11
2011-12
2012-01
2012-02
2012-03
2012-04
2012-05
2012-06
2012-07
2012-08
2012-09

Margin Volatility Pig Producers

Vleesvarkens (open)

3000 Pig Places : 275.000 EUR

35
Historische Voederwinst - Spotmarkt

30

25

20

15

10

5

0
World
Grain Market

Future Market

spot

Future Market
40

0
2007-01
2007-02
2007-03
2007-04
2007-05
2007-06
2007-07
2007-08
2007-09
2007-10
2007-11
2007-12
2008-01
2008-02
2008-03
2008-04
2008-05
2008-06
2008-07
2008-08
2008-09
2008-10
2008-11
2008-12
2009-01
2009-02
2009-03
2009-04
2009-05
2009-06
2009-07
2009-08
2009-09
2009-10
2009-11
2009-12
2010-01
2010-02
2010-03
2010-04
2010-05
2010-06
2010-07
2010-08
2010-09
2010-10
2010-11
2010-12
2011-01
2011-02
2011-03
2011-04
2011-05
2011-06
2011-07
2011-08
2011-09
2011-10
2011-11
2011-12
2012-01
2012-02
2012-03
2012-04
2012-05
2012-06
2012-07
2012-08
2012-09

Decreasing Price Risks ?
Pig Producer

30

20

10

5

Historische…

EU Pig Market

Vleesvarkens (open)

35

Future Market

25

spot

15

Future Market
Solutions
Gettingstarted
Assistance
Education

Full-package
Assistance

PRICE
STABILITY

Market
Information

Hedge-Tool
Data-Tool

Brokerage
Services
MARKET INFORMATION

Price Stability Possibilities (Ex.)
33% via
Spot Market

33% on Physical
Contract
PRICE
STABILITY

33% via
Future Market
Group
Approach

Individually
Role of Future Markets
Revenues

Costs

Covering
Revenues

Covering
Costs

MARGIN
Covered
Market Information
Hedging
 Hedging ≠ Speculation !!

 Hedge-Effectivity (HE):
 Hedge-Ratio (HR):
Or

 Covering 1 Ton Spot Commodity = 1 Ton Future Commodity

 Covering 1 Ton Spot Commodity (Feed) ≠ 1 Ton Future Commodity

Correct Hedge-Strategy = Correlation + ‘Basis’ + HE + HR !!

HE
Example 1: Graphical Presentation

Correlation with
Feed Wheat
98,26%

BASIS !

MPH = Multiple-Product Hedge Strategy
= (HR x Corn) + (HR x Rapeseed) + (HR x M.Wheat)
Example 2: Pig Trading Companies (PTC)
• PTC-West Cvba (18-07-12) & PTC-Oost Cvba (04-09-12)
 68 Pig & Piglet Producers
 12% of the Belgian Pig Meat Market Share

 Target group : complete ‘Chain’ (Feed producers till Retail)

• PTC – The Netherlands

(France, Denmark, etc.)

• Also :
– Grain Producers, Traders and Processing Industry
– Potatoes Producers, Traders and Processing Industry
– Feed Producers
In Practice: Conclusions
 Correct Correlation, Spread & ‘Basis’ calculations
 ‘BASIS’ (SPOT – Future Price) calculations are crucial !!!

 Graphical Presentations & Technical Analyses
 Simple and Clarifying Database
 ‘Predicting’ the Future with historical data
 Numerous realistic Hedge-Strategies
•

Assessing ‘Good’ Correlations

•

Assessing ‘Good’ Hedge-commodity-basket (Feed = 3-4 Future Commodities)

•

Assessing ‘Good’ Hedge-Effectivity

•

Assessing ‘Good’ Hedge-Ratios

 Formulating Statistical & Objective Buy and/or Sell Strategy!
End

• Questions ?
• More information :

www.dlvmas.be

– 0032(0) 800/90.910, info@dlvmas.be
– Bart Teuwen: bt@dlv.be
– Matthijs Boúúaert: mabo@dlv.be

Risk management in pig farming via futures and hedging