Download to read offline
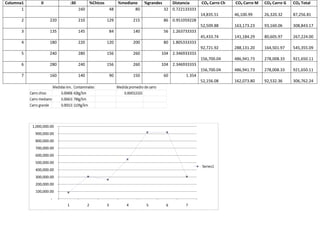


The document appears to contain numeric data in a table with 7 rows and 8 columns. The columns include percentages of small, medium, and large vehicles; distance; carbon dioxide emissions for cars in each category; and total emissions. Row 2 shows the highest percentages of vehicles at 220, 210, and 129 and the highest total CO2 emissions at 308,843.17 kg. Row 5 and 6 are identical with the highest distance at 260 km and the same total CO2 emissions of 921,650.11 kg.


