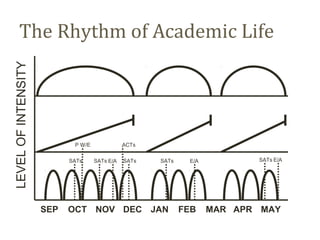
The graph depicts the rhythm and intensity of activities throughout an academic year for a high school student. It shows peaks in intensity in September/October for SATs and ACTs, another peak in January for more SATs and ACTs, and a final peak in April/May for end-of-year exams and SATs. Between the peaks are periods of lower intensity during weekends and holidays.