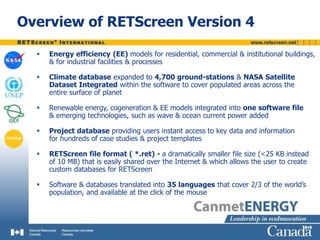
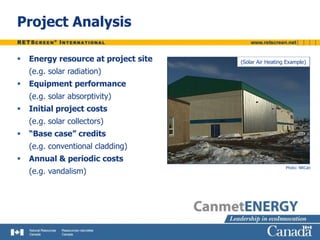
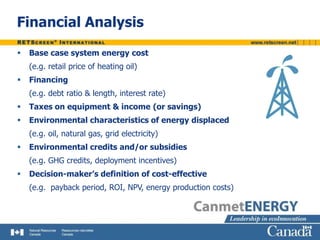
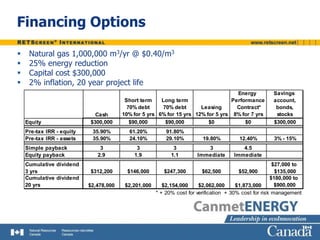
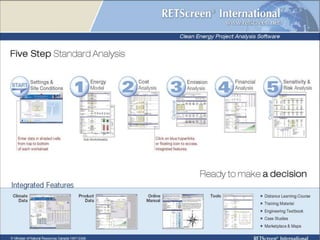
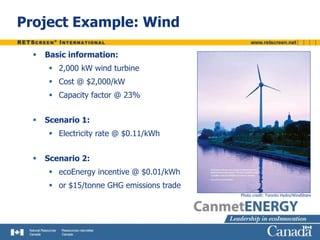
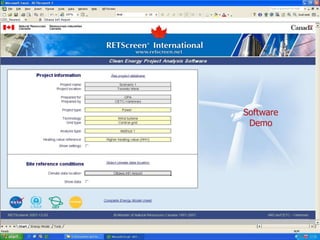
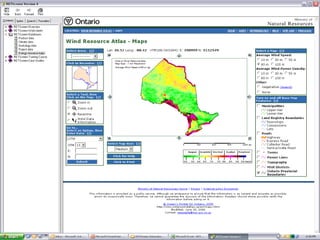
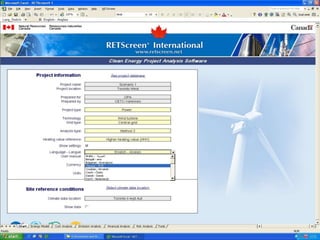
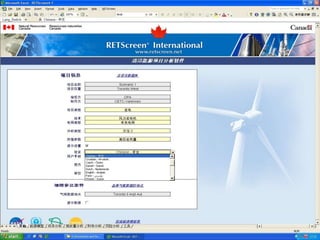
RETScreen®
Introduction
Overview of RETScreen Version 4
 Energy efficiency (EE) models for residential, commercial & institutional buildings,
& for industrial facilities & processes
 Climate database expanded to 4,700 ground-stations & NASA Satellite
Dataset Integrated within the software to cover populated areas across the
entire surface of planet
 Renewable energy, cogeneration & EE models integrated into one software file
& emerging technologies, such as wave & ocean current power added
 Project database providing users instant access to key data and information
for hundreds of case studies & project templates
 RETScreen file format ( *.ret) - a dramatically smaller file size (<25 KB instead
of 10 MB) that is easily shared over the Internet & which allows the user to create
custom databases for RETScreen
 Software & databases translated into 35 languages that cover 2/3 of the world’s
population, and available at the click of the mouse
Project Analysis
 Energy resource at project site
(e.g. solar radiation)
 Equipment performance
(e.g. solar absorptivity)
 Initial project costs
(e.g. solar collectors)
 “Base case” credits
(e.g. conventional cladding)
 Annual & periodic costs
(e.g. vandalism)
(Solar Air Heating Example)
Photo: NRCan
Financial Analysis
 Base case system energy cost
(e.g. retail price of heating oil)
 Financing
(e.g. debt ratio & length, interest rate)
 Taxes on equipment & income (or savings)
 Environmental characteristics of energy displaced
(e.g. oil, natural gas, grid electricity)
 Environmental credits and/or subsidies
(e.g. GHG credits, deployment incentives)
 Decision-maker’s definition of cost-effective
(e.g. payback period, ROI, NPV, energy production costs)
Financing Options
 Natural gas 1,000,000 m3/yr @ $0.40/m3
 25% energy reduction
 Capital cost $300,000
 2% inflation, 20 year project life
Cash
Short term
70% debt
10% for 5 yrs
Long term
70% debt
6% for 15 yrs
Leasing
12% for 5 yrs
Energy
Performance
Contract*
8% for 7 yrs
Savings
account,
bonds,
stocks
Equity $300,000 $90,000 $90,000 $0 $0 $300,000
Pre-tax IRR - equity 35.90% 61.20% 91.80%
Pre-tax IRR - assets 35.90% 24.10% 29.10% 19.80% 12.40% 3% - 15%
Simple payback 3 3 3 3 4.5
Equity payback 2.9 1.9 1.1 Immediate Immediate
Cumulative dividend
3 yrs $312,200 $146,000 $247,300 $62,500 $52,900
$27,000 to
$135,000
Cumulative dividend
20 yrs $2,478,000 $2,201,000 $2,154,000 $2,062,000 $1,873,000
$180,000 to
$900,000
* + 20% cost for verification + 30% cost for risk management
Project Example: Wind
 Basic information:
 2,000 kW wind turbine
 Cost @ $2,000/kW
 Capacity factor @ 23%
 Scenario 1:
 Electricity rate @ $0.11/kWh
 Scenario 2:
 ecoEnergy incentive @ $0.01/kWh
 or $15/tonne GHG emissions trade
Photo credit: Toronto Hydro/WindShare
Software
Demo
RETScreen_Introduction.ppt

RETScreen_Introduction.ppt

  • 1.
  • 2.
    Overview of RETScreenVersion 4  Energy efficiency (EE) models for residential, commercial & institutional buildings, & for industrial facilities & processes  Climate database expanded to 4,700 ground-stations & NASA Satellite Dataset Integrated within the software to cover populated areas across the entire surface of planet  Renewable energy, cogeneration & EE models integrated into one software file & emerging technologies, such as wave & ocean current power added  Project database providing users instant access to key data and information for hundreds of case studies & project templates  RETScreen file format ( *.ret) - a dramatically smaller file size (<25 KB instead of 10 MB) that is easily shared over the Internet & which allows the user to create custom databases for RETScreen  Software & databases translated into 35 languages that cover 2/3 of the world’s population, and available at the click of the mouse
  • 3.
    Project Analysis  Energyresource at project site (e.g. solar radiation)  Equipment performance (e.g. solar absorptivity)  Initial project costs (e.g. solar collectors)  “Base case” credits (e.g. conventional cladding)  Annual & periodic costs (e.g. vandalism) (Solar Air Heating Example) Photo: NRCan
  • 5.
    Financial Analysis  Basecase system energy cost (e.g. retail price of heating oil)  Financing (e.g. debt ratio & length, interest rate)  Taxes on equipment & income (or savings)  Environmental characteristics of energy displaced (e.g. oil, natural gas, grid electricity)  Environmental credits and/or subsidies (e.g. GHG credits, deployment incentives)  Decision-maker’s definition of cost-effective (e.g. payback period, ROI, NPV, energy production costs)
  • 6.
    Financing Options  Naturalgas 1,000,000 m3/yr @ $0.40/m3  25% energy reduction  Capital cost $300,000  2% inflation, 20 year project life Cash Short term 70% debt 10% for 5 yrs Long term 70% debt 6% for 15 yrs Leasing 12% for 5 yrs Energy Performance Contract* 8% for 7 yrs Savings account, bonds, stocks Equity $300,000 $90,000 $90,000 $0 $0 $300,000 Pre-tax IRR - equity 35.90% 61.20% 91.80% Pre-tax IRR - assets 35.90% 24.10% 29.10% 19.80% 12.40% 3% - 15% Simple payback 3 3 3 3 4.5 Equity payback 2.9 1.9 1.1 Immediate Immediate Cumulative dividend 3 yrs $312,200 $146,000 $247,300 $62,500 $52,900 $27,000 to $135,000 Cumulative dividend 20 yrs $2,478,000 $2,201,000 $2,154,000 $2,062,000 $1,873,000 $180,000 to $900,000 * + 20% cost for verification + 30% cost for risk management
  • 9.
    Project Example: Wind Basic information:  2,000 kW wind turbine  Cost @ $2,000/kW  Capacity factor @ 23%  Scenario 1:  Electricity rate @ $0.11/kWh  Scenario 2:  ecoEnergy incentive @ $0.01/kWh  or $15/tonne GHG emissions trade Photo credit: Toronto Hydro/WindShare
  • 10.