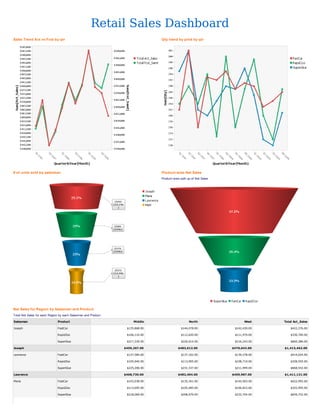
Retail Sales Dashboard
Sales Trend Act vs Fcst by qtr                                                Qty trend by prod by qtr


# of units sold by salesman                                                   Product-wise Net Sales
                                                                              Product-wise split up of Net Sales


Net Sales for Region by Salesman and Product
Total Net Sales for each Region by each Salesman and Product


Joseph                        FastCar                           $135,868.00                 $144,078.00             $142,430.00      $422,376.00

                              RapidZoo                          $106,110.00                 $112,620.00             $111,970.00      $330,700.00

                              SuperGlue                         $217,229.00                 $226,914.00             $216,243.00      $660,386.00

Joseph                                                         $459,207.00                $483,612.00              $470,643.00    $1,413,462.00

Lawrence                      FastCar                           $137,584.00                 $137,162.00             $139,278.00      $414,024.00

                              RapidZoo                          $105,940.00                 $113,905.00             $108,710.00      $328,555.00

                              SuperGlue                         $225,206.00                 $231,337.00             $211,999.00      $668,542.00

Lawrence                                                       $468,730.00                $482,404.00              $459,987.00    $1,411,121.00

Maria                         FastCar                           $143,038.00                 $135,361.00             $144,593.00      $422,992.00

                              RapidZoo                          $113,695.00                 $105,485.00             $106,815.00      $325,995.00

                              SuperGlue                         $218,069.00                 $208,979.00             $232,704.00      $659,752.00
Retail Sales Dashboards

Retail Sales Dashboards

  • 1.
    Retail Sales Dashboard SalesTrend Act vs Fcst by qtr Qty trend by prod by qtr # of units sold by salesman Product-wise Net Sales Product-wise split up of Net Sales Net Sales for Region by Salesman and Product Total Net Sales for each Region by each Salesman and Product Joseph FastCar $135,868.00 $144,078.00 $142,430.00 $422,376.00 RapidZoo $106,110.00 $112,620.00 $111,970.00 $330,700.00 SuperGlue $217,229.00 $226,914.00 $216,243.00 $660,386.00 Joseph $459,207.00 $483,612.00 $470,643.00 $1,413,462.00 Lawrence FastCar $137,584.00 $137,162.00 $139,278.00 $414,024.00 RapidZoo $105,940.00 $113,905.00 $108,710.00 $328,555.00 SuperGlue $225,206.00 $231,337.00 $211,999.00 $668,542.00 Lawrence $468,730.00 $482,404.00 $459,987.00 $1,411,121.00 Maria FastCar $143,038.00 $135,361.00 $144,593.00 $422,992.00 RapidZoo $113,695.00 $105,485.00 $106,815.00 $325,995.00 SuperGlue $218,069.00 $208,979.00 $232,704.00 $659,752.00