1. Electronic Distance Counter
Executive summary
Peatbogs containturf whichcan be usedas a fuel toheathouses.Turf isdug out of the bog and
spreadon landto dry underthe sun. Whenthe turf is dry it will be storedinashedand usedduring
the wintertoheat houses. A machine calledaturf hopperisusedto spreadthe turf.The turf is
spreadinrows,each 91 metres long.Three rowsmake upa plot,thisisthe unitturf issoldin.
Problem Definition
The turf hopperoperatordoesnotknow when91 metresof turf have beenspread.The distance
mustbe measuredandthenmarkedsothe operatorwill know whentostopspreading.
The distance can be measuredbywalkingadistance of 91 metresandputtingdowna stickas the
marker. The problemwiththis isthat operatorstendtohave an inconsistentstridelengthwhich
resultsindifferentlengthrows. A more accurate methodisto use a metre wheel to measure the 91
metres.Thissolvesthe accuracyproblembutittakestime forthe operatorto markout the distance.
The operatormighthave to do thisa few timesperdaywhichwastestime andina turf cutting
seasontime isa preciousresource.
The solution thenisa device onthe machine itselfthatcan calculate the distance of turf spread. This
device shouldhave goodaccuracyand be easyto read.The lengthof the row shouldnotvary more
than 2% fromthe desiredlength. The operatorisconcentratinghardonworkingthe machine and
needstoknowthe distance travelledwithone glance atthe device.
Implementation
The solution wasan electronicdistance counterthatdeterminesthe distancetravelledasthe
machine spreadsthe rowof turf. A sensorismountedoppositeagearin the machinesgearbox.The
gear speedisdirectlyproportional tothe forwardspeedof the machine andthe sensorcandetect
each revolutionof the gear.A microcontrollerisusedtoconvertthe revolutionsof the gearto the
distance travelled inmetres. Thisinformation isdisplayedonaliquidcrystal display whichcaneasily
be viewedbythe operator.
Whenthe device isinstalledona machine ithasto be calibratedbefore itisreadytouse.The device
issimple touse,once the machine startsmovingthe distance will increaseonthe LCD.Before
spreadingarow of turf the counteris setback to zero.A resetbuttononthe device canbe pressed
to setthe counterback to zero. The LCD will displaythe currentdistance travelledsowhenthe LCD
getsto 91m the operatorknowsa row of turf has beenspread.
Evaluation
Evaluation wasbymeansof computersimulationandbuildingaprototype.The computersimulation
involvedcalculatingthe accuracyof the systemat differentdistances.The prototype wasusedto
validate the computersimulationandalso totesthow easyit wasto use.The accuracy of the device
at 100 metreswas0.05% while the largesterrorwas2% whichoccurredat 0.1m. The accuracy test
was carriedouton flathard ground.A stick was usedtomark the start andthena measuringtape
was usedtomeasure a straightline 100m long. The machine wasdrivenfromthe startingpointto
the endand the distance onthe LCD displaywasrecorded.The error wascalculatedfrom the
difference betweenthe measuringtape reading andthe readingonthe LCD.
The prototype wasalso testedat variousdistancesand the results were similartothe simulation
results. The LCD usedonthe device wastestedatdifferentdistancesandunderdifferentlight
2. conditionstodemonstrate itmeetsthe designrequirements. The LCDdemonstrated itcouldbe
viewedfromupto5 metresawayand underdirectsunlightwhichisaprobleminmanyLCD displays.
Thisdevice isaccurate and simplytouse whichmakesita perfecttool forturf hoppers.
Before thisdevice canbe broughtto marketitneedssome small improvements.The sensor
installationneedstobe quickertoreduce the costof installation.The calibrationprocesscouldbe
automatedtosimplify the device use.More functionalitycouldbe addedtoappeal tomore
customers. Whenthese improvementshave beenmade the designshouldbe marketedtoappeal to
turf cutters.
3. Contents
Executive Summary ...................................................................................................................... 1
Problem Definition.................................................................................................................... 1
Implementation........................................................................................................................ 1
Evaluation................................................................................................................................ 1
Problem Definition ....................................................................................................................... 1
Problem...................................................................................................................................2
Existing solutions...................................................................................................................... 2
Design requirements................................................................................................................. 2
1. Have an accuracy of 1% at 100 metres............................................................................ 3
2. Have an accuracy of 2% at all other distances..................................................................3
3. Give the operator a distance update every 0.1 metres..................................................... 3
4. The operator must be able to read the display from 2 metres ..........................................3
5. The operator must be able to read the display under all light conditions........................... 3
Implementation............................................................................................................................ 4
Proximity Sensor................................................................................................................... 4
Microcontroller..................................................................................................................... 5
Liquid Crystal Display............................................................................................................. 5
Detailed description.................................................................................................................. 5
Proximity Sensor................................................................................................................... 6
Microcontroller................................................................................................................... 10
Liquid Crystal Display........................................................................................................... 16
How the designis used............................................................................................................ 17
Calibrating device................................................................................................................ 17
Operation modes: ............................................................................................................... 17
Reset / Zero counter............................................................................................................ 18
Evaluation.................................................................................................................................. 18
Overview................................................................................................................................ 18
Prototype............................................................................................................................... 19
Testing and Results................................................................................................................. 20
Design Requirement 1 – accuracy of 1% at 100m .................................................................. 20
Design Requirement 2 – accuracy of 2% overall..................................................................... 20
Design requirement 3 – update displayevery 0.1 metres....................................................... 21
Design requirement 4 – view display from 2 metres.............................................................. 22
4. Design requirement 5 – view display in all light conditions..................................................... 22
Assessment............................................................................................................................ 23
Design positives .................................................................................................................. 23
Design negatives ................................................................................................................. 23
Next Steps.............................................................................................................................. 24
Appendices ................................................................................................................................ 25
Appendix A – Circuit Diagram............................................................................................... 25
Appendix B – Theoretical System Accuracy ........................................................................... 32
Appendix C – Software......................................................................................................... 33
5. 1 | P a g e
Problem Definition
Peatturf iscut from bogsand spreadonland to be driedbythe sun and thenbroughtto people’s
home to be burnt as a fuel forheatinghouses.Peatturf orturf is a poor qualitycoal andis made
fromlayersof deadvegetationthathasdecomposedovermillionsof years.The turf isdug outof the
bog usinganevacuatorand spreadout on dryland usingwhatiscalleda turf hopper.There are
differenttypesof turf hoppers;wheel hoppers,trackhoppersandself-propelledhoppers.Wheel
hoppersare similartotrailersandare pulledbytractors,trackedhoppersuse tracksinsteadof
wheelsandself-propelledmachinesare ontracks anduse theirownenginestopropel them.Turf is
extrudedfromthe hopperontothe groundinwhat are calledsods of turf.Sods are square in shape
and about1 footlong. The sods come out of a spout whichwill spreadtensodsata time one beside
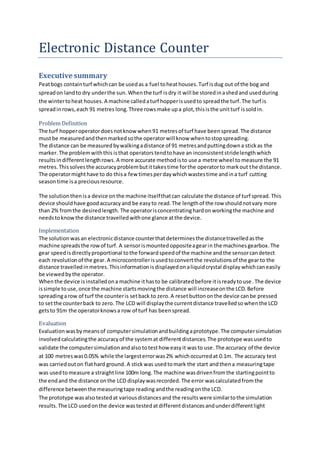
the next.Thisiscalleda tensod hoppersince itspreadstensodsat a time.Below isa picture of turf
inrows:
Figure 1
Rows of turf spread on land
Most turf contractors will spreadarowof turf 100 yards long,3 of these rowsmake upa plot.A plot
isthe mostcommonunitof sale of turf.
6. 2 | P a g e
Problem
To determine the distance of arowof turf, withoutleavingthe machinescab.
A rowof turf is100 yardsby 10 sodswide whichis1000 yardsof a single sodof turf. 3 rowsmake up
a plotand thisis the unitturf is soldin.It isimportantthento getthe lengthof a row right, if it is too
longmoneyisbeinglost,too shortand customers are gettinglessturf thantheypaidfor. The rows
can be 1 or 2 yards longerorshorterwithoutcausingany problems,butlarge variationscanbe
problematic.Itisnoteasyfor the operatorto judge when100 yardsof turf has been spread. If the
turf was all the same densitythe operatorcouldtake the same loadeverytime andspreaduntil the
hopperwasempty.However,the densityof turf changesfrombogto bog and some bogscan get
100 yardsof turf witha significantly smallerloadthanotherbogs.
Existing solutions
As the problemoutlinesthe distanceof turf spreadmustbe known,currentlythere are two
solutions:
1. The operatorwill walk100 strideswitheachstride length1yard long.
2. Use a metre wheel tomarkout91 metreswhichisequivalentto100 yards.
The firstsolutionworkswell whenthe operatorhasa stride thatis 1 yard long and has a consistent
stride,butmanyoperatorseitherhave astride that istoo short, too longor not consistent andthis
can leave a bigerror inthe distance.The secondsolutionisaccurate buttime consumingbecause
the operatorhas to stopwork,get out of the machine andwalkalongwitha metre wheel tomark
out the 91 metres.
In some casesthe groundwhere the turf is beingspreadmightnothold91 metresof turf and the
rowsmust be shortened.The shorterrowsmustbe a multiplyof aplot(91 x 3, 68 x 4, 55 x 5, or 45 x
6) and thusa newmeasurementisneeded.Thisisagainmore time lostandreducesefficiency.
The solutiontothisproblemisalreadyon manytractor driven hoppers.Moderntractorshave
distance counterswhichcanbe usedto determine the distancetravelled.Butself-propelled
machinesdonot have thisdevice andmanyturf cuttingmachinesare self-propelled.
The solutiontothe problemisa distance counteronthe machine itself thatdoesnotrequire the
operatorto leave the cab.
Design requirements
The overall designrequirementwill be todesignadistance counterthatcan be fittedtoa self-
propelledturf hopper. The distance counterwill allowthe operatorspreadanydistance of turf
withoutthe needtogetout of the machine tomeasure the distance.
To achieve thisoverall requirement,more specificrequirements mustbe used. The firstwill be the
accuracy at the critical distance whichis91 metres.The overall accuracyof the systemshouldalso
be satisfactory.Distance counters intractorswill usuallyupdate the distance aftereverymetre
travelled;thiswouldadequateforthe operator since ametre too shortor too longwill notbe a
problem.Butif the systemcan be designedtobe more accurate withoutmuchextrawork thiswould
be desirable.If the displaywasupdatedafterevery0.1metresitwouldmeanthe operatorcouldbe
more accurate. The operatoris concentratinghardonmakingsure the rowsof turf are straightand
7. 3 | P a g e
the sodsof turf are good quality.Thisdoesnotleave muchtime forlookingatthe displaysothe
displaymustbe veryeasyto read.
The followingare the design requirementsthatmustbe met:
1. Have an accuracy of 1% at 100 metres
2. Have an accuracy of 2% at all otherdistances
3. Give the operatora distance update every0.1 metres
4. The operatormust be able to readthe displayfrom2 metres
5. The operatormust be able to readthe display inall lightconditions
1. Havean accuracyof1% at 100metres
The allowable errordistance will be 1metre at 91 metres(90m – 92m) thisis justover1% error.To
simplifyexplanations,calculationsandtesting 100 metreswill be usedinthe designrequirement.
The percentage errorwill be a little lowerthanif 91m were usedsoit will notnegativelyaffectthe
systemaccuracy.
2. Havean accuracyof2% at all other distances
Otherdistancesthatthe systemneedstobe accurate at are: 45m, 55m, 68m, 137m and 182m so
insteadof settingarequirementforeachan overall systemaccuracywill be setat2%. This value is
beingchosenbecause itwill make iteasiertodesignthe systemif there are distanceswhere the
accuracy is difficulttogetunder1%.Once the critical distance (100m) isaccurate to 1% and the
otherdistancesare accurate to 2% the designwill be satisfactory.
3. Givethe operatoradistanceupdate every0.1 metres
An update every1metre wouldbe adequate,every0.1mwouldgive the operatormore accuracy.
Anotherreasonisif the accuracy of the systemcannotmeetthe designrequirementsthe operator
mighthave to determine the inaccuraciesatthe differentdistances;havingthe abilitytosee values
withinametre will allowthe operatortogetmore accuracy out of the system.Considerif the
operatorknowsthat at 137m the distance counterwas 0.5m too shortand the value thatshouldbe
stoppedatis 137.5m. Havingan update every0.1m will allow the operatortodothis,otherwise the
stopvalue wouldbe 138m, 0.5m too far.Of course thisis still withinthe limitsforthisapplication
but if itis possible toimplementanupdate every0.1mthe overall accuracycan be improved.
4. Theoperatormust beable to read the displayfrom2metres
The displaymustbe large enoughtoeasilyreaditfrom a distance of 2 metres.Thiscanbe easily
testedbyplacingthe displaytwometresawayfromthe operatorandchangingthe valuesto see if
the operatorcan determine whateachone is.The operatormustbe able toquicklyrecognize each
value.The LCD resolutionwill alsoplayarole inthe clarityand viewingdistance of the display.
5. Theoperatormust beableto read the display underall lightconditions
The sun isverybrightand can make it verydifficulttoview the display.Thisoftenhappenswhenthe
sunis lowinthe sky. The machine orientationcannotbe changedinmostcasessothe displaymust
account forthis. This can be tested byfacingthe displaytowardsthe sunat differentanglesand
askingthe operatorto recognize the valuesonthe display.Thisshouldalsobe done atnightto
ensure the displayisvisible inthe dark.
8. 4 | P a g e
Implementation
Thisdesigndisplaysthe distancetravelledbyamachine inmetresona liquidcrystal displaythatcan
be mountedanywhere onthe machine.A sensorismountedinthe gearbox of the machine that
tracks the revolutionsof agearin the gearbox.A microcontrollerthenconvertsthe numberof
revolutionsof the geartoa distance travelledbythe machine.The distance isthendisplayedonan
LCD screenso the operatorcan viewthe information.
Belowisa blockdiagramof the system:
Figure 2
Block diagram of system overview
The distance counteristhe name of the design;a distance counteris the functionthe designcarries
out.The distance counterissplitintothe three componentsthatmake upthe design,aproximity
sensorwhichmonitorsthe revolutionsof agearin the gearbox.The microcontrollerwhichcarries
out all the calculationsandconversionsandthe liquidcrystal displaywhichdisplaysthe distance
travelledinmetres.
ProximitySensor
A proximitysensordetectsmetal objectswithinitsdetectionrange,dependingonthe sensoritwill
be anywhere from2 – 8mm. Whena metal objectisdetectedthe sensorwillchange itsoutputfrom
0 voltsto12 volts.
The sensoris usedtodetectshaft rotation;the sensoris mounted opposite agearinthe gearbox
whichhas teethonit.The sensordetects the teethonthe gearand sendsa signal foreverytooth
that isdetected.The more teethdetectedthe furtherthe distance the machine hastravelled.
The signal fromthe sensorwill be apulse signal thatwill gobetween0vand12v. The
microcontrollerwill counteachtime the sensoroutputs12v.
9. 5 | P a g e
Microcontroller
The microcontrollerisasmall computer.The microcontrollerisusedwiththe Arduinoplatform
whichallowseasyprogrammingandcommunicationwithhardware.The microcontrollerconverts
the sensorssignal tometres andsendsitto the LCD.
The microcontrollerwillcounteachsensorpulse fromthe proximitysensorandstore itin a pulse
counter.Since eachpulse representsaforwarddistance the pulse counterwillholdthe total
distance travelled.The microcontrollerconvertsthe pulse countertoa distance travelled.
Thisdistance isthenwrittentothe LCD registerswhere itcanbe displayedbythe LCD.
LiquidCrystal Display
AlsocalledanLCD display,itisusedto displaymeaningful datafromthe microcontroller.
The LCD takesthe data fromthe microcontrollerandwritesittoits display.Itiscontrolledbythe
microcontrollerusingparallelcommunicationwhichisfastandreliable.
Detailed description
The blockdiagram of the systemisshown infigure 3 below andbreaksdowneachhardware device
intotheirfunctions.Forexamplethe proximitysensorissplitinto“detectmovement”and“send
signal tomicrocontroller”.The firstfunctionistodetectwhenthe machine ismovingandthe second
part is tosendthe informationtothe microcontroller. Someof the functional partsneedtobe
brokendownfurthertohelpexplainwhatishappening,thiswill be done withthe use of headings.
The explanationwill startatthe proximitysensorandfinishatthe LCD to helpunderstandthe
systemfromstart to finish.
Figure 3
Block diagram of system
10. 6 | P a g e
ProximitySensor
The proximitysensorisusedtodetectthe forwardmovementof amachine bydetectingthe number
of revolutions of agear inthe transmissionthatisdirectlyproportionaltothe forwardspeedof the
machine.
A proximitysensordetects objectswithinagivenrange,there are differenttypesof proximity
sensorsforsensingdifferentmaterials;inductive formetal andcapacitive forplasticsare two
commontypes.Thisdesignwill use aninductive sensorsince metal isthe material beingdetected.
An inductive proximitysensordetects metal objectswithinitsrange andclosesaswitchwhichcan
eithersetthe outputof the sensorhighor low dependingonthe circuitconfiguration.
Belowisa diagramof the internal componentsof aproximitysensor:
Figure 4
Inside an induction proximity sensor
How it works
The oscillationcircuitproducesoscillationsof fixedamplitude andfrequency.The inductor(L)
producesa magneticfield.Whenametal object(ortargetinthe diagramabove) isbroughtwithinits
detectionrange the magneticfieldinduceseddycurrents(currentsinaconductordue to a changing
magneticfieldappliedtothe conductor) whichinturn increase the loadonthe oscillatorcircuit.
Withthe increasedloadthe oscillatorcannotsustainthe oscillationsandtheyreduce inamplitudeor
stopcompletely.Anamplitudedetectioncircuitmonitorsthe oscillations andwhentheydecreaseit
will triggerthe outputcircuit. The outputcircuitwill outputahighvoltage (12v) whenthe sensoris
triggeredanda lowvoltage (0v) whenthe sensorisnottriggered.
The blockdiagram belowshowsthe mainfunctions of the proximitysensorinthisdesign.
11. 7 | P a g e
Figure 5
Block diagram of proximity sensor functions
Detect gear rotation
The proximitysensorwillbe usedtodetectthe speedof agear inthe transmissionof the system.
The sensoris placedopposite toagear as shownin figure6, eachtime a toothof the gear passesthe
sensorthe outputof the sensorgoesto12 volts.The sensoroutputwill returnto0 volts whenthe
toothhas passedthe sensor.Asthe nexttoothpasses,the sensorwill output12vagain. Whenthe
sensoroutputgoesfrom0v to 12v it iscalleda pulse.
Figure 6
Proximity sensor outputs a signal when a gear tooth passes it
12. 8 | P a g e
Shaftrotationto sensorsignal
The distance travelledbythe machine canbe determinedusingaproximitysensor tocountthe
numberof revolutionsof agearin the transmission. The sensoroutputsapulse foreverytooththat
passesit.If the gearhas 10 teeth,after10 sensorpulsesthe gearwill have completed1revolution.
Thisrevolutionwill have movedthe machine forwardbyadistance X,thisdistance can be
determinedby usingameasuringtape.Dividingthisdistance bythe numberof teethonthe gear(10
inthiscase) will give the distance travelledbythe machine betweeneachpulse.Thisiscalledthe
pulse distance.
The pulse distance isdividedinto1metre to determine the numberof pulsespermetre.Thisis
calledthe calibrationvalue andmustbe setto provide anaccurate system. Thisalsodeterminesthe
resolutionof the system,the smallerthe pulsedistance the higherthe resolutionsince the pulse
distance is the smallestdistance the systemcandetect.
Calibration
In mostcasesthe pulse distance will notbe knownbecause the numberof teethonthe gear will not
be known.If the numberof teethonthe gear is knownthenthe followingstepswill calibratethe
device:
1. Calculate pulse distance
2. Calibrationvalue =1 / pulse distance
3. Testmachine over100 metrestoverifyaccuracy
4. Adjustcalibrationvalue if necessary
The calibrationvalue isselectedusingapotentiometerconnectedtoaninput pinon the
microcontroller,the inputisbetween0– 5v and thismapsto valuesbetween0– 200 pulsesper
metres.Valuesoutside thiscanbe selectedbutitisexpectedthatthese valueswillbe suitablefor
mostsystems.If the pulse distance cannotbe calculatedthe calibrationdistance mustbe setto100.
Thenthe followingsteps will calibrate the system:
1. Setcalibrationvalue to100
2. Measure a distance of 100m onflat dry groundwithmeasuringtape
3. Drive the machine the 100m distance
4. Note the readingonthe display
5. Thisis the newcalibrationvalue
6. Retestnewvalue over100 metres
7. If the systemisnotaccurate make a small change to the calibrationvalue
8. Retestandre-tweakuntil accuracyisacceptable.
Example:pulse distance isunknownsocalibrationvalueof 100 is chosen, the calibrationvalue is
selectedusingthe potentiometerandthe vehicleisdriventhe 100 metresmarkedout.Afterthe 100
metresthe displayshows110 metres.
The newcalibrationvalue willbe:110
The machine istestedagainand thistime the displayshows100m.
13. 9 | P a g e
Send pulses to microcontroller
Everytime a toothpassesthe sensora voltage pulse isproduced. The schematicdiagramforthe
sensorisshownbelowin figure7.L+ isthe powerintothe sensorwhichisconnectedinparallel to
the load.The L- wire isconnectedtoground.The switchinthe diagram isclosedwhenthe sensoris
triggeredandcurrentcan flowthroughthe load.In thisdesignthe loadwill be apull downresistor
and the outputwill be takenoff the ‘BK’wire.Thiswill be connectedtothe inputpinof a
microcontrollerwhichwill detectwhetherthe voltage islow (<2v) orhigh(>3v).Whenthe sensoris
not triggeredthe ‘BK’wire will be connectedto 12v throughthe pull upresistorand whenthe sensor
istriggeredthe ‘BK’wire will be connectedto0vthroughthe sensorswitch.
The microcontrollercanonlyinputvoltagesbetween0– 5v. The 12v mustbe convertedto 5v; thisis
achievedusingavoltage dividerasshownin figure8. Figure 8 showsthatthere isan 8 kiloohm
resistorbetweenthe sensoroutputandground.Thiscreatesa voltage dividerwiththe 10kpull
downresistor.The voltage atthe sensoroutputwill thenbe 5.3v whichiswithin the inputlimitfor
the microcontrollerinput.
The voltage seenbythe microcontrollerwill be 5vwhenthe sensorisnottriggeredand0v whenitis
triggered. The microcontrollerregistersa pulse whenthe voltagechangesfrom5vto 0v, to register
anotherpulse the voltage mustfirstreturnto5v. In the previoussectionsitwasexplainedthata
pulse occurswhenthe sensoroutputgoesfrom0v to 12v, thiswasjust forexplanationpurposes.It
iseasierto understandthata pulse occurswhenthe voltage goesfromlow tohigh.It doesnot
matterwhichway a pulse is determinedbecausethe pulse signal repeatsitself.
Figure 7
Circuit schematic of output circuit for proximity sensor
14. 10 | P a g e
Figure 8
Voltage divider circuit: 12v input -> 5v output
Microcontroller
The microcontrollerunit(MCU) isthe brainof the systemandcoordinatesthe sensorandthe display
to translate the sensoroutputtoa distance inmetresona LiquidCrystal Displaythatcanbe readby
an operator.The microcontrolleralsoprovidesfunctionalityintermsof twooperatingmodesand
the optionto zerothe distance travelledatanytime andstart countingagain.
The microcontrollerusedinthissystemisanAtmel ATmega328microcontroller.Itisan8 bitMCU
with32KB of flashmemorywhichcanbe usedforprograms.It uses 2KB of SRAMand can run at
clock speedsup to20MHz.
The ATmega328 inthisproject isusedinside an ArduinoUnoplatform.Arduinoisanopensource
hardware platform.Basedaroundthe Atmel ATmegamicrocontroller,Arduinoisanenvironment
that makesmicrocontrollersmuchmore accessible.Ituseshardware thatallowseasy
communicationwithPC’sforprogramming,aswell as aprogrammingenvironmentthatisbased
aroundC/C++ butuses special librariestosimplifyhardware configuration.
The ArduinoUno isusedinthisprojectand the connectionsmade tothe sensorand the LCD are
showninthe electrical diagramin AppendixA
15. 11 | P a g e
Belowisa blockdiagramof the basicfunctionscarriedoutby the MCU. Each functionisdiscussedin
detail overthe followingsections.
Figure 9
Function diagram of microcontroller
Detect pulsefrom sensor
Whenthe sensoristriggered itsendsa pulse tothe microcontroller,the microcontrollermustbe
constantlymonitoringthe sensortodetect the pulse.There ishardware onthe microcontrollerthat
can constantlymonitora pinto detecta change involtage level.The pinisa digital pinmeaningthe
microcontrollerwill eitherconsideritHIGH (>3v) or LOW (<2v), thisisalsocalledthe state of the pin.
The hardware monitorsthe pinfor a change in state;a change in pinstate iscalledan event.An
eventcanoccur intwo ways:
1. PinchangesfromLOW toHIGH
2. PinchangesfromHIGH to LOW
Whenan eventoccursan interruptiscalled.Aninterruptisapiece of software thatstopsthe main
program andruns anothersoftware functionbefore returningbacktothe main program. Interrupts
are usedto monitorhardware attachedtocomputers.Withoutthem the software wouldhave to
monitorthe hardware,meaningitwouldnotbe able tocarry out othertasks. The interruptcanbe
configuredtobe calledwhenthe pinchangesfromLOW to HIGH, HIGH to LOW or justwhenthe pin
changesstate.The software functionrunbythe interruptiscalledanInterruptSub-Routine(ISR).
Whenthe sensorsendsa pulse the microcontrollerdetectsthe pulse andtriggersanISR. A counteris
usedto keepcountof the total numberof pulsesfromthe sensor;thisiscalledapulse counter.Itis
an integervariable thatisincrementedeverytime apulse isdetected.The value of this variable
(pulse counter) canbe checkedatany time bythe software program.
Select countingmode
There are twocounting modesthatcan be usedwiththe distance counter:
1. Continuouscounting –countsonce the machine ismovingforward
2. Start - Stop counting– countsif the machine ismovingforwardandthe start-stopswitchisclosed.
Start – stopcountingusesa switchto control whetheritcountsor not;if the switchisclosedthe
counterwill incrementandif the switchisopenthe counterwill notincrement.The switchcanbe
placedanywhere onthe machine andcan be activatedbya mechanical switch.
16. 12 | P a g e
The mode selectioniscontrolledbyatoggle switchconnectedtoaninputpinon the
microcontroller.The start-stopswitchisalsoconnectedtoaninputpinon the microcontroller.
Duringthe software programthe state of these pinsare checkedtodecide whichmode toselectand
whetherornot to incrementthe counter.The followingisthe software flowdiagramof the check:
Figure 10
Flow chart of counting mode selection
17. 13 | P a g e
Figure 10 showsthatthe mode selectionswitchischecked andthenthe start-stopswitchischecked
and onlyif the start – stopswitchisHIGH will the counterincrement.
The “incrementcounter”will incrementthe pulsecounter.
Set flag to updateLCD
The LCD isupdatedevery0.1 metres;a flagcalledthe “Update LCD Flag” isusedto signal the LCD to
update.The calibrationvalue isthe numberof pulsesinametre andone tenthof thisvalue isthe
numberof pulsesintenthof a metre.Thisvalue iscalledthe “calibrationtenth”.Eachtime the pulse
counterincrementsby anamountequalling the “calibrationtenth”the “Update LCDFlag” isset. And
the LCD isupdated.
To determine if the pulse counterhas incrementedby the calibrationtenth anintegeris usedfor
comparison. The pulse counteriscomparedwiththisintegerandwhentheyare equal the flagisset.
Thisintegeriscalledthe “nextupdate pulse”andiscalculatedusingthe formula:
next update pulse= (calibrationtenth) x(index+1)
The variable “index”inthe formulaabove isanintegerthatisincrementedeverytime the “Update
LCD Flag” isset. It holdsthe numberof flagupdatesandis alsousedto calculate the metres
travelled.Tocalculate the “nextupdate pulse”avalue of 1 must be addedto “index”because this
will be the numberof pulses needed forthe nextLCDupdate.
Aftereachflagupdate the index will be incrementedby1.Thenthe “nextupdate pulse”will be
calculated.Thisisthe value the pulse countermustreachbefore the flagissetagain.
Rounding error
In some casesthe calibrationvalue willnotbe an integer;itwill have one significantdigit.This
meansthe “nextupdate pulse”will alsohave one significantdigitandthuswill notbe an integer.
Thiscannot be comparedagainstthe pulse countersince itonlyholdsintegervalues.Itmustbe
roundedtothe nearestintegerandthencompared.Thiswill introducearoundingerror,butas
showninthe table in AppendixB thiserror tendsto zeroas the distance increases.The table shows
that the roundingerrorresultsinan errorof 1.7% at 0.1 metresand 0.05% at 3 metres.The table
alsoshowsthe actual errorin millimetres(mm),the actual errorvariesasthe distance travelled
increasesbutthe range of the actual error (-3mm to +3mm) doesnotchange.The reasonthe
percentage errorreducesisbecause the distance travelled becomes largercomparedtothe actual
error.
Calculate metre value
Whenthe “Update LCD Flag” issetthe numberof metrestravelledmustbe calculated.
The followingformulaisusedforthe calculation:
metres = 0.1 x index
Anotherwayof lookingatthisformulais,the “index”isthe numberof 0.1 metrestravelled.
For example if the flaghasbeenset10 times:
18. 14 | P a g e
metres = 0.1 x 10 = 1 metre
Thisis the metre value thatwill be senttothe LCD.
Reset Counter
The distance countercan be resetor zeroedat anytime usinga pushbutton. The pushbuttonis
connectedtoa pin onthe microcontroller(MCU).The pinisat 0v whenthe buttonisnot pressed,a
buttonpressconnects the pinto 5v. It is configuredtocall aninterruptwhenthe pinchangesfrom
LOW (0v) to HIGH (5v). The interruptstopsthe software program andrunsan ISR and thenreturns
to mainprogram. The ISR resetsthe variablesusedinthe mainprogramtozero.The variablesthat
are resetare:the metresvalue,pulse counterandthe index variable.
SoftwareProgram
The software programimplementsthe sectionsaboveonthe microcontrollerandthe code is
includedinthe designfolderandisverywell commented. The code takesup10 pagesand isalso
easiertoread ina C++ editor. The software code followsthe logicinthe sectionsabove andalong
withthe commentsisveryeasyto follow. The followingisaflow chartthat givesan overview of the
software program.
19. 15 | P a g e
Figure 11
Flowchart for software program
20. 16 | P a g e
The flowdiagramabove showsthe mainprogram onthe left,the sensorinterruptinthe middle and
the resetinterruptonthe right.The flowdiagramshowsthatthe program islogical and
straightforward.Itfollowsthe explanationof the systeminthe implementationsection.The sensor
interruptwill be calledwhenthe MCU detectsapulse onthe pin connectedtothe sensor.The reset
interruptwill be calledwhenthe resetbuttonispressed.
LiquidCrystal Display
An LCD isusedto displaythe distance tothe operator,the distance will be updatedeverytenthof a
metre.The LCD is a transflectivedisplaywhichmeansunderbrightsunlight the charactersonthe
displayreflectthe lightandthismakesthem easytoread.In dull or dark conditionsthe LEDbacklight
illuminates the display andiseasytoread. The LCD is a 16x2 character displaywhichmeansithas2
rowsof characters and16 columns. The LCD communicateswiththe MCUusinga parallel interface.
The circuit diagramin AppendixA showsthe connectionstothe MCU. The LCD will update whenthe
MCU setsan update flagand sends a new value todisplay.
Figure 12
Functional diagram of Liquid Crystal Display
MonitorUpdateFlag
The microcontrollerusesan“Update LCD Flag” to triggeran LCD update.Whenthisflagissetthe
microcontrollerwill sendthe LCDa newvalue towrite toits display.
Write metre valueto LCD
Whenthe “Update LCD Flag” issetthe MCU starts communicationwiththe LCDdisplay.The MCU
usescommandsto write informationtothe LCD registerswhichthe LCDwill write tothe screen.The
distance travelledwillbe senttothe LCD registersandthenthe LCD will displaythisonthe screen.
Reset UpdateFlag
The “Update LCD Flag” mustbe resetafterthe displayisupdatedotherwisethe LCDwill update the
metre value everysingle pulsefromthe sensor.Thisisdone inthe MCU software whenthe LCD has
confirmedthe informationhasbeensuccessfullywrittentothe screen.
21. 17 | P a g e
LCD Backlight
The LCD displayhasa powerful backlightthatwill illuminatethe displayindull ordarkconditions.
The backlightcan draw 200mA of current;the connectionforthe backlightisshownin AppendixA.
The powerresistorisveryimportanttopreventhighcurrentsinthe LEDs that powerthe backlight.
How the design is used
Thisdesignisverystraightforwardtouse,the firstpartis to calibrate the device toaccurately
determine the distance travelled.Thenthe operatorcanactuallyuse the device todeterminethe
distance travelled.There are twomodesof operation:continuousandstart-stop,continuousisthe
defaultandissimple apointandshoot approach,drive the machine andthe distance will increment.
The start-stopmode ismore sophisticatedandusesaswitchto start countingor stopcounting.The
ideaisthat the switchwill be mountedonthe machine andwill monitoramechanical mechanism.
The mechanismwill be usedto control whenthe distance isincremented.A resetbuttonisusedto
resetthe counterto zero.
Calibratingdevice
The calibrationvalue isselectedusingthe calibrationpotentiometer;itisreadeverytime the device
ispoweredon. The potentiometerwill outputa value of 0v – 5v whichthe MCU will convertto0 –
200 pulsespermetre.The potentiometeristurneduntil the correctvalue isselected.The device
mustbe restartedeverytime adifferentcalibrationvalueisselected. The LCDwill displaythe value
selectedbythe potentiometerduringdevice startup.
The followingare stepbystepinstructionsoncalibratingthe device:
1. Enter a calibration value of 100 pulsespermetre usingpotentiometer
2. Mark out100 metresonflatsolidground witha measuringtape
3. Drive the machine tothe start of the 100m andresetthe counterto zero
4. Drive the machine tothe 100m mark and recordthe value onthe display
5. Thisis nowthe newcalibrationvalue
6. Enter thisvalue intothe MCU usingthe potentiometer
7. Testthiscalibrationvalue over100m as before
8. Reduce the calibrationvalue if the displayvalue islowerthan100
9. Increase the calibrationvalue if the displayvalue isgreaterthan100
The device isnow calibrated;thisvalue willbe readfromthe potentiometereverytime the device is
poweredon.Be sure not to change the potentiometerspositionunlessre-calibratingthe device.
Operationmodes:
There are twomodesof countingthat can be used:
1. continuouscounting:keepscountingaslongasthe machine ismoving
2. start-stopcounting:aswitchor external eventcanbe usedtostop andstart counting
Once the device ispoweredona toggle switchcanbe usedto choose betweenthe twomodes.
22. 18 | P a g e
Continuous counting
As the name suggeststhe distance counterwill increase once the machine ismovingeitherin
forward or reverse direction.Whenthe resetbuttonispressedthe counterwill be zeroedand will
start countingfromzero.
Start– Stop counting
Thismode will use aswitchto start countingandstop counting,whenthe switchispressedthe
counterwill incrementandwhenthe switchis released the counterwill stop.Thisisintendedtobe
activatedbya mechanical mechanismonthe machine.Forexampleonthe turf hopperthe spoutis
loweredtospreadturf and raisedtostop spreading.A switchcouldbe mountedtothe spoutand
close whenthe spoutwasdownand openwhenthe spoutwasup. Thisallowsthe operatortocount
the total distance of turf spread.
Reset / Zero counter
A resetbuttonisusedto zerothe displayatany time andit can be pressedwhile the machine is
stationaryor moving.The displaywill startcountingatzeroagain.
Evaluation
An evaluationmustbe carriedouttodetermine how well the designmeetsthe original requirement.
The followingsectionswill walkthroughthe testingthatwascarriedout to demonstrate thatthe
designmeetsthe original requirement.
Overview
Evaluation forthisdesignwascarriedoutthroughcomputercalculations,buildingaprototype and
fieldtestingtodemonstrate thatthe designrequirementswere satisfied.The mostimportant
requirement,wasthe accuracy over100 metres.The othersignificantrequirementsconcernedthe
update distance interval of the displayandthe readabilityof the display atdifferentdistancesand
underdifferentlightconditions. These are importantsince the operatormustbe able toknow the
distance travelledwithone quickglance atthe display.
The prototype will be discussedinthe nextsectionandthenthe testingandresultswill be shown
and discussed.The followingtable givesanoverview of the designrequirements,the testscarried
out andthe score neededtopassthe tests.
DesignRequirement Evaluation test Acceptable value
Accuracy of 1% at 100m 100m test 1%
Overall accuracyof 2% Variousdistance tests 2%
Update every0.1 meters Checkdistance at every0.1m 1%
Viewdisplayat2 metres Changingdisplaywith operator
feedback
Operatormustget all
valuescorrect
Viewdisplayinall lighting
conditions
Operatingdisplayindifferent
lightingconditionswithoperator
feedback
Operatormustget all
valuescorrect
Table 1 – Designrequirements
23. 19 | P a g e
Prototype
A prototype wasbuilttodemonstrate thatthe designwouldmeetthe requirements.The prototype
has the sensormountedoppositeagearin the final drive of the machine.The machine ishydrostatic
meaningituseshydraulicpumpstodeliverpowertohydraulicmotorstopropel the machine.The
motorsare highrpm and lowtorque motors andcannot be usedto directlydrive the machine.A
gearbox isusedto reduce the speedfromthe motorand increase the torque tothe machine.The
sensorismountedinthisgearbox andmonitorsa gearwith6 teeth thatspinsat up to 4000 rpm.The
microcontrollerandLCDdisplayare inthe cabin of the machine.Forthe prototype theyare housed
ina lunchbox for ease of installation.The prototype hasalarge LCD display,powerswitch,reset
buttonand a toggle switchforselectingthe countingmode.
Belowisa photographof the prototype:There are twoswitches, powerswitch(left), countmode
selectswitch(centre) andaresetbuttononthe right.
Figure 13
Photograph of prototype
The prototype will take the signal fromthe sensor,convertitintometresanddisplayanew metre
value onthe LCD every0.1m.The resetbuttoncan be usedto resetthe counterto 0. The counting
mode switchwill change the mode betweencontinuouscountingandstart-stopcounting.
Continuouswillcontinuecountingonce the machine ismovingforward.Start-stopcountingwill
count whenthe switchisinthe start positionand stopscountingwhenthe switchisinthe stop
position.
The prototype can be usedto directlytestthe accuracy of the designbycomparingameasured
distance tothe readingonthe LCD. The prototype wasusedinthe machine fora monthwhich
allowedthe final twodesignrequirementstobe tested.The firstwasworkingwiththe LCD2 metres
away fromthe operatorand the secondwasworkingthe LCD underdifferentlightingconditions.
24. 20 | P a g e
Testing and Results
The designrequirementsweresetoutbefore the designstartedandeachone will be evaluatedin
thissection.The following are the designrequirements:
1. Have an accuracy of 1% at 100 metres
2. Have an accuracy of 2% at all otherdistances
3. Give the operatora distance update every0.1 metres
4. The operatorshouldbe able to view the displayfrom2metresaway
5. The operatorshouldbe able to view the displayinall lightconditions
DesignRequirement1 – accuracyof1% at 100m
Thisis the principle requirementbecause the maindesigngoal wastodetectwhen the machine
travelled 100 metres.
Method of testing
The accuracy testwas carriedout usinga 100 metre measuringtape placedalongflathardground.
The machine wasthencalibratedanddrivenoverthe 100 metres5 times.The counterwas setat
zeroat the start of each run and the displaywasreadwhenatthe endof the 100m tape.
Results – test 1
Test No. Display Reading
at 100m
% error
1 99.95 0.05
2 100.00 0.0
3 99.98 0.02
4 99.99 0.01
5 100.02 0.02
Table 2 – 100m testresults
Discussion
The table above showsthe results, the largesterrorwas0.05% whichisan insignificanterror.This
satisfiesthe designrequirementandprovesthe accuracyof the systematits operational distance is
excellent.
DesignRequirement2 – accuracyof2% overall
The accuracy at 100 metresshouldbe the highestbecausethisisthe distance the systemis
calibratedat.The overall accuracyshouldbe within2% andthiswill be measuredatlowervalues
and highervaluestodetermine the overall accuracyof the system.
Method of testing
The method of testingwill use ameasuringtape laidoutonflathard ground.The systemwill be
calibratedto100 metres asbefore.Thistime howeverthe distanceswill varyandeachdistance will
onlybe testedonce.The distanceswill range from1m to 1000m.
25. 21 | P a g e
Results – test 2
Test Distance
(metres)
Displayreadingat test distance % error
1 0.99 1
5 4.99 0.2
10 10.03 0.3
50 49.98 0.04
150 150.01 0.02
500 499.95 0.01
1000 1000.1 0.01
Table 3 – test 2 results
Discussion
The theoretical systemaccuracyisshownin Appendix B at differentdistances.These were
calculatedfromsimulationsof the system.The actual resultsfromtesting are inthe table above.
Thistable shows that the errorsare higherbutthe percentage errorreducestoeffectivelyzeroas
the distance getslarger.The largererror intestingcouldbe downsmall errorsinreadingsandthe
machine nottravellingin acompletelystraightline.If the machine veersslightlyoff line the distance
will be increased. Alsoif there isasmall slippage inthe tracksthe distance couldalsobe increased
and therebydecreasingthe accuracy.These factorsare small andthe largesterror was1% whichis
inside the designrequirementof 2%.
Designrequirement3 – update displayevery0.1metres
The displaycan be updatedat anyrate fromeverysingle sensorpulsetoanynumberof metres.The
requirementforevery0.1metre was selectedtoprovide the operator withabalance between
resolutionanddistraction.Updatingthe displayatalowermetre value wouldincreaseresolution
but havingthe displaychangingtoofast wouldbe distractingtothe operator.
Method of testing
Lay a measuringtape onflathard ground,start the machine at0m andresetthe displayto0. Start
movingthe machine andeverytime the displayupdatesmeasurethe distance onthe measuring
tape.Do thisuntil the machine reaches1 metre andrecord the results.
Results – test 3
Distance on tape Displaydistance % error
0.102 0.1 2
0.196 0.2 2
0.298 0.3 0.66
0.402 0.4 0.5
0.503 0.5 0.6
0.595 0.6 0.8
0.699 0.7 0.2
0.802 0.8 0.3
0.900 0.9 0.0
1.002 1.0 0.2
Table 4 – test 3 results
26. 22 | P a g e
Discussion
The resultsinthe table above showsimilar atrendto the two previousresults,asthe distance
increasesthe accuracy increases.The resultsshow thatthe displayupdatesevery0.1mwithand
minimumaccuracyof 2% whichiswithinthe overall systemerror allowed. Readingsinthistestare
small whichcouldhave ledtolargererrors.
Designrequirement4 – viewdisplayfrom2 metres
Thistestwill evaluate the LCDdisplayssize andreadability.The operatorshouldnothave tostare at
the LCD to knowhave farhas been travelled;aquickglance shouldbe enoughtogeta clear reading.
Method of testing
The displayismounted 2 metresawayfromthe operator,the metre value onthe displaywill be
changedand the operatorwill be asked whateachthe value is.If the operatorgets a single value
wrongthenthe displayisnotclear enoughat2 metresandit will fail thisdesignrequirement.
Results – test 4
Twentydifferentmetre valueswere displayedonthe LCD; the operatorhad to saywhat eachone
was.The operatorhad noproblemviewingthe displayfrom2 metresawayandansweredcorrectly
for all values.
Discussion
Thisis a simplyyetimportanttesttoverifythe clarityof the display.The operatorhadnoproblems
withviewingthe display.The displaywas soclearthe operatorcouldstill clearlyreaditfrom4
metresaway.
Designrequirement5 – viewdisplayinall lightconditions
Thistestis similartothe last onlyitrequiresthe displaybe subjecttodifferentlevelsof light.The
suncan be verytroublesome toLCDdisplayswhenitshinesdirectly ontothem.Thisdisplaywill be
testedtoensure itisnot affectedbythe sun.
Method of testing
Subjectthe displaytodifferentlevelsof sunlightanddifferentanglesof sunlighttogeta complete
picture of its lightingcapabilities.The firsttestwill be tosubjectittodirectsunlightandhave the
operatorreadthe displayvalue,if the operatorcanreadthe displayvalue thiswill be satisfactory.
The displaywill be movedaroundatdifferentanglestofindaspotwhere itcannotbe seem.The last
testwill be inthe dark and the operatormustbe able toread the display.
Results test 5
LightingCondition View metre value?
Directsunlight Yes
Sunlightat45 degrees Yes
Morningsunlightdirect Yes
Middaysunlightdirect Yes
Low eveningsunlightdirect Yes
Eveningdusk Yes
Complete darkness yes
Table 5 – test 5 results
27. 23 | P a g e
Discussion
The testsshowthat the displaycouldbe viewedatdifferentlightlevels.Whilecarryingoutthe tests
the displaywasclearlyvisible inall lightingconditions.Thisisdue tothe technologyusedinthe
displaycalled“transflective”.Thismeansthatthe displayreflectsthe lightduringthe daywhenthe
sunis shiningandusesitsbuiltinbacklightwhenthe lightlevelsdrop. The resultisthatthe display
textispurple whenthe sunisshiningonitand blackwhenusesitsownbacklight.
Assessment
The distance counterdesignisa successandthiswas provedinthe evaluationsection,itsmain
highlightsare itsaccuracy,simple yeteffectiveinterface andeasytoreaddisplay.Yetithas
drawbacks, installationiscomplicated, the calibrationprocesscouldbe more automatedandthere
couldbe more functionalityinthe device.
Designpositives
The accuracy error wasalmost0% at the normal workingdistance anditwaslessthan2% at all other
distances.Thiswasthe mostimportantmeasurementforthe designandwentabove andbeyond
whatwas expected. The displaywasveryclearandeasyto readat distance andunderdifferent light
conditions. Thisisimportantbecause whenworkingmachinesinthe summerthe sunlightcanbe
verydisruptive toLCDdisplayswhendirectlyshiningonthem. The displayinthisdesignresolvesthis
withtransflectivetechnologythatcanreflectthe sunlightoff the textandmake itcompletelyvisible.
The prototype showshoweasythissystemistowork; countingstartsonce the machine ismoving
and the resetbuttoncan be pressedatany time to resetthe counterto zero. The countingmodes
offeranextra functiontoallowthe operatorcountonlywhenneeded.The start-stopcountingmode
can be controlledbyanyeventonthe machine withaswitchto signal the event.The prototype used
a switchon the spoutof the machine.Whenthe spoutisloweredthe machine isgoingtospreadturf
and counterstarts, whenthe spoutis raisedthe turf spreadingstopsandso doesthe counter.This
meansthe counteronlycountswhile spreadingturf.
Designnegatives
Thisdesignisverypositive butitdoeshave some drawbacks.The installationof the sensorcanbe a
difficultjobbecause the sensormustbe mountedinthe gearbox andthismeansmodificationtothe
gearbox.Inthe prototype machine ahole wasdrilledinthe side of the gearbox andthe sensorwas
fixedinthe hole. Installationof the sensoronlyneedstobe carriedout once and fromthat pointof
viewisnota bigproblem.
The calibrationprocess isa bitcumbersome,havingtoenterthe calibrationvaluewitha
potentiometer.Alsohavingtore-enterthe new calibration value shouldnotbe necessary. This
processshouldonlyinvolve measuringout100m thendrivingthe machine the 100m and lettingthe
microcontrollercalculatethe value needed.Thisisalso aone off job thoughand will notbe anissue
for operators.
The prototype showedthatthe designissimple,havingonlyone extrafunction.Thiscouldbe
improvedtoaddotherfunctionstomake it more versatile.Althoughthiswouldreallybe upto
individualusers,manyuserswouldpreferasimple systemthatiseasytouse and reliable.Designs
28. 24 | P a g e
withmore functionsandcomplexitytendtobe more difficulttouse fornew operatorsand less
reliable.
Next Steps
Thisprojectwouldbe useful tomanyturf cuttingcontractors especiallyinthe westof Irelandwhere
there are many more self-propelledturf cuttingmachines.There isfurtherworkneededonthe
designbefore itcouldbe installedinthesemachines.
1. Installationof proximitysensor
A mountingsystemisneededforthe proximitysensorto provide an easierinstallationprocess. A
mountingbracketwouldnotbe complicated todesign.The design andmanufacture of the bracket
couldbe carried out by an agricultural manufacturingcompanyorby a mechanical engineeroutside
of theirworkplace.
2. Installationformicrocontrolleranddisplay
The microcontrollerandLCD displayneed tobe housedinasmall tidyandruggedcase. The case
shouldhave mountingbracketssoitcan be installedinamachinescabwith fourscrews.The case
couldbe metal or Perspex.A designengineerwouldbe neededtomake the case.
3. Wiringand installation
The sensorwill be mountedinthe chassis – gearbox sectionof the machine andthe displaywillbe in
the cab. There will be cablingthatisneededbetweenthe two.The cable mustbe properlysizedand
thenproperlyroutedthroughthe machine toavoidgettingdamagedduringoperation.An
electricianwouldbe requiredtocarry out thiswork. The electriciancouldalsobe hiredtocarry out
the full installationif the bracketwasmade forthe sensorand the case wasmade to house the
displayandmicrocontroller.
The work outlinedabove shouldbe coordinatedbyacompanymanagerwho would contactthe
personsmentionedabove tocarryout the work outlined.Theycouldalsogettheiropinionsaseach
wouldbe expertsintheir ownfieldsandmighthave informationonhow toreduce the cost of
installation.
29. 25 | P a g e
Appendices
AppendixA – CircuitDiagram
The complete circuitdiagramisshownbelow.The sensorandswitchesare onthe left,the MCU isin
the middle andthe LCD is onthe right.
The complete circuitdiagramshowsthe circuitinfull,itwill be brokendownbelow andeachpart of
the circuitwill be explained.
NOTE: See circuitparts for accurate diagramof “Mode Select”switch.
NOTE: See circuitparts for accurate diagramof “SensorInput”circuit
30. 26 | P a g e
Circuitparts:
The followingwill showeachpartof the schematicon itsownand explainwhatitsfunctionisand
howit works.
Power:
The powercomesfrom a 12 voltbattery;the 5v regulatorisusedonthe inputsto the MCU. The
circle withindicate 12vand the triangle will indicate 5vas shownabove.
Sensor:
NOTE: This is the actualcircuit a third resistor is added forprotection.
The proximitysensorissymbolisedabove bythe relay.When ametal objectcomeswithinthe
proximitysensorsdetection range (4mm) the switchwill close. Thiswill shortthe twobottom
resistorsandconnectD2 to ground. Whenthe switchisopenthe three resistorscreate avoltage
31. 27 | P a g e
dividerdividing12vby 3. Thismeans4v will be droppedacrosseachresistor.The voltage atpinD2
will be 4v.
Two resistorscouldhave beenusedhere asexplainedinthe sensorsectioninthe reportbutthe
thirdresistorprotectsthe MCU. The proximitysensoractuallyhasanopencollectorNPN transistor
outputand the 10k pull downresistorisconnectedtothe collector.If 24v wasconnectedtothe
collectorthe bottomtworesistorswill splitthisvoltage intwoandreduce the riskof damagingthe
MCU by overvoltage.
Reset Push Button
The resetcircuitis usedto preventswitchbounce fromcallingmore thanone resetinterruptwhen
the buttonis pressed.The Schmitttriggerisusedtoadd hysteresistothe circuit.Hysteresismeans
there isa voltage gap betweenahighandlow outputfromthe Schmitttrigger.Asthe inputvoltage
increasesfrom0v to 5v the triggerpointwill be 3v.As the inputvoltage fallsfrom5vto 0v the
triggerwill be 2v.There is a 1v hysteresis gap;thispreventsthe outputjumpingbetweenhighand
low.If there wasa single crossoverpointatsay2.5v and the inputvoltage washoveringaroundthis
pointthe outputwouldbe constantlychangingbetweenhighandlow.
The Schmitttriggeris alsoan inverter, sointhe circuitabove whenthe switchisopenandthe
capacitor ischarged,the resistorispullingthe Schmitttriggerinputto5v andthe inverterwilloutput
0v to the pinD3. Whenthe PBis pressedthe Schmitttriggerwill be connectedto0v andthe output
will be 5v whichwill be seenonpinD3.This will triggerthe resetinterrupt.The switchwillbounce
on and off fora fewmillisecondsbutthe capacitorisdischargedwhenthe switchisonandcharges
whenitis off.Thiswill keepthe inputvoltage tothe Schmitttriggernearzerountil the switchstops
bouncing.The capacitorwill thencharge to 5v and the Schmitttriggerwill outputa0 to pinD3.
32. 28 | P a g e
Modeselectswitch
The mode selectswitchisa toggle switchwhichconnectsthe pinD10 to 5v or 0v throughthe pull
downresistor.
33. 29 | P a g e
Start – Stopswitch
The start – stop mode usesapush buttonstyle switchwhichwillbe heldclosedbyamechanical
mechanismandstayopenwhenthe mechanismmovesthe otherway.The Schmitttriggerisusedto
invertthe signal to the pinD11. A normallyclosedswitchcouldbe usedinsteadandmechanism
wouldopenthe switchtoincrementthe counter. The Schmitttriggerisneededbecause the counter
incrementswhenitsees5vonpinD11 and the switchoutputs0v when itis closed.Thiscouldbe
changedinsoftware butit ismore logical to doit thisway.
Calibrationpotentiometer
34. 30 | P a g e
The potentiometerhasanoutputvoltage between0– 5v. The MCU hasa 10 bitanalogue todigital
converter(ADC) thatconverts[0 – 5v] to [0 – 1023 value].The digital value isusedforthe calibration
value inthe program.The potentiometerisreadduringsetupandconverted toa digital value.A
commandin software called‘map’canmapthe range [0 – 1023] to any range withinthe range 0 –
1023. For example 0– 1023 is mappedto0 – 200 in the distance counter.
Microcontroller:
Belowisthe MCU, the pinsare not in the correct positionsrelativetothe ArduinoUno.The pin
numbersare listedtoallowthe circuitbe builtusinganArduinoUno.
The diagram above showsthe connection of the inputs(sensor,switches,etc) andLCD to the
ArduinoUnoand not the microcontroller itself.The pinsonthe ArduinoUnoare givenabove inside
the middle PDIPpackage.
35. 31 | P a g e
LiquidCrystalDisplay:
The potentiometerchangesthe contrastof the LCD displaybychangingthe inputvoltage from0 –
5v. The anode andcathode terminalsare forthe LED backlightwhichhasa current limitof 300mA. A
2W resistorisusedtolimit the currentto around200mA. The limitfromthe batteryand the resistor
isaround 380mA (I= V/R) butthe LED will dropsome voltage acrossit.This meansthere islessthan
5v droppedacross the resistorandthenthe current throughitwill be lower. Inthiscase itwas
testedtobe around 200mA.
36. 32 | P a g e
AppendixB – Theoretical SystemAccuracy
The systemaccuracy calculationsare shownabove.The importantpointtonote isthat the
percentage errorreducestozeroas the distance increases.Alsonote the distanceerrordoesnot
reduce as the distance increases.The distance errorreducesinrelationtothe distance andthusthe
percentage errorreduces.
37. 33 | P a g e
AppendixC – Software
The software flowdiagramisshownabove inthe implementationsection.The actual code follows
the flowdiagram closely;the software code isalsoverywell commentedanddoesagood jobof
explainingwhatishappening.Forthese reasonsthe code will be includedinthe folderthe report
documentwill be presentedin.