The document discusses the regulation and characteristics of water quality, detailing the importance of aquatic ecosystems and various indicators that help assess water quality. It categorizes physicochemical indicators, pollution sources, and water quality parameters, while also explaining standards and methodologies for measuring water quality. The document highlights the significance of maintaining healthy aquatic environments for both ecological and human benefits.


![28
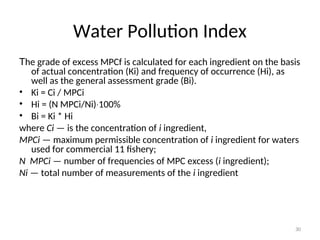
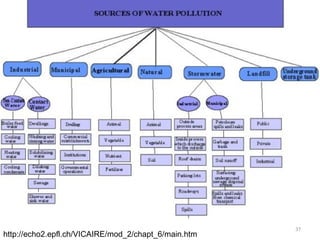
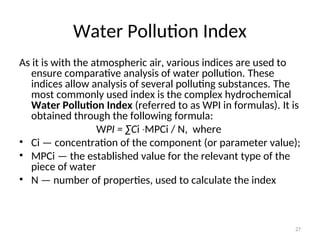
Water Pollution Index
• Normally, Water Pollution Indices are
calculated upon six or seven hydrochemical
properties, including content of dissolved
oxygen [O2], рН, biological consumption of
oxygen.](https://image.slidesharecdn.com/337419-240818065943-49584bc3/85/regulating-water-quality-28-320.jpg)