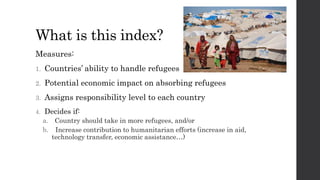
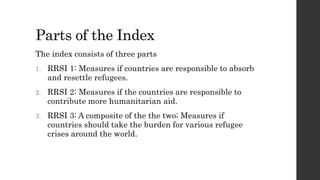
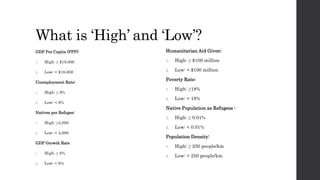
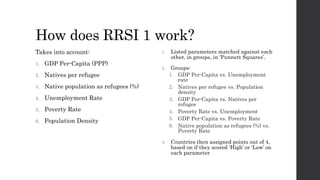
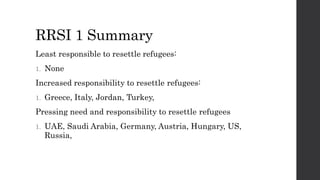
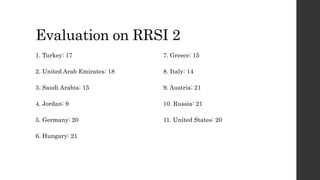
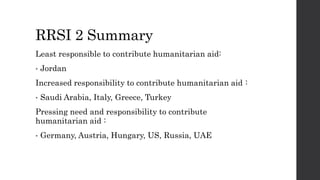
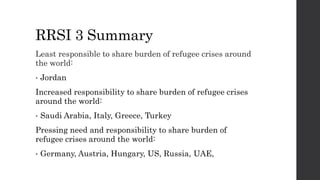
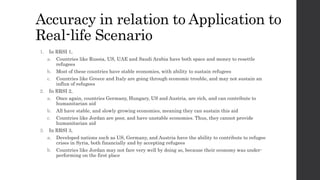
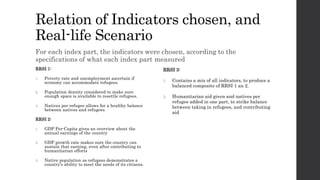
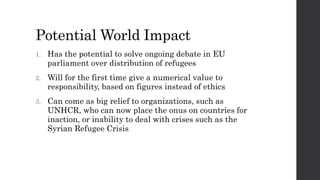
The Refugee
Responsibility
Sustainability Index
And its potential impact on our world
By Gurkaran Singh Goindi
Who is a refugee?
1. According to the 1951 refugee convention,
 A person, “…owing to well-founded fear of being persecuted for reasons of
race, religion, nationality, membership of a particular social group or
political opinion, is outside the country of his nationality and is unable or,
owing to such fear, is unwilling to avail himself of the protection of that
country; or who, not having a nationality and being outside the country of
his former habitual residence as a result of such events, is unable or, owing
to such fear, is unwilling to return to it”.
(Article 1A, 2)
2. A person who is subjected to some kind of persecution, within his country,
such as religious persecution, political persecution, and being a member of
a social group. This person thus needs a safe place to live, other than his
country of origin.
Why is this important?
1. There has been significant dispute over responsibility
over tackling refugee crises around the world.
2. As of now, there is no numerical way to measure
responsibility in tackling refugee crises around the
world.
3. Due to this, people on the ground suffer.
4. This project seeks to solve this problem.
What is this index?
Measures:
1. Countries’ ability to handle refugees
2. Potential economic impact on absorbing refugees
3. Assigns responsibility level to each country
4. Decides if:
a. Country should take in more refugees, and/or
b. Increase contribution to humanitarian efforts (increase in aid,
technology transfer, economic assistance…)
Parts of the Index
The index consists of three parts
1. RRSI 1: Measures if countries are responsible to absorb
and resettle refugees.
2. RRSI 2: Measures if the countries are responsible to
contribute more humanitarian aid.
3. RRSI 3: A composite of the the two; Measures if
countries should take the burden for various refugee
crises around the world.
What is ‘High’ and ‘Low’?
GDP Per Capita (PPP):
1. High: ≥ $18,000
2. Low: < $18,000
Unemployment Rate:
1. High: ≥ 9%
2. Low: < 9%
Natives per Refugee:
1. High: ≥4,000
2. Low: < 4,000
GDP Growth Rate
1. High: ≥ 6%
2. Low: < 6%
Humanitarian Aid Given:
1. High: ≥ $100 million
2. Low: < $100 million
Poverty Rate:
1. High: ≥18%
2. Low: < 18%
Native Population as Refugees :
1. High: ≥ 0.01%
2. Low: < 0.01%
Population Density:
1. High: ≥ 250 people/km
2. Low: < 250 people/km
How does RRSI 1 work?
Takes into account:
1. GDP Per-Capita (PPP)
2. Natives per refugee
3. Native population as refugees (%)
4. Unemployment Rate
5. Poverty Rate
6. Population Density
1. Listed parameters matched against each
other, in groups, in ‘Punnett Squares’.
2. Groups:
1. GDP Per-Capita vs. Unemployment
rate
2. Natives per refugee vs. Population
density
3. GDP Per-Capita vs. Natives per
refugee
4. Poverty Rate vs. Unemployment
5. GDP Per-Capita vs. Poverty Rate
6. Native population as refugees (%) vs.
Poverty Rate
3. Countries then assigned points out of 4,
based on if they scored ‘High’ or ‘Low’ on
each parameter
RRSI 1 Evaluation Template
Sample Evaluation of Turkey:
Group 1: 2
Group 2: 3
Group 3: 2
Group 4: 3
Group 5: 4
Group 6: 3
Total Score: 17
Index Scoring Scale: RRSI 1
Score highlights responsibility of country towards absorbing and
resettling refugees, within own territory.
1. 6-11: Decreased responsibility to resettle refugees/ non-
refoulement policy allowed
2. 12-17: Increased responsibility to resettle refugees, but no
obligation
3. 18-24: Pressing need and responsibility to resettle refugees/
non-refoulement policy not allowed
How does RRSI 2 work?
Takes into account:
1. GDP Per-Capita (PPP)
2. Humanitarian Aid Given
3. Native population as refugees (%)
4. Unemployment Rate
5. Poverty Rate
6. GDP Growth Rate
Punnett Square Groups:
1. GDP Per-Capita vs. Unemployment
rate
2. Humanitarian Aid Given vs. Native
population as refugees (%)
3. GDP Per-Capita vs. Humanitarian
Aid Given
4. Poverty Rate vs. Unemployment
Rate
5. GDP Per-Capita vs. Poverty Rate
6. GDP Growth Rate vs. Humanitarian
Aid given
RRSI 2 Evaluation Template
Sample Evaluation of Turkey:
Group 1: 2
Group 2: 3
Group 3: 3
Group 4: 3
Group 5: 4
Group 6: 2
Total Score: 17
Index Scoring Scale: RRSI 2
Score highlights responsibility of country towards recognizing,
and contributing towards humanitarian efforts.
1. 6-11: Decreased responsibility to recognize refugees, and
provide humanitarian aid
2. 12-17: Increased responsibility to contribute to
humanitarian efforts
3. 18-24: Pressing need and responsibility to contribute
significantly, to humanitarian efforts
How does RRSI 3 work?
Takes into account:
1. GDP Per-Capita (PPP)
2. Natives per Refugee
3. Native population as refugees (%)
4. Unemployment Rate
5. Poverty Rate
6. Humanitarian Aid Given
Punnett Square Groups:
1. GDP Per-Capita vs. Unemployment
rate
2. Natives per Refugee vs. Humanitarian
Aid Given
3. GDP Per-Capita vs. Humanitarian Aid
Given
4. Poverty Rate vs. Unemployment
5. GDP Per-Capita vs. Poverty Rate
6. Native population as refugees (%) vs.
Poverty Rate
RRSI 3 Evaluation Template
Sample Evaluation of Turkey:
Group 1: 2
Group 2: 1
Group 3: 3
Group 4: 3
Group 5: 4
Group 6: 4
Total Score: 17
Index Scoring Scale: RRSI 3
Score highlights responsibility of country towards recognizing,
and contributing towards humanitarian efforts.
1. 6-11: Decreased responsibility to share burden of refugee
crises around the world
2. 12-17: Increased responsibility to share burden of refugee
crises around the world
3. 18-24: Pressing need and responsibility to share burden of
refugee crises around the world
The Syrian Refugee Crisis 2015
Application to Real-life Scenario
Overview of the Syrian Refugee
Crisis
1. Started in 2011, with the start of the Syrian Civil War
2. Refugees initially fled to neighboring Turkey and Lebanon.
3. As the neighboring options became limited, Syrians started fleeing to
Europe, where conservative countries, such as Hungary, voiced their
opposition
4. In taking the dangerous voyage across the Mediterranean, nearly 4,000
Syrians have died.
5. As of November 2015, more than 4.2million Syrian refugees have fled the
country
6. European nations have since been sparring over who should take the most
refugees. While Germany and Austria have decided to take the most
number of refugees, the UK and Denmark have simply decided to opt out.
Countries to be evaluated by RRSI
These countries are directly related to the Syrian Refugee Crisis, and must
be evaluated:
1. Turkey
2. United Arab Emirates
3. Saudi Arabia
4. Jordan
5. Germany
6. Hungary
1. Greece
2. Italy
3. Austria
4. Russia
5. United States
Evaluation on RRSI 1
1. Turkey: 17
2. United Arab Emirates: 19
3. Saudi Arabia: 19
4. Jordan: 13
5. Germany: 20
6. Hungary: 21
7. Greece: 15
8. Italy: 13
9. Austria: 23
10. Russia: 24
11. United States: 24
RRSI 1 Summary
Least responsible to resettle refugees:
1. None
Increased responsibility to resettle refugees:
1. Greece, Italy, Jordan, Turkey,
Pressing need and responsibility to resettle refugees
1. UAE, Saudi Arabia, Germany, Austria, Hungary, US,
Russia,
Evaluation on RRSI 2
1. Turkey: 17
2. United Arab Emirates: 18
3. Saudi Arabia: 15
4. Jordan: 9
5. Germany: 20
6. Hungary: 21
7. Greece: 15
8. Italy: 14
9. Austria: 21
10. Russia: 21
11. United States: 20
RRSI 2 Summary
Least responsible to contribute humanitarian aid:
• Jordan
Increased responsibility to contribute humanitarian aid :
• Saudi Arabia, Italy, Greece, Turkey
Pressing need and responsibility to contribute
humanitarian aid :
• Germany, Austria, Hungary, US, Russia, UAE
Evaluation on RRSI 3
1. Turkey: 17
2. United Arab Emirates: 19
3. Saudi Arabia: 16
4. Jordan: 11
5. Germany: 20
6. Hungary: 24
7. Greece: 15
8. Italy: 15
9. Austria: 23
10. Russia: 23
11. United States: 20
RRSI 3 Summary
Least responsible to share burden of refugee crises around
the world:
• Jordan
Increased responsibility to share burden of refugee crises
around the world:
• Saudi Arabia, Italy, Greece, Turkey
Pressing need and responsibility to share burden of
refugee crises around the world:
• Germany, Austria, Hungary, US, Russia, UAE,
Accuracy in relation to Application to
Real-life Scenario
1. In RRSI 1,
a. Countries like Russia, US, UAE and Saudi Arabia have both space and money to resettle
refugees
b. Most of these countries have stable economies, with ability to sustain refugees
c. Countries like Greece and Italy are going through economic trouble, and may not sustain an
influx of refugees
2. In RRSI 2,
a. Once again, countries Germany, Hungary, US and Austria, are rich, and can contribute to
humanitarian aid
b. All have stable, and slowly growing economies, meaning they can sustain this aid
c. Countries like Jordan are poor, and have unstable economies. Thus, they cannot provide
humanitarian aid
3. In RRSI 3,
a. Developed nations such as US, Germany, and Austria have the ability to contribute to refugee
crises in Syria, both financially and by accepting refugees
b. Countries like Jordan may not fare very well by doing so, because their economy was under-
performing on the first place
Relation of Indicators chosen, and
Real-life Scenario
For each index part, the indicators were chosen, according to the
specifications of what each index part measured
RRSI 1:
1. Poverty rate and unemployment ascertain if
economy can accommodate refugees.
2. Population density considered to make sure
enough space is available to resettle refugees.
3. Natives per refugee allows for a healthy balance
between natives and refugees
RRSI 2:
1. GDP Per-Capita gives an overview about the
annual earnings of the country
2. GDP growth rate makes sure the country can
sustain that earning, even after contributing to
humanitarian efforts
3. Native population as refugees demonstrates a
country’s ability to meet the needs of its citizens.
RRSI 3:
1. Contains a mix of all indicators, to produce a
balanced composite of RRSI 1 an 2.
2. Humanitarian aid given and natives per
refugee added in one part, to strike balance
between taking in refugees, and contributing
aid
Potential World Impact
1. Has the potential to solve ongoing debate in EU
parliament over distribution of refugees
2. Will for the first time give a numerical value to
responsibility, based on figures instead of ethics
3. Can come as big relief to organizations, such as
UNHCR, who can now place the onus on countries for
inaction, or inability to deal with crises such as the
Syrian Refugee Crisis
Special Thanks to
1. Mr. A- For all the help that he provided, and
for being the guiding light behind the success
of this project
2. Mr. Michael- For briefing and debriefing
students about the Personal Project process
Citations
1. United States. Central Intelligence Agency. CIA
World Factbook. Washington DC: CIA, 2014. CIA
World Factbook. Web. 4 Dec. 2015.
https://www.cia.gov/library/publications/the-world-
factbook/rankorder/2004rank.html.
2. UNHCR Global Trends 2014. Rep. 1st ed. Vol. 1.
Geneva: UNHCR, 2015.
3. "GDP - per Capita (PPP)." Central Intelligence
Agency. Central Intelligence Agency, 2014. Web. 4
Dec. 2015.
4. Holger, Dieter. "29 Countries Accepting Refugees
From Syria And The Mideast." The Inquisitr
News. 6 Sept. 2015. Web. 4 Dec. 2015.
5. "Humanitarian Aid Provided." Country Profiles |.
Global Humanitarian Assitance, 2013. Web. 4 Dec.
2015.
6. The War in Syria Explained in 5 Minutes. The
Guardian, 18 Sept. 2015. Web. 4 Dec. 2015.
<https://www.youtube.com/watch?v=K5H5w3_QT
G0>.
1. "Population Density (people per Sq. Km of Land
Area)." World Bank. World Bank, 2014. Web. 4
Dec. 2015.
http://data.worldbank.org/indicator/EN.POP.DNST
.
2. "Population, Total." World Bank. World Bank,
2014. Web. 4 Dec. 2015.
http://data.worldbank.org/indicator/SP.POP.TOTL.
3. "Poverty." World Bank. World Bank, 2011. Web. 4
Dec. 2015.
4. "Refugee Population by Country or Territory of
Origin." Refugee Population by Country or
Territory of Origin. World Bank, 2014. Web. 4 Dec.
2015.
5. "World - Unemployment Rate - Country List -
Actual Data - Historical Charts." World -
Unemployment Rate - Country List - Actual Data -
Historical Charts. IEconomics, 1 Oct. 2015. Web. 4
Dec. 2015

Refugee Responsibility and Sustainability Index

  • 1.
    The Refugee Responsibility Sustainability Index Andits potential impact on our world By Gurkaran Singh Goindi
  • 2.
    Who is arefugee? 1. According to the 1951 refugee convention,  A person, “…owing to well-founded fear of being persecuted for reasons of race, religion, nationality, membership of a particular social group or political opinion, is outside the country of his nationality and is unable or, owing to such fear, is unwilling to avail himself of the protection of that country; or who, not having a nationality and being outside the country of his former habitual residence as a result of such events, is unable or, owing to such fear, is unwilling to return to it”. (Article 1A, 2) 2. A person who is subjected to some kind of persecution, within his country, such as religious persecution, political persecution, and being a member of a social group. This person thus needs a safe place to live, other than his country of origin.
  • 3.
    Why is thisimportant? 1. There has been significant dispute over responsibility over tackling refugee crises around the world. 2. As of now, there is no numerical way to measure responsibility in tackling refugee crises around the world. 3. Due to this, people on the ground suffer. 4. This project seeks to solve this problem.
  • 4.
    What is thisindex? Measures: 1. Countries’ ability to handle refugees 2. Potential economic impact on absorbing refugees 3. Assigns responsibility level to each country 4. Decides if: a. Country should take in more refugees, and/or b. Increase contribution to humanitarian efforts (increase in aid, technology transfer, economic assistance…)
  • 5.
    Parts of theIndex The index consists of three parts 1. RRSI 1: Measures if countries are responsible to absorb and resettle refugees. 2. RRSI 2: Measures if the countries are responsible to contribute more humanitarian aid. 3. RRSI 3: A composite of the the two; Measures if countries should take the burden for various refugee crises around the world.
  • 6.
    What is ‘High’and ‘Low’? GDP Per Capita (PPP): 1. High: ≥ $18,000 2. Low: < $18,000 Unemployment Rate: 1. High: ≥ 9% 2. Low: < 9% Natives per Refugee: 1. High: ≥4,000 2. Low: < 4,000 GDP Growth Rate 1. High: ≥ 6% 2. Low: < 6% Humanitarian Aid Given: 1. High: ≥ $100 million 2. Low: < $100 million Poverty Rate: 1. High: ≥18% 2. Low: < 18% Native Population as Refugees : 1. High: ≥ 0.01% 2. Low: < 0.01% Population Density: 1. High: ≥ 250 people/km 2. Low: < 250 people/km
  • 7.
    How does RRSI1 work? Takes into account: 1. GDP Per-Capita (PPP) 2. Natives per refugee 3. Native population as refugees (%) 4. Unemployment Rate 5. Poverty Rate 6. Population Density 1. Listed parameters matched against each other, in groups, in ‘Punnett Squares’. 2. Groups: 1. GDP Per-Capita vs. Unemployment rate 2. Natives per refugee vs. Population density 3. GDP Per-Capita vs. Natives per refugee 4. Poverty Rate vs. Unemployment 5. GDP Per-Capita vs. Poverty Rate 6. Native population as refugees (%) vs. Poverty Rate 3. Countries then assigned points out of 4, based on if they scored ‘High’ or ‘Low’ on each parameter
  • 8.
    RRSI 1 EvaluationTemplate Sample Evaluation of Turkey: Group 1: 2 Group 2: 3 Group 3: 2 Group 4: 3 Group 5: 4 Group 6: 3 Total Score: 17
  • 9.
    Index Scoring Scale:RRSI 1 Score highlights responsibility of country towards absorbing and resettling refugees, within own territory. 1. 6-11: Decreased responsibility to resettle refugees/ non- refoulement policy allowed 2. 12-17: Increased responsibility to resettle refugees, but no obligation 3. 18-24: Pressing need and responsibility to resettle refugees/ non-refoulement policy not allowed
  • 10.
    How does RRSI2 work? Takes into account: 1. GDP Per-Capita (PPP) 2. Humanitarian Aid Given 3. Native population as refugees (%) 4. Unemployment Rate 5. Poverty Rate 6. GDP Growth Rate Punnett Square Groups: 1. GDP Per-Capita vs. Unemployment rate 2. Humanitarian Aid Given vs. Native population as refugees (%) 3. GDP Per-Capita vs. Humanitarian Aid Given 4. Poverty Rate vs. Unemployment Rate 5. GDP Per-Capita vs. Poverty Rate 6. GDP Growth Rate vs. Humanitarian Aid given
  • 11.
    RRSI 2 EvaluationTemplate Sample Evaluation of Turkey: Group 1: 2 Group 2: 3 Group 3: 3 Group 4: 3 Group 5: 4 Group 6: 2 Total Score: 17
  • 12.
    Index Scoring Scale:RRSI 2 Score highlights responsibility of country towards recognizing, and contributing towards humanitarian efforts. 1. 6-11: Decreased responsibility to recognize refugees, and provide humanitarian aid 2. 12-17: Increased responsibility to contribute to humanitarian efforts 3. 18-24: Pressing need and responsibility to contribute significantly, to humanitarian efforts
  • 13.
    How does RRSI3 work? Takes into account: 1. GDP Per-Capita (PPP) 2. Natives per Refugee 3. Native population as refugees (%) 4. Unemployment Rate 5. Poverty Rate 6. Humanitarian Aid Given Punnett Square Groups: 1. GDP Per-Capita vs. Unemployment rate 2. Natives per Refugee vs. Humanitarian Aid Given 3. GDP Per-Capita vs. Humanitarian Aid Given 4. Poverty Rate vs. Unemployment 5. GDP Per-Capita vs. Poverty Rate 6. Native population as refugees (%) vs. Poverty Rate
  • 14.
    RRSI 3 EvaluationTemplate Sample Evaluation of Turkey: Group 1: 2 Group 2: 1 Group 3: 3 Group 4: 3 Group 5: 4 Group 6: 4 Total Score: 17
  • 15.
    Index Scoring Scale:RRSI 3 Score highlights responsibility of country towards recognizing, and contributing towards humanitarian efforts. 1. 6-11: Decreased responsibility to share burden of refugee crises around the world 2. 12-17: Increased responsibility to share burden of refugee crises around the world 3. 18-24: Pressing need and responsibility to share burden of refugee crises around the world
  • 16.
    The Syrian RefugeeCrisis 2015 Application to Real-life Scenario
  • 17.
    Overview of theSyrian Refugee Crisis 1. Started in 2011, with the start of the Syrian Civil War 2. Refugees initially fled to neighboring Turkey and Lebanon. 3. As the neighboring options became limited, Syrians started fleeing to Europe, where conservative countries, such as Hungary, voiced their opposition 4. In taking the dangerous voyage across the Mediterranean, nearly 4,000 Syrians have died. 5. As of November 2015, more than 4.2million Syrian refugees have fled the country 6. European nations have since been sparring over who should take the most refugees. While Germany and Austria have decided to take the most number of refugees, the UK and Denmark have simply decided to opt out.
  • 18.
    Countries to beevaluated by RRSI These countries are directly related to the Syrian Refugee Crisis, and must be evaluated: 1. Turkey 2. United Arab Emirates 3. Saudi Arabia 4. Jordan 5. Germany 6. Hungary 1. Greece 2. Italy 3. Austria 4. Russia 5. United States
  • 19.
    Evaluation on RRSI1 1. Turkey: 17 2. United Arab Emirates: 19 3. Saudi Arabia: 19 4. Jordan: 13 5. Germany: 20 6. Hungary: 21 7. Greece: 15 8. Italy: 13 9. Austria: 23 10. Russia: 24 11. United States: 24
  • 20.
    RRSI 1 Summary Leastresponsible to resettle refugees: 1. None Increased responsibility to resettle refugees: 1. Greece, Italy, Jordan, Turkey, Pressing need and responsibility to resettle refugees 1. UAE, Saudi Arabia, Germany, Austria, Hungary, US, Russia,
  • 21.
    Evaluation on RRSI2 1. Turkey: 17 2. United Arab Emirates: 18 3. Saudi Arabia: 15 4. Jordan: 9 5. Germany: 20 6. Hungary: 21 7. Greece: 15 8. Italy: 14 9. Austria: 21 10. Russia: 21 11. United States: 20
  • 22.
    RRSI 2 Summary Leastresponsible to contribute humanitarian aid: • Jordan Increased responsibility to contribute humanitarian aid : • Saudi Arabia, Italy, Greece, Turkey Pressing need and responsibility to contribute humanitarian aid : • Germany, Austria, Hungary, US, Russia, UAE
  • 23.
    Evaluation on RRSI3 1. Turkey: 17 2. United Arab Emirates: 19 3. Saudi Arabia: 16 4. Jordan: 11 5. Germany: 20 6. Hungary: 24 7. Greece: 15 8. Italy: 15 9. Austria: 23 10. Russia: 23 11. United States: 20
  • 24.
    RRSI 3 Summary Leastresponsible to share burden of refugee crises around the world: • Jordan Increased responsibility to share burden of refugee crises around the world: • Saudi Arabia, Italy, Greece, Turkey Pressing need and responsibility to share burden of refugee crises around the world: • Germany, Austria, Hungary, US, Russia, UAE,
  • 25.
    Accuracy in relationto Application to Real-life Scenario 1. In RRSI 1, a. Countries like Russia, US, UAE and Saudi Arabia have both space and money to resettle refugees b. Most of these countries have stable economies, with ability to sustain refugees c. Countries like Greece and Italy are going through economic trouble, and may not sustain an influx of refugees 2. In RRSI 2, a. Once again, countries Germany, Hungary, US and Austria, are rich, and can contribute to humanitarian aid b. All have stable, and slowly growing economies, meaning they can sustain this aid c. Countries like Jordan are poor, and have unstable economies. Thus, they cannot provide humanitarian aid 3. In RRSI 3, a. Developed nations such as US, Germany, and Austria have the ability to contribute to refugee crises in Syria, both financially and by accepting refugees b. Countries like Jordan may not fare very well by doing so, because their economy was under- performing on the first place
  • 26.
    Relation of Indicatorschosen, and Real-life Scenario For each index part, the indicators were chosen, according to the specifications of what each index part measured RRSI 1: 1. Poverty rate and unemployment ascertain if economy can accommodate refugees. 2. Population density considered to make sure enough space is available to resettle refugees. 3. Natives per refugee allows for a healthy balance between natives and refugees RRSI 2: 1. GDP Per-Capita gives an overview about the annual earnings of the country 2. GDP growth rate makes sure the country can sustain that earning, even after contributing to humanitarian efforts 3. Native population as refugees demonstrates a country’s ability to meet the needs of its citizens. RRSI 3: 1. Contains a mix of all indicators, to produce a balanced composite of RRSI 1 an 2. 2. Humanitarian aid given and natives per refugee added in one part, to strike balance between taking in refugees, and contributing aid
  • 27.
    Potential World Impact 1.Has the potential to solve ongoing debate in EU parliament over distribution of refugees 2. Will for the first time give a numerical value to responsibility, based on figures instead of ethics 3. Can come as big relief to organizations, such as UNHCR, who can now place the onus on countries for inaction, or inability to deal with crises such as the Syrian Refugee Crisis
  • 28.
    Special Thanks to 1.Mr. A- For all the help that he provided, and for being the guiding light behind the success of this project 2. Mr. Michael- For briefing and debriefing students about the Personal Project process
  • 29.
    Citations 1. United States.Central Intelligence Agency. CIA World Factbook. Washington DC: CIA, 2014. CIA World Factbook. Web. 4 Dec. 2015. https://www.cia.gov/library/publications/the-world- factbook/rankorder/2004rank.html. 2. UNHCR Global Trends 2014. Rep. 1st ed. Vol. 1. Geneva: UNHCR, 2015. 3. "GDP - per Capita (PPP)." Central Intelligence Agency. Central Intelligence Agency, 2014. Web. 4 Dec. 2015. 4. Holger, Dieter. "29 Countries Accepting Refugees From Syria And The Mideast." The Inquisitr News. 6 Sept. 2015. Web. 4 Dec. 2015. 5. "Humanitarian Aid Provided." Country Profiles |. Global Humanitarian Assitance, 2013. Web. 4 Dec. 2015. 6. The War in Syria Explained in 5 Minutes. The Guardian, 18 Sept. 2015. Web. 4 Dec. 2015. <https://www.youtube.com/watch?v=K5H5w3_QT G0>. 1. "Population Density (people per Sq. Km of Land Area)." World Bank. World Bank, 2014. Web. 4 Dec. 2015. http://data.worldbank.org/indicator/EN.POP.DNST . 2. "Population, Total." World Bank. World Bank, 2014. Web. 4 Dec. 2015. http://data.worldbank.org/indicator/SP.POP.TOTL. 3. "Poverty." World Bank. World Bank, 2011. Web. 4 Dec. 2015. 4. "Refugee Population by Country or Territory of Origin." Refugee Population by Country or Territory of Origin. World Bank, 2014. Web. 4 Dec. 2015. 5. "World - Unemployment Rate - Country List - Actual Data - Historical Charts." World - Unemployment Rate - Country List - Actual Data - Historical Charts. IEconomics, 1 Oct. 2015. Web. 4 Dec. 2015