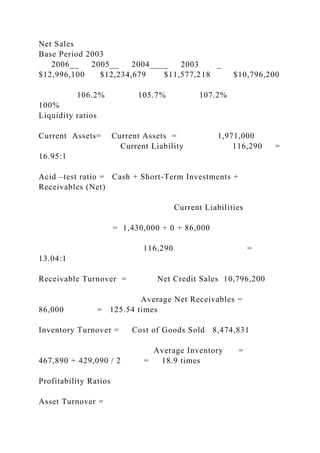
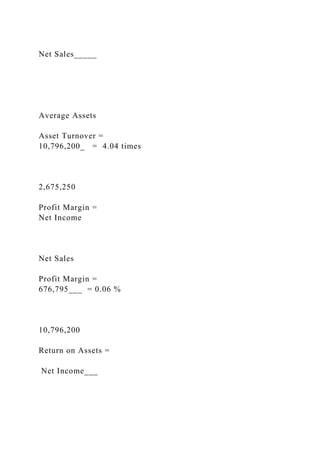
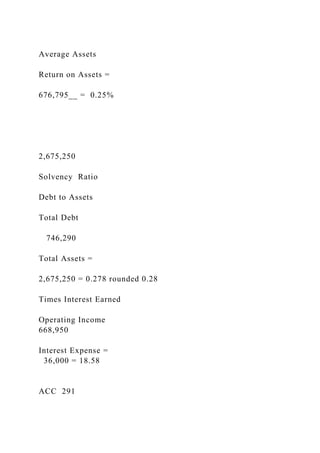
RATIO ANALYSIS MEMO
Ratio Analysis Memo –
ACC/291
University of Phoenix
To: Ms. Kathy Kudler, CEO
From: Accounting
Re: Company Ration Analysis
Kudler Fine Foods accounting department has completed a full analysis on the 2003 financial statistics. Different tools of analysis are used to help complete the analysis measurement. Below you will find exact calculations on liquidity ratios, profitability ratios, and solvency ratios. Financials from 2003 have helped us get an overall view of the company’s well being and with further years to come we will be better able to estimate a yearly return.
To measure the company’s short-term ability to pay its maturing obligations and to meet unexpected needs for cash, or liquidity ratio, several ratios are used. First is the current ratio rate. This measures the company’s liquidity and short-term debt-paying ability. Kudler’s current ratio is 16.95:1. This means the company has $16.95 of current asset for every dollar of current liability. This is great in comparison to the average industry’s ratio, which is 1:06:1. Kudler’s acid-test ratio, which measure immediate liquidity, is 13:04:1. The average industry’s is 0.29:1. The receivable turn-over rate is 125.54. In other words, Kudler Fine Foods collects 125 receivables during its given period. This rate is over four times the industry average of 28.2. After measuring the inventory turnover, Kudler Fine foods inventory is sold 18.9 times during its accounting period. With the average industry rate being 7.0, its obvious to see the company is doing well.
Profitability ratios measure the income or operating success of a company for a
given period of time. To help determine profitability ratios, Kudler’s accounting department measured the company’s assets turnovers, profit margins, return on assets, and return on common Stockholder’s Equity. To begin, all ratio rates in their given field are higher than the industry’s average ratio rate. The asset turnover shows Kudler generate $4.04 of sales for each dollar the company invested in assets. The percentage of each dollar of sales that resulted in net income, or profit margin amount, is 6.7%. A return of asset rate of 25.3% shows the overall measure of profitability. This was determined by measured dividing net income by average assets. This rate is more than three times the industry’s average rate. The return on common Stockholder’s Equity has a high rate of 0.90%. This means the company earns $90 for each dollar invested by the owner.
Solvency ratios, which measure the ability of a company to survive over a long period of time, that were used are debt to assets ratios and times interest earned rations. The debt to assets ratios shows the Kudler’s creditors contribute 28% of total assets to the company. This low rate shows Kudler Fine Food contributes much of its success to the business assets. The times interest earned ratio, which measure the company’s ability to meet interest payments as t ...
RATIO ANALYSIS MEMORatio Analysis Memo – ACC291Univer.docx
1. RATIO ANALYSIS MEMO
Ratio Analysis Memo –
ACC/291
University of Phoenix
To: Ms. Kathy Kudler, CEO
From: Accounting
Re: Company Ration Analysis
Kudler Fine Foods accounting department has completed a full
analysis on the 2003 financial statistics. Different tools of
analysis are used to help complete the analysis measurement.
Below you will find exact calculations on liquidity ratios,
profitability ratios, and solvency ratios. Financials from 2003
have helped us get an overall view of the company’s well being
and with further years to come we will be better able to estimate
a yearly return.
To measure the company’s short-term ability to pay its maturing
obligations and to meet unexpected needs for cash, or liquidity
ratio, several ratios are used. First is the current ratio rate. This
measures the company’s liquidity and short-term debt-paying
ability. Kudler’s current ratio is 16.95:1. This means the
company has $16.95 of current asset for every dollar of current
liability. This is great in comparison to the average industry’s
ratio, which is 1:06:1. Kudler’s acid-test ratio, which measure
immediate liquidity, is 13:04:1. The average industry’s is
2. 0.29:1. The receivable turn-over rate is 125.54. In other words,
Kudler Fine Foods collects 125 receivables during its given
period. This rate is over four times the industry average of 28.2.
After measuring the inventory turnover, Kudler Fine foods
inventory is sold 18.9 times during its accounting period. With
the average industry rate being 7.0, its obvious to see the
company is doing well.
Profitability ratios measure the income or operating success of a
company for a
given period of time. To help determine profitability ratios,
Kudler’s accounting department measured the company’s assets
turnovers, profit margins, return on assets, and return on
common Stockholder’s Equity. To begin, all ratio rates in their
given field are higher than the industry’s average ratio rate. The
asset turnover shows Kudler generate $4.04 of sales for each
dollar the company invested in assets. The percentage of each
dollar of sales that resulted in net income, or profit margin
amount, is 6.7%. A return of asset rate of 25.3% shows the
overall measure of profitability. This was determined by
measured dividing net income by average assets. This rate is
more than three times the industry’s average rate. The return on
common Stockholder’s Equity has a high rate of 0.90%. This
means the company earns $90 for each dollar invested by the
owner.
Solvency ratios, which measure the ability of a company to
survive over a long period of time, that were used are debt to
assets ratios and times interest earned rations. The debt to
assets ratios shows the Kudler’s creditors contribute 28% of
total assets to the company. This low rate shows Kudler Fine
Food contributes much of its success to the business assets. The
times interest earned ratio, which measure the company’s
3. ability to meet interest payments as they come due, is 18.58
times. .This means the company can cover meet interest
payments as many as 18 times in the accounting period. The
number is well above the average of 10.7 times.
The overall ratios prove Kudler Fine Foods is well above
average in all areas of business, therefore, making the company
have a great success rate.
Creditors are often particularly interested in liquidity ratios
because they show the ability of a business to quickly generate
needed cash to pay bills. For example, if Kudler Fine Foods
were applying for a loan then the bank would examine the
liquidity ratios when they are evaluating the loan application.
Someone who is thinking about investing or already invested in
Kudler Fine Foods would be interested in the solvency ratios.
These ratios indicate the amount of debt a company can handle.
They also indicate the amount of investment one has in Kudler.
Profitability ratios are interesting to different stakeholders of
Kudler Fine Foods for different purposes. The different
stakeholders of Kudler Fine Foods include owners,
management, creditors and lenders.
The short and long term positions of Kudler Fine Foods are as
follows; that for the short term it can cover its debts in the
present and near future. In the case of long term obligations it
has enough stability to hold off for awhile. The short as well as
the long term positions of Kudler Fine Foods is dependent on
the present and future performance of overall profitability. The
present profitability or performance of the company is below
par for industry standards and almost non-existent. Kudler Fine
Foods needs to find a way to raise its profitability ratios in
order not only to gain a profit, but to hopefully keep the
company from going under.
4. In conclusion, Kudler Fine Foods is able to pay off its short
term obligations as its current asset ratio is 16.95:1. Also, for
each dollar invested the company earns $90. When it comes to
the overall success of the company in the long run, Kudler Fine
Foods is able to make its interest payments as they come in at
an amazing 18.58 times a year. Last with profitability ratios,
Kudler Fine Foods needs to look at raising its ratios to keep the
company up.
Vertical Analysis
Kudler Fine Foods
Balance Sheet (Partial)
December 31, 2003
2004 2003__
AmountPercentAmountPercent
$10,804,0
Current assets $
3,717 23.8 $ 3,427 22.6
Property assets (net)
3,990 26.2 3,816 26.3
Other assets
6,690 50.06,47151.1
Total assets
$14,397 100.0 $13,714 100.
Horizontal Analysis
Kudler Fine Foods
5. Net Sales
Base Period 2003
2006__ 2005__ 2004____ 2003 _
$12,996,100 $12,234,679 $11,577,218 $10,796,200
106.2% 105.7% 107.2%
100%
Liquidity ratios
Current Assets= Current Assets = 1,971,000
Current Liability 116,290 =
16.95:1
Acid –test ratio = Cash + Short-Term Investments +
Receivables (Net)
Current Liabilities
= 1,430,000 + 0 + 86,000
116,290 =
13.04:1
Receivable Turnover = Net Credit Sales 10,796,200
Average Net Receivables =
86,000 = 125.54 times
Inventory Turnover = Cost of Goods Sold 8,474,831
Average Inventory =
467,890 + 429,090 / 2 = 18.9 times
Profitability Ratios
Asset Turnover =
6. Net Sales_____
Average Assets
Asset Turnover =
10,796,200_ = 4.04 times
2,675,250
Profit Margin =
Net Income
Net Sales
Profit Margin =
676,795___ = 0.06 %
10,796,200
Return on Assets =
Net Income___
7. Average Assets
Return on Assets =
676,795__ = 0.25%
2,675,250
Solvency Ratio
Debt to Assets
Total Debt
746,290
Total Assets =
2,675,250 = 0.278 rounded 0.28
Times Interest Earned
Operating Income
668,950
Interest Expense =
36,000 = 18.58
ACC 291
8. Strategic Organizational Communication Paper
The paper for COM 3120 should be 3-5 pages long. Below in
the
instructions, you will find that the paper is divided into three
parts. You will
be graded on the content of your answer, the
reasoning/argument you make
between the theory and the facts of the case study as well as
writing
(grammar and punctuation). The relative lengths of the three
parts should be
as follows:
• Part One:
• Part Two:
• Part Three:
1 page minimum 2 pages minimum 1 page minimum
_____________________________________________________
___
INSTRUCTIONS:
Part One: Description of the Organization
Choose an organization that you want to research and discuss.
Describe the
organization giving relevant background information. Make sure
9. that you
identify the organization’s mission. This is most often found in
a mission
statement.
Part Two: Strategic Communication in the Organization
Choose at least 4 but no more than 6 of the following aspects of
strategic
organizational communication to discuss:
• Public relations
• Managing an organization's image or reputation
• Internal communications
• Public affairs and issues management
• Media relations
• Risk and crisis communication
• Marketing
• Integrated marketing communications
• The marketing mix
• Advertising
• Branding
• Relationship marketing and the use of marketing data bases
10. • Technology and strategic organizational communication �
Part Three: Assessment and Recommendations
As a conclusion to your research on the strategic
communication of the
organization you chose, make an evaluation of how effective
you believe this
organization uses strategic communication. Is the strategic
communication
very effective, somewhat effective, not effective, dysfunctional
and/or
destructive, etc. Justify your assessment.
Make recommendations for how the organization could improve
its strategic
communication (even if your assessment was that the
organization used
strategic communication effectively).
_____________________________________________________
____
Formatting Guidelines
• 12 point type size
• Double line spacing
• 1-inch margins
• Indentations at beginnings of paragraphs, with no space
11. between
paragraphs
�Documentation Guidelines:
�If you incorporate sources into your paper, use standard APA
style. Make
sure that you have both in-text citations and a references or
works cited list at
the end of the paper.