Download to read offline
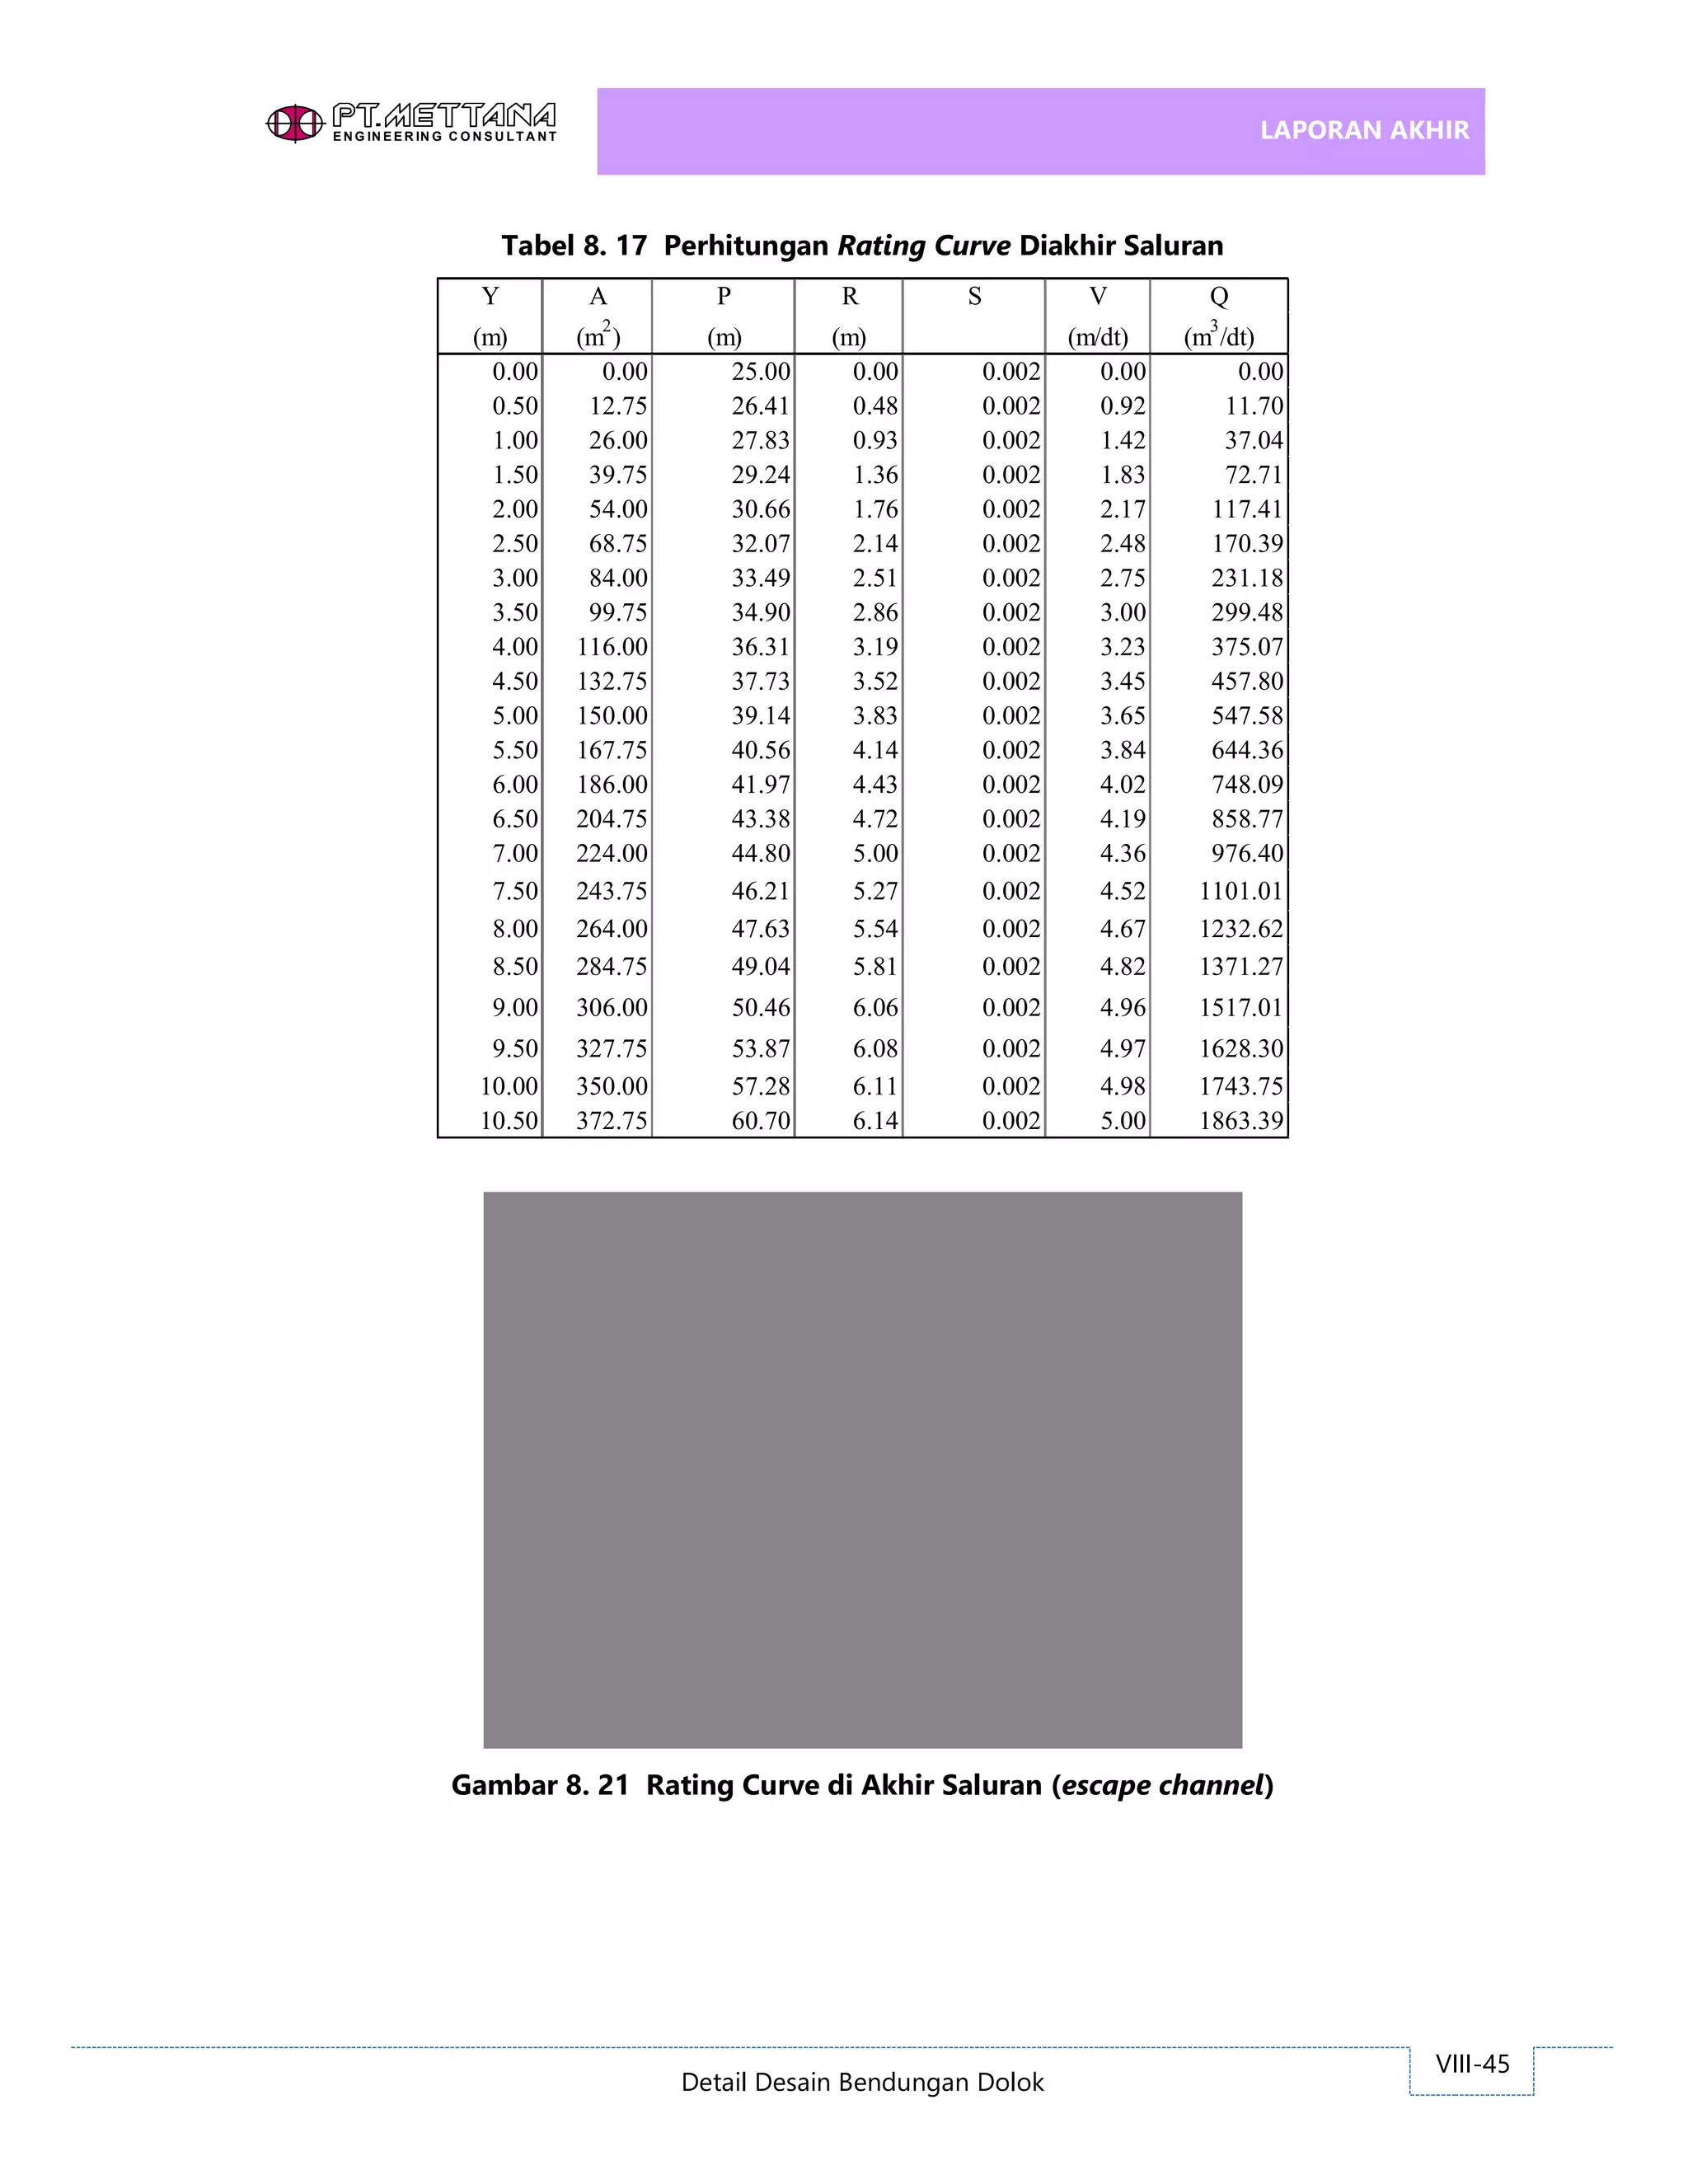

The document contains a table showing calculations of rating curve parameters at the end of a spillway channel, including depth of water (Y), cross-sectional area (A), hydraulic radius (R), width of water surface (V), discharge (Q), and flow rate (S) at increments of water depth from 0 to 10.5 meters. It also includes a graph titled "Rating Curve at the End of the Channel" plotting discharge against depth with a discharge ranging from 0 to nearly 2,000 cubic meters per day.


