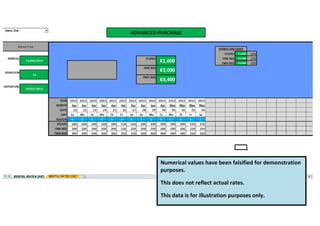
Numerical values in a demonstration were falsified and do not reflect actual rates. The data presented was solely for illustrative purposes and should not be interpreted as real values.