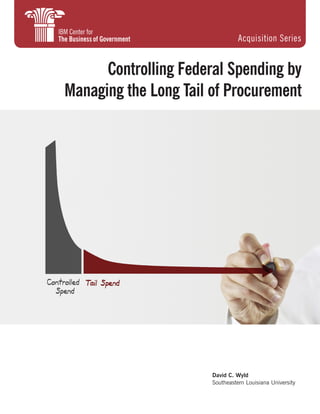
Controlling Federal Spending by Managing the Long Tail of Procurement
•
3 likes•2,937 views

A white paper published by the IBM Center fo The Business Government, Acquisition Series, July 2013.

Recommended
Recommended
More Related Content
Similar to Controlling Federal Spending by Managing the Long Tail of Procurement
Similar to Controlling Federal Spending by Managing the Long Tail of Procurement (20)
Recently uploaded
Recently uploaded (20)
Controlling Federal Spending by Managing the Long Tail of Procurement
- 1. David C. Wyld Southeastern Louisiana University Controlling Federal Spending by Managing the Long Tail of Procurement Acquisition Series
- 2. David C. Wyld Laborde Professor of Management College of Business Southeastern Louisiana University Acquisition Series 2013 Controlling Federal Spending by Managing the Long Tail of Procurement
- 4. 3 Controlling Federal Spending by Managing the Long Tail of Procurement www.businessofgovernment.org Table of Contents Foreword. . . . . . . . . . . . . . . . . . . . . . . . . . . . . . . . . . . . . . . . . . . . . . . . . . . . . . . . . . . 4 Introduction. . . . . . . . . . . . . . . . . . . . . . . . . . . . . . . . . . . . . . . . . . . . . . . . . . . . . . . . . 6 Overview. . . . . . . . . . . . . . . . . . . . . . . . . . . . . . . . . . . . . . . . . . . . . . . . . . . . . . . . 6 The Concept of Tail Spend. . . . . . . . . . . . . . . . . . . . . . . . . . . . . . . . . . . . . . . . . . . . 7 The Difference between Core and Tail Spend. . . . . . . . . . . . . . . . . . . . . . . . . . . . . . . 7 Types of Tail Spend. . . . . . . . . . . . . . . . . . . . . . . . . . . . . . . . . . . . . . . . . . . . . . . . . 9 Challenges Involved in Managing Tail Spend. . . . . . . . . . . . . . . . . . . . . . . . . . . . . . 11 Theoretical Roots of the Tail Spend Management Concept . . . . . . . . . . . . . . . . . . . . 13 Analysis of the Long Tail of Federal Acquisition Spending . . . . . . . . . . . . . . . . . . . . . . . 16 Overview. . . . . . . . . . . . . . . . . . . . . . . . . . . . . . . . . . . . . . . . . . . . . . . . . . . . . . . 16 Federal Aggregate and Agency Spending Analysis . . . . . . . . . . . . . . . . . . . . . . . . . . 16 Analysis of Tail Spend Data. . . . . . . . . . . . . . . . . . . . . . . . . . . . . . . . . . . . . . . . . . 24 Recommendations: Seven Approaches to Managing Tail Spend . . . . . . . . . . . . . . . . . . . 26 Overview. . . . . . . . . . . . . . . . . . . . . . . . . . . . . . . . . . . . . . . . . . . . . . . . . . . . . . . 26 A Model for Addressing Tail Spend Management. . . . . . . . . . . . . . . . . . . . . . . . . . . 26 Seven Ways to Improve Tail Spend Management. . . . . . . . . . . . . . . . . . . . . . . . . . . 29 Discussion of Managing Tail Spend. . . . . . . . . . . . . . . . . . . . . . . . . . . . . . . . . . . . . 32 References. . . . . . . . . . . . . . . . . . . . . . . . . . . . . . . . . . . . . . . . . . . . . . . . . . . . . . . . . 33 About the Author. . . . . . . . . . . . . . . . . . . . . . . . . . . . . . . . . . . . . . . . . . . . . . . . . . . . 36 Key Contact Information. . . . . . . . . . . . . . . . . . . . . . . . . . . . . . . . . . . . . . . . . . . . . . . 37 Appendixes (Available online on IBM Center for The Business of Government website: www.businessofgovernment.org) Appendix I: A Primer on the 80/20 Rule Appendix II: Methods and Data Appendix III: Projecting Potential Tail Spend Savings at the Aggregate and Agency Levels for the Federal Government Appendix IV: Spend Analysis Focus: Federal Aggregate and Agency Spending by Timing
- 5. 4 Controlling Federal Spending by Managing the Long Tail of Procurement IBM Center for The Business of Government On behalf of the IBM Center for The Business of Government, we are pleased to present this report, Controlling Federal Spending by Managing the Long Tail of Procurement, by David C. Wyld, Laborde Professor of Management, College of Business, Southwestern Louisiana University. In this report, Professor Wyld provides the first quantitative anal- ysis of tail spend in the federal government. The initial section introduces the concept of tail spend to government executives. In short, tail spend is procurement outlays that are outside of an organization’s core spending and core supplier groups, cov- ering many miscellaneous expenditure categories that are not managed as part of an organization’s core operations. This report’s publication is timely, as the federal government continues to seek innovative ways to reduce costs in an era of sequestration and tight budgets. Professor Wyld argues that more aggressively managing the tail of government spending— smaller, non-core expenditures that tend to receive less atten- tion—offers the possibility of substantial cost savings. Based on his analysis of government-reported spending in the Federal Procurement Data System (FPDS), Professor Wyld reports that it is possible for the federal government to save between $113 billion and $226 billion by more aggressive management of tail spend. In the Department of Defense, potential savings range from $64 billion to $128 billion. In addition to his path-breaking analysis of tail spend in govern- ment, Professor Wyld sets forth a model that can used in manag- ing tail spend. Specifically, he recommends increased tail spend awareness followed by spend analysis, spend sorting and clarify- ing, and spend implementation. In addition, the report describes seven specific ways to improve tail spend managing, including identifying maverick, fragmented, and misclassified spending. Timothy Wood Foreword Daniel J. Chenok
- 6. 5 Controlling Federal Spending by Managing the Long Tail of Procurement www.businessofgovernment.org This report continues the IBM Center’s interest in cost savings. Our report, Strategies to Cut Costs and Improve Performance, argues that the federal government can reduce spending by adopting commercial best practices in government. Managing the long tail of procurement is clearly one best practice that can now be adopted by government. We hope that this timely report will be useful to government executives, both those inside and outside the world of govern- ment procurement, as they seek to find new ways to reduce government spending. We also hope that the report will be use- ful and timely to state and local government executives as well. Timothy Wood Vice President & Partner Public Sector Operations & Supply Chain Management Practice Area Leader IBM Global Business Services tim.wood @ us.ibm.com Daniel J. Chenok Executive Director IBM Center for The Business of Government chenokd @ us.ibm.com
- 7. 6 Controlling Federal Spending by Managing the Long Tail of Procurement IBM Center for The Business of Government Overview The framing of an issue often dictates what follows. When it comes to extracting purchasing savings, most procurement executives, in either the private or public sectors, look at the obvi- ous targets—their biggest areas of spend and their spend with their biggest suppliers. Pathak and Menon (2008) observed: “Traditionally, companies have looked to strategically address the top 80%–90% of spending, while paying little attention to the remaining 10%–20%, which was uncategorized, unstructured, and decentralized.” With today’s renewed emphasis on strategic sourcing in the private and public sectors alike, the best way to leverage an organization’s purchasing power may be to bring a new focus on procurements made at the edge of the supply chain, both in terms of what is being bought and with whom the transactions are made. This is the promise of what has become known as tail spend management, and today, it is clear that for organizations of all sizes and types, tackling the challenge of the long tail of their spending is one of the best ways to reduce costs and streamline operations. From the bluest of blue-chip companies in the Fortune 500 and Global 1000, right down to small and growing businesses, procurement executives across the private sector are increasingly looking to tail spend management as an opportunity to have a direct impact on the financial and operational health of their companies. There are now best practices in tail spend manage- ment that have been developed in the for-profit world and these now can—and need to be— transferred to the realm of government acquisition. And for government today, tail spend holds perhaps even more significant prospects to deliver savings, efficiency, and compliance than in the private sector. The goal of this report is to introduce government acquisition executives and professionals to the concept of tail spend management and demonstrate the potential savings that can be achieved through the application of tail spend management in the public sector. The report begins with a look at tail spend management. This will answer questions about managing the long tail of spending, including: • What is meant by the concept of tail spend? • What is the difference between core and tail spend? • What are the types of tail spend? • What are the challenges involved in managing tail spend? • What are the theoretical roots of the tail spend management concept? In the second part of the report, the results of the first attempt at sizing tail spend in the fed- eral government are presented. Using data from the Federal Procurement Data System (FPDS), the first sizing of tail spend, both for the federal government as a whole and for all Cabinet-level agencies, is generated. Introduction
- 8. 7 Controlling Federal Spending by Managing the Long Tail of Procurement www.businessofgovernment.org The concluding section of the report presents a model for addressing tail spend management and seven ways to better manage the long tail of acquisition spending in public-sector agen- cies of all types. The Concept of Tail Spend So what exactly is tail spend? A variety of definitions have been put forth regarding the tail spend concept, and while there is much overlap, some of the semantic differences can cause procurement executives to take an unnecessarily limited view of what tail spend encompasses. For example, Raja and Bardell (2011) postulated that tail spend can be characterized as sim- ply unaddressed spend, meaning “spend on commodities and categories that have not been formally addressed by procurement in the last two to three years.” Likewise, in a recent report from Accenture (2013), tail spend was even more narrowly defined as “one-off purchases, typically below $500,000.” The broad definition of tail spend that this author prefers is a simple one, in that tail spend can be defined as: … Procurement outlays that are outside of the organization’s “spend under manage- ment,” encompassing acquisitions made either—or both—outside of the core supplier group for the organization and for goods and services beyond the norm. The Difference between Core and Tail Spend The 80/20 rule—the well-known management rule of thumb which holds that in many cases and situations, 80% of the outcomes can be attributed to 20% of causes—is fundamental to the tail spend concept. A primer on the 80/20 rule is provided in Appendix I. It is important to make clear upfront that the 80/20 breakdown is an approximation, not a hard-and-fast magic ratio. The precise percentage will vary not just across industries, but across firms within them What Constitutes Tail Spend? What are the characteristics of the items and services that fall into the tail of an organization’s spend? There are no exact categorization criteria to say “this is tail spend” and “this is not tail spend,” but some general characteristics include the following: • Tail spend covers a large number of categories of goods and services, rarely including direct materials. • Most categories of tail spend will be low-value items (both goods and services). However, some items that fall into the tail spend area will have surprisingly high transaction volumes. • Tail spend items are procured in a wide variety of ways, outside of normal procurement modus operandi, as non-compliance and maverick spend are rampant in this area. • Items that were formerly in the managed core of organizational spending can fall into tail spend if they are contracted items that are simply renewed without reviewing/renegotiating the contract to ensure market rates are being paid for the items. • Items that are highly technical in nature may be so sophisticated that the procurement of these articles is handled by experts in the field, rather than by acquisition staffers. • In a global organization, analysis will show that a disproportionate level of tail spend comes from procurements made by the most remote outposts of the organization. • Due to their relative standing in the organization’s supply base, tail spend is largely carried out with suppliers that are not on the radar of the unit’s main procurement operations.
- 9. 8 Controlling Federal Spending by Managing the Long Tail of Procurement IBM Center for The Business of Government as well. The true core/tail ratio may be 79/21, 81/19, 84.6/15.4, or any other combination. In fact, Ramachandran and Lawless (2003) postulated that the size of the tail could range up to 30% or more of spend in some cases. For simplicity’s sake though, the 80/20 approximation is used in this discussion of the concept of core-versus-tail spending for organizations. The 80/20 rule holds true in the area of corporate procurement. With most firms, 80% of the total spend on goods, services, and materials takes place with just 20% of their total number of suppliers. Conversely, there is a long tail in that the remaining 20% of spend is spread out among a large number of suppliers, typically amounting to 80% of the total number of suppli- ers the firm has. Likewise, most companies find that typically, 80% of their expenditures are concentrated in just 20% of their total number of categories of supplies and services. This “big head”—the core spending for the corporation—typically includes direct spending on raw mate- rials and vital components, as well as indirect spend for most consumables, including things like MRO (maintenance, repair, and operating) and PPE (personal protective equipment) supply purchases. Yet, when the amount of money involved with tail spend is aggregated, the tail, in aggregate, may indeed be more than most, if not all, of the organization’s core suppliers. Over the past decade or more, the predominant attitude in the area of procurement and sup- ply chain management has been to concentrate on the 20%—the core of the supply base. It is with the firm’s largest suppliers that we see strategic efforts made at integration—both operationally and technically. Also, when firms look to shave their materials, supplies, and ser- vices costs, the targets are most often the suppliers in this core group. And yes, spend man- agement efforts will produce the most return in dollars—the most “bang for the buck”—with the firm’s largest suppliers—the 20%—the “vital few.” However, years of focus on spend man- agement and cost-cutting has meant that many large companies have literally squeezed out most of the savings to be gained from such efforts with their core suppliers. This had led to the newfound attention on tail spend management. The Challenge—and Opportunity—of Tail Spend Management What percentage of procurement spending is truly being “managed?” In any organization, we would like to state that unequivocally, 100% of acquisition outlays are absolutely under con- trol. Yet, in practice, that is far from the case. Most metrics that are used in assessing procurement performance are internally focused, deal- ing with spending, savings, and process measures. And today, the gold standard for measuring procurement’s value and importance in an organization is spend under management, which was defined by Bartolini (2012) as: “the percentage of total enterprise spend (which is com- prised of all direct and indirect, including capital services spend) that a procurement organiza- tion manages or influences.” Additionally, according to a recent study from CPO Agenda, companies today have an average of just 60.6% of their procurement outlays “under manage- ment.” Thus, there is great potential for procurement executives to demonstrate their value to the organization by contributing to the bottom line through increasing their spend under man- agement, as according to Bartolini (2012), “For every dollar/pound/euro that is placed under management of the procurement department, the average enterprise sees a benefit of between 6% and 12%.” Whether in the private or public sectors, procurement executives face the daunting task of “doing more without more,” namely without the resources—more personnel and more budget— that would enable them to directly increase their spend under management. With limited inter- nal resources, acquisition units, often stretched to the breaking point, most often find that it is far easier to make gains in dealing with the company’s core spending and its key, strategic sup- ply partners. Yet, when it comes to tail spend, the opportunities for savings and efficiencies are
- 10. 9 Controlling Federal Spending by Managing the Long Tail of Procurement www.businessofgovernment.org often “hiding in plain sight” (Gens, 2006). As Loughlin (2012) pointed out, “Ignoring tail spend is potentially leaving huge amounts of money on the table ... (as) the significant benefits available from managing tail spend could be a new and as-yet untapped source of savings.” The relatively low value of tail spend versus core spending means that the ROI of individual efforts to improve tail spend management will always be lower than that of initiatives in core categories (GEP, 2011). However, with a coordinated and dedicated effort to improve tail spend management, broad initiatives may produce savings and efficiency gains far greater than efforts to streamline core spending will. Tail spend thus encompasses the point past which spend is being effectively “managed.” As Raja and Bardell (2011) put it: “World-class organizations today have a good level of control over most of their cost structure. As this visibility and control increases, eventually a point is reached when the effort required to go further appears to be greater than the benefits.” According to Flanagan (2012), “in the world of tail end spend, it is not unreasonable to see savings on historical spend of up to 40%–50%.” And, as this analyst went on to note, exam- ining tail spend for any organization has the potential to find new savings and efficiencies, as “it’s relatively virgin territory—something which can’t always be said of strategic spend.” Types of Tail Spend There are seven general categories into which tail-spend outlay can be classified. These are listed and defined in Figure 1. Please note that the typology is not mutually exclusive. Indeed, different acquisition executives and third-party consultants may view some spending differently than others do, and some specific procurements of goods and/or services may indeed fall into multiple categories. However, the critical factor is that the spend is focused upon, rather than being looked upon as the great unknown—or unknowable—in an organization’s overall pro- curement picture. The Linkage between Tail Spend Management and Strategic Sourcing in Government In the public sector, there has been a push, paralleling the trend in the private sector, to focus on the core of spending, rather than the tail. Across the board, government acquisition leaders have sought to better manage their largest areas of spending—in areas ranging from information technology and communications to MRO and PPE. In doing so, they have found that even with the budgetary pressures that have left public procurement leaders leaving no stone unturned in the quest for savings, they have run into the same diminishing returns that for-profit companies have encountered. Simply put, there is a point past which the search for savings in core spend with their largest suppliers are either simply not there or if so, are counterproductive in promot- ing the long-term cooperation and savings integral to strategic sourcing. At the federal level, the focus on core suppliers and spending is certainly evident, as there has recently been a renewed emphasis on strategic sourcing (See the box, Strategic Sourcing in the Federal Government, on page 11). And so, across the public sector, there has been an overemphasis on the “core” of spending and a general lack of focus on the importance of tail spend. While untested in the public sec- tor due to the paucity of attention to tail spend and the absence of research in this area to present, the costs of tail spend are likely analogous—or even greater—for governmental agen- cies. Drawing from a white paper on the benefits of greater awareness and emphasis on tail spend management in local governments in the United Kingdom from Opera Solutions (2011): “For example, in the private sector, even organisations with sophisticated and mature procure- ment capabilities can nevertheless typically achieve an additional 5–10% in savings by adopt- ing new processes and utilising advanced spend analytics and technology. Governments—who
- 11. 10 Controlling Federal Spending by Managing the Long Tail of Procurement IBM Center for The Business of Government are often more fragmented in their spending and have smaller procurement organisations—can gain even more. ” Thus, as Stegenga (2011) and others have urged, organizations need to look at better manag- ing tail spend to reduce their total acquisition costs, not just their actual procurement outlays. Only through looking at the total impact of tail spend on the organization at present can the potential for savings and efficiencies be accurately gauged. With better execution—and focus on tail spend—procurement can have a direct impact on efficiency and hence the bottom line. In fact, in the private sector, “Externally procured goods and services constitute anywhere between 40 percent and 80 percent of companies’ operating costs. That’s a sizable chunk of change, and an effective procurement function can have a direct impact on it (the bottom line)” (Cummings, 2008a). According to a recent white paper on tail spend from PROACTIS (2012), for the average company, “a 5% savings on tail spend can be the equivalent of a 10% increase in net profit.” And so, while addressing tail spend can bring significant savings and improved profitability in private sector firms, there is the same potential in the world of Items that are individually purchased and should be consolidated into existing supply contracts and competition systems. Misclassified Spending Items that are repeatedly purchased by various parts of the organization that could be consolidated into procurements and fall into the organization’s core spend based on the aggregate value of the buys. Fragmented Spending Encompasses spending that falls outside of the organization’s procurement guidelines. Maverick Spending Includes any spend items that have not been addressed by procurement in a reasonable period of time (generally considered to be two to three years). Unaddressed Spending Unusual Spending Low-Price, High-Frequency Items High-value items that are new procurements or are procured only once, or so rarely that the organization’s procurement staff has no expertise in the area. Items that have low individual value, but in the aggregate over time, are a significant amount of spend as spot buys of like items are repeated, both within units and across the organization. Items at the far end of the tail of spending, which represent very little value in tail spend analysis efforts. Low-Price, Low-Volume Items Figure 1: Categorizing Tail Spend
- 12. 11 Controlling Federal Spending by Managing the Long Tail of Procurement www.businessofgovernment.org government to do so and bring about critical cost savings and acquisition efficiencies. In doing so, reducing total acquisition costs can deliver important savings to the agency, and ultimately to the taxpayer. Challenges Involved in Managing Tail Spend With the significant costs involved, and the vast potential for cost savings and process improvement efficiencies, why has tail spend not been closely managed by most companies? As noted in a recent article in Purchasing Practice, the reason that most organizations— whether private or public sector—do not address tail spend is simple. It is “organizational inertia”—an unwillingness, or even a fear, of gaining the spend visibility to do so—and what that might find (Summer, 2012). In practice, however, the specific challenges involved in tackling tail spend include the following: • Poor data visibility • Lack of effective controls • Little market coverage • Seemingly low potential savings • Lack of interest from other stakeholders • Lack of category expertise in the very high number of categories in the tail While there are costs involved in every area of tail spend, one need look no further than the single area of indirect spend to see the significant costs. According to a 2012 survey conducted by HCMWorks (2012), almost three-quarters of C-level executives in firms with revenues of Strategic Sourcing in the Federal Government On November 9, 2011, President Barack Obama issued Executive Order 13589, Promoting Efficient Spending. In it, President Obama stated that the policy of the federal government was “committed to cutting waste in Federal Government spending and identifying opportunities to pro- mote efficient and effective spending … As they serve taxpayers, executive departments and agen- cies (agencies) also must act in a fiscally responsible manner, including by minimizing their costs, in order to perform these mission critical functions in the most efficient, cost effective way” (The White House, 2011). In this executive order, the President specified significant budget reduction targets for all federal agencies to meet, and in the present budgetary environment, lowering acquisi- tion costs became a major priority and strategic sourcing came to the fore once again. On the federal level, strategic sourcing has been defined as “a collaborative and structured process of analyzing an organization’s spend and using the information to make business decisions about acquiring commodities and services more efficiently and effectively” (Defense Acquisition University, 2013). Over the past decade, the federal government has made several efforts to push for greater use of strategic sourcing. To date, these efforts have had limited impact (Fox, 2006). In December 2012, Jeffrey D. Zients, deputy director for management at the Office of Management and Budget (OMB), issued a memo to the heads of all federal agencies calling for greater use of strategic sourc- ing, both within and across agencies, as a way to reduce total acquisition costs. Analysts have seen OMB’s action as raising the priority of strategic sourcing to a new level (Weigelt, 2012). And while the federal effort toward strategic sourcing is ongoing, the push for greater collaboration and costs savings has tail spend at its heart, as spend analysis will identify items that can be brought into the “core” from the “tail” and thereby increase spend under management in the federal government.
- 13. 12 Controlling Federal Spending by Managing the Long Tail of Procurement IBM Center for The Business of Government over $1 billion annually reported that they had little to no visibility or insight into their firm’s indirect expenditures. Thus, even though indirect spend can represent anywhere from 20%– 40% of a firm’s revenue, it is commonly an “overlooked” area in the scope of procurement (Weyn, 2012). Why is this aspect of tail spend so difficult to manage? It is because it is fragmented, often across the entire organization. Robert Brust is the former CFO of Sprint, Eastman Kodak Company, and Unisys. In his aptly titled article, “Indirect Procurement: From Back Office to Board Room,” Brust framed the issue well. He stated: The purchasing of indirect goods and services in categories such as professional ser- vices, plant/facility services, utilities, MRO and travel is often managed at the depart- ment level, and finance executives rarely see the magnitude of overall spend that these categories represent. When looked at individually, the dollar amount of indirect spending in each department seems insignificant when compared to raw materials. But, when added together, they can account for hundreds of millions of dollars. This spend is highly fragmented across business units, locations and departments. It spans thousands of end-users and encompasses hundreds of unique sub-categories, all requiring specialized supply market knowledge. (Brust 2012) Eye on the Tail, but Also on the Core For all the promise of greater savings, efficiencies, and control, the focus on tail spend should not come at the expense of the central task of acquisition management to manage the larger, core spending areas. Tail spend management should also not be presented as an additional burden for already overwhelmed acquisition shops and staffers. As a recent white paper on the matter from GEP (2011) put it, asking procurement executives and personnel to add tail spend to their list of priorities is “really tantamount to asking them to focus on the wrong things.” Tail spend management is an area where it is advisable for any government or government agency seeking to make headway and see results work with third parties. As has been the expe- rience with tail spend in the private sector, there is a significant opportunity for for-profit firms to engage and work with agencies on their tail spend management issues. Through crafting effec- tive partnership and share-in-savings agreements, both the public agency and the private-sector partner can see tremendous results from tackling tail spend in governmental acquisition. Controlling Tail Spend—Internal vs. External Solutions It would clearly be desirable to bring more and more of corporate procurement under control and increase spend under management. However, this is simply not possible from a practical standpoint today, and there is no shortcut to doing so. Most often, with limited resources and such a diversity of sources and goods/services, the idea of reaching beyond the core and attempting to manage the tail and increase the range of spend under procurements’ span of control can simply seem overwhelming to purchasing executives. Simon Aldred (2009) put it bluntly, what typically limits corporate procurement executives from tackling tail spend issues are two factors: their resources and their appetite for doing so, based on the constraints and realities they face today. Procurement executives reason that the broad range of spending—suppliers beyond the “big head” and the specific items in the long tail of purchases—is far too difficult to track and manage. And besides, with the limited inter- nal resources—often stretched to the breaking point today—at their disposal, it is far easier to make gains in dealing with the company’s core spending and its key, strategic supply partners. Taken in isolation, the low value of tail spend items may make the return on investment (ROI) of efforts to fix spending in any single area far lower than in addressing core spend categories (Raja and Bardell, 2011). However, the overall value of tail spend makes the ROI of such efforts perhaps more potentially valuable than in any other area of procurement.
- 14. 13 Controlling Federal Spending by Managing the Long Tail of Procurement www.businessofgovernment.org Much of the effort to attack the problem—and opportunity—of tail spend management thus today can be—and should be—done in conjunction with outside resources, given the limited internal resources available for such tasks and the ready availability of outside expertise in the area of spend analysis/analytics. There is research demonstrating the solid ROI for such efforts, which are estimated to be between $3 and $8 in returns for every dollar expended in procurement efficiency/savings initiatives (Cummings, 2008b). This accounts for the rapid growth of the procurement outsourcing market, which was expected to grow by 14% in 2012 alone (Weyn, 2012). Some efforts will reach dead ends and not produce either savings or pro- cess efficiencies. However, there are such tremendous opportunities for big wins to be produced through better tail spend management that the upside of such efforts will produce significant results (Ramachandran and Lawless, 2003). Theoretical Roots of the Tail Spend Management Concept Two prominent management axioms play a big role in both the development and understand- ing of the tail spend management concept. These are the 80/20 rule and the concept of the long tail. The 80/20 Rule One of the most widely known rules of thumb in business—and government—is the 80/20 rule—namely, that 80% of outcomes can be attributed to 20% of the causes for a given event. (In Appendix I, the roots of the long tail concept are examined: it is built on the 80/20 rule and its underlying concepts, including those of economist Vilfredo Pareto and quality management pioneer Joseph Juran). How does the 80/20 rule work in this instance in relation to the world of acquisition? In procurement terms, most private-sector firms will find that approximately 80% of their total spend on goods, services, and materials is with just 20% of their total num- ber of suppliers. And conversely, there is a long tail in that the remaining 20% of spend is spread out among a large number of suppliers, typically amounting to 80% of the total number of suppliers the firm has. Likewise, most companies find that typically, 80% of their expendi- tures are concentrated in just 20% of their total number of categories of supplies and services. While much of the focus today is on strategic sourcing and partnering with the core 20% of a firm’s suppliers, there is a newfound realization that costs can be shaved and efficiencies can be gained by better managing spend at the tail end of the corporate supply chain, both in terms of what is being bought (the non-core, 20% of procurements) and how and with whom the firm is dealing with (the non-core, remaining 80% of suppliers that represent approxi- mately 20% of total procurement spending). In government, we will see that the 80/20 rule holds up as well—both in terms of the concentration of suppliers and acquisition categories. Thus, the tail spend definition offered here operationalizes the concept so as to be both easily understood and reasonably approachable for procurement executives and acquisition staffers. The Long Tail Today, the long tail concept, initially spun by Chris Anderson to explain changed marketing prospects for companies in the age of the Internet, has taken on a life of its own and become part of our collective business and even popular culture language (See the box, A Short History of the Long Tail, on page 15). Yet perhaps nowhere is the concept more vital today than in the area of procurement, as organizations of all sizes recognize the opportunity—and necessity—of tackling what has become known as tail spend. In Anderson’s seminal Wired piece, he quoted Kevin Laws, a venture capitalist and music industry expert, as saying that the long tail simply meant that: “The biggest money is in the
- 15. 14 Controlling Federal Spending by Managing the Long Tail of Procurement IBM Center for The Business of Government smallest sales.” Now, let’s update and flip this statement for the procurement equation. Today, private-sector procurement executives are increasingly recognizing that there can be significant savings and gains in control and efficiencies by focusing on the remaining 80% of purchases and dealings with the remaining 20% of suppliers at the edge of the supply base. Companies of all sizes around the globe are recognizing that both the opportunities—and challenges—for better managing the tail of their purchasing are great. Through addressing their tail spend, companies have found an opportunity to: • Maximize savings and minimize the total cost of procurement • Coordinate and aggregate purchases across the organization • Cut down on maverick and “off-contract” spending Companies that better manage their tail spend will find that such efforts can have a direct impact on the firm’s bottom line. As Loughlin (2012) pointed out, “Ignoring tail spend is potentially leaving huge amounts of money on the table ... (as) the significant benefits avail- able from managing tail spend could be a new and as yet untapped source of savings.” With greater ability to contract with outside expertise in the areas of spend analysis/analytics (Hodge, 2009), the potential for organizations to gain insight into and take more control of their tail spend is now greater than ever before. Tail spend costs organizations of all types and sizes considerably. And for government today, tail spend holds perhaps even more significant prospects to deliver savings, efficiency, and compliance than in the private sector. Tail spend management is thus a huge issue—and opportunity—for public-sector procurement. The challenge to first assess and then to better manage tail spending comes at an especially critical time, as government executives across all agencies are being challenged to operation- ally “do more without more” financial resources. Thus, the savings and efficiencies that can be generated through proactive tail spend management will be especially important in both the short and long term. And by tackling tail spend, acquisition leaders have an opportunity not just to find savings, but to systematically address procurement practices throughout the orga- nization that can result in either (or both) one-time or chronic spending that may be rogue at best and criminal at worst. The question then for acquisition leaders at all levels of the public sector then becomes a simple one: How do we address our tail spend?
- 16. 15 Controlling Federal Spending by Managing the Long Tail of Procurement www.businessofgovernment.org A Short History of the Long Tail Media attention centered on Wired magazine editor Chris Anderson in 2004 when he first pro- posed the idea of the long tail. Anderson’s thesis was that the Web had changed the way people consumed media, and in turn, this changed the very basis of business models in the Internet era. In the pre-Internet era, media companies primarily focused on producing and selling megahits— the relatively small number of films, books, songs, and other products that would deliver the high- est sales volume. These best sellers drove the media business, and there was simply no business case for distributing lesser-known, niche works. With the need for physical production and distri- bution and the attendant costs associated with these functions, making the low-grossing, niche offerings available would be financially unattractive or even cost-prohibitive. From a statistical viewpoint, the long tail is a power law of distribution, used to explain any expanding market. In this case, the long tail worked to explain how the Internet changed the distribution and availability of media in a new age as the market expanded greatly. In analyzing sales of online music, books, and video content at the time (DVDs and CDs were the media of the moment), Anderson found that the real depth and size of these markets were likely far under- stated. While best sellers and core products indeed constituted 80% of sales/rentals for companies such as Amazon, Barnes and Noble, Walmart, and Netflix, the long tail of inventory for these sites/stores could be just as big—if not bigger—than the so-called big head of sales. Anderson made the case that in the age of the Internet, companies such as these, along with Google (which markets to users and advertisers on the long tail of interests) and eBay (whose wide array of items up for auctions were the very definition of the long tail) would succeed. In Anderson’s (2004) words, “When you think about it, most successful businesses on the Internet are about aggregat- ing the long tail in one way or another.” Anderson’s long tail took on a life of its own. It produced not just a best-selling book of the same name by Anderson on the subject in 2006, but also a series of academic studies and debates on the validity and nature of the tail and the potential for companies to exploit it. Most of this debate centered on the size of the big head (the primary focus of the market) versus the relative size and potential of the long tail (Manjoo, 2008; Orlowski, 2008). The long tail was indeed not a new concept, as the idea was essentially built around the 80/20 rule as it applied to new media and new digital sales and distribution methods. However, it is a rule of thumb that works like those of Pareto and Juran. Still, the long tail concept is a vital one today, as the idea has become part of the lingua franca of the business world. Countless com- panies today—both large and small—have proven how they can build successful platforms and businesses by catering to our panoply of choices in media, hobbies, breakfast cereals—every- thing—today. Niche markets and niche products are in, as demonstrated by everything from tele- vision shows catering to our interests in storage auctions, parking in major cities, househunting, pawn shops, hand fishing, and the rapid growth of microbrews. long tail top 20% variety popularity
- 17. 16 Controlling Federal Spending by Managing the Long Tail of Procurement IBM Center for The Business of Government Overview This section contains the findings of the first tail spend management-oriented analysis per- formed on government in the United States, looking at the largest entity—the federal govern- ment—as its subject. This research provides federal acquisition executives and policy makers with the first analysis that sizes federal tail spend, based on a newly developed approach to both size tail spend and to project tail spend management savings (detailed in Appendix II, Methods and Data). The report provides data-based tail spend estimates for the total federal government, for the Department of Defense (DoD), the agency which makes up the preponder- ance of all federal spending, and for each Cabinet-level federal agency (with detailed findings presented in Appendix III, Sizing Tail Spend at the Agency Level). Based on these estimates, we use a four-part savings estimation methodology to project the acquisition cost savings that can be achieved by agencies across the federal government and within the DoD (with detailed findings presented in Appendix IV: Projecting Federal Aggregate and Agency Spending Analysis).* The findings presented in this report should be valuable information for procurement leader- ship to understand the size of tail spend in the federal sector and the potential cost savings that can be found through better management of this unmanaged spend at the edge of the federal government. Additionally, we have provided the acquisition community and public pol- icy researchers and analysts with a new framework that can be applied to assessing tail spend size and potential cost savings at any level of government, both in the U.S. and abroad. Federal Aggregate and Agency Spending Analysis Analyzing the Top 100 Contractors Benchmark Examining the concentration of spending with top vendors provides insight into the size and scope of both the overall federal government’s tail spend and that of each individual federal agency. Certainly, the FPDS (Federal Procurement Data System) reporting on the top 100 con- tractors is a starting point for analyzing tail spend issues in the federal government. In conducting the present analysis, the author analyzed the top 100 contractors report from the FPDS. By combining reports from the agency and sub-agency levels, the researcher was able to construct tables on both the government and agency-wide levels of the top suppliers of goods and services to federal agencies. These are shown in Appendix II of this report: • Table II-A: Top 100 Contractors for the Federal Government, FY2012 • Table II-B: Top 100 Contractors for the Department of Defense, FY2012 * Appendixes are available at www.businessofgovernment.org. Analysis of the Long Tail of Federal Acquisition Spending
- 18. 17 Controlling Federal Spending by Managing the Long Tail of Procurement www.businessofgovernment.org In the aggregate, these top strategic suppliers make up the majority of federal acquisition spending. As can be seen in Table 1, these top 100 contractors account for 55.7% of all federal procurement spending and almost half of all acquisition actions. In the Department of Defense, the share of top contractors is even greater, as the top 100 vendors constitute 64.2% of all dollars expended on goods and services and 73.2% of all procurement actions. Table 1: Aggregate Spending with Top 100 Contractors, Total Federal Government and Department of Defense, FY2012 Aggregation Level Number of Actions Dollars Obligated %Total Actions % Total Dollars Total Federal Government 8.4 million 284.7 billion 48.2 55.7 Department of Defense 10.4 million 228.8 billion 73.2 64.2 Correlation of Top 100 Contractors to Strategic and Managed Spend In the interest of sizing tail spending for the first time in the federal sector, this research analysis makes a global assumption about core versus non-core spending. This would be the well- grounded argument that tail spend falls outside of procurement’s control and purview: in other words, the organization’s spend under management. In the federal context, spending with the top 100 suppliers of goods and services for any agency has to be considered strategic and managed. Thus, in the case of federal acquisition spending, one can presume that the size of the aggregate tail spend would—at the maximum—be the acquisition spending that falls out- side of the top 100 suppliers. Therefore, this figure will be considered to be the upper limit of federal tail spend, and the same formula will be applied on the individual agency level as well. And the top 100 criterion established by the General Services Administration and employed by the Federal Procurement Data System in producing its data reports is an apparently valid measure of the “strategic-ness” and “core-ness” of suppliers to federal agencies. For both the federal government as a whole, as can be seen in Table 2 and for the Department of Defense (Table 3), there is, of course, significant concentration amongst the “biggest of the big” federal contractors, but the top 100 supplier grouping does capture the suppliers who hold the major- ity share of federal contracting for goods and services. The focus on sizing tail spend by the dollar share of the top contractor groups is borne out by the vast disparity in the concentration of total contracting dollars versus total contracting actions. Indeed, the fact that the “largest of the large” contractors hold such a small percent- age of federal contracting opportunities—and opposed to dollars—stands as stark evidence of the importance—and potential—for better tail spend management in dealing with the vast number of transactions—and dollars—expended beyond the core group of suppliers. Table 2: Total Acquisition Spending with Top Contractors by Aggregation Level, Total Federal Government, FY2012 Level of Aggregation Total Number of Actions Total Dollars Obligated % Total Actions % Total Dollars Total Federal Government 17.5 million 511.4 billion 100 100 Top 100 Contractors 8.4 million 284.7 billion 48.2 55.7 Top 25 Contractors 295,594 193.7 billion 1.7 37.9 Top 10 Contractors 150,346 143.0 billion 0.9 28.0
- 19. 18 Controlling Federal Spending by Managing the Long Tail of Procurement IBM Center for The Business of Government Table 3: Total Acquisition Spending with Top Contractors by Aggregation Level, Department of Defense, FY2012 Level of Aggregation Total Number of Actions Total Dollars Obligated % Total Actions % Total Dollars Total Department of Defense 14.2 million 356.7 billion 100 100 Top 100 Contractors 10.4 million 228.8 billion 73.2 64.2 Top 25 Contractors 195,203 167.7 billion 1.4 47.0 Top 10 Contractors 136,652 127.7 billion 1.0 35.8 Sizing Tail Spend: Operationalizing the Construct with a Three-Level Estimate of Tail Spend While there is indeed greater integration and more collaboration to be found with suppliers in the top rankings of suppliers, all firms within the ranks of the top 100 benchmark should all be reasonably considered as “managed spend.” Conversely, it becomes far less likely—but possible—that suppliers number 101, 102 … 5000…. 10,000 are providing goods and/or services in a managed environment. Also, since the FPDS data used for this study did not pro- vide a way to break down spending by the type of item or service in question, it is indeed pos- sible to have unmanaged spend even with strategic sources. Thus, in this study, tail spend is not operationalized as a single point estimate, but rather with a three-level projection (see the box Calculating Tail Spend). Sizing Tail Spend: The Federal Government as a Whole Through the analysis method employed here, this researcher can project reasonably accu- rately, for the first time, the size of federal tail spend, both for the government as a whole and by individual agency. Taking the information presented earlier in Table 1, the federal govern- ment, as a whole, directed 55.7% of all procurement spending to its top 100 contractors. Thus, federal tail spend, based on FY2012 acquisition spending, would constitute 44.3% (Table 4) of aggregate acquisition spending. With federal procurement spending on goods and services totaling $511.4 billion in FY2012, the maximal expected tail spend for the federal government as a whole can be sized at $226.7 billion. And as can be seen in Table 4, the reasonably expected tail spend for the overall federal government was projected to be approxi- mately $181.4 billion. Finally, the minimal expected tail spend for the aggregate federal gov- ernment was calculated to be $113.3 billion. Table 4: Tail Spend Projections, Total Federal Government and Department of Defense, FY2012 Aggregation Level Total Dollars Obligated to Acquisitions Spend with Top 100 Contractors % Tail Spend % Maximal Expected Tail Spend Reasonably Expected Tail Spend Minimal Expected Tail Spend Total Federal Government 511.4 billion 55.7 44.3 226.7 billion 181.4 billion 113.3 billion Total Department of Defense 356.7 billion 64.2 35.8 127.9 billion 102.3 billion 63.9 billion
- 20. 19 Controlling Federal Spending by Managing the Long Tail of Procurement www.businessofgovernment.org Calculating Tail Spend This study employs three calculations in projecting tail spend for government agencies. These result in three tail spend projections, which are: • Maximal expected tail spend • Reasonably expected tail spend • Minimal expected tail spend Maximal Expected Tail Spend This assumes that the amount of tail spend is at the maximum (upper limit) of 100% of the acqui- sition spending that falls outside of the top 100 supplier group. • The calculation for maximal expected tail spend is thus: Total Agency Acquisition Spend – Spend with Top 100 Contractors = Maximal Expected Tail Spend Reasonably Expected Tail Spend This assumes that an agency can reasonably be considered to have as managed spend an addi- tional 20% of its total spending beyond that directed to the top 100 supplier group. Thus, reason- ably expected tail spend is the agency acquisition spending that falls outside of this range. • The calculation for reasonably expected tail spend is thus: Maximal Expected Tail Spend – 20% of Maximal Expected Tail Spend = Reasonably Expected Tail Spend Minimal Expected Tail Spend This assumes that an agency can reasonably be considered to have as managed spend—at most— an additional 50% of its total spending beyond that directed to the top 100 supplier group. Thus, minimal expected tail spend is the agency acquisition spending that falls outside of this range and represents the minimum (lower limit) of tail spend for the agency. • The calculation for minimal expected tail spend is thus: Maximal Expected Tail Spend – 50% of Maximal Expected Tail Spend = Minimal Expected Tail Spend
- 21. 20 Controlling Federal Spending by Managing the Long Tail of Procurement IBM Center for The Business of Government Sizing Tail Spend: The Department of Defense With the Department of Defense making up the majority of all federal acquisition spending, siz- ing the tail of the DoD is of utmost interest. Thus, again using the same three-part tail spend determination methodology and the data from Table 1, tail spend for the DoD is 35.8% of aggregate defense procurement outlays. As can be seen in Table 4, with DoD acquisition spending adding up to $356.7 billion in FY2011, the size of the Department of Defense’s tail spend can be pegged at a maximum of $127.9 billion. Following the prescribed calculations for determining the other two levels of tail spend projections, the reasonably expected tail spend for the Department of Defense was estimated to be approximately $102.3 billion and at the minimum, lower limit, the DoD’s tail spend was pegged to be $63.9 billion. Sizing Tail Spend: Cabinet-Level Agency Analysis Using this same three-part methodology, tail spend estimates can be provided for all Cabinet- level federal agencies. The first step in the process is to determine the top 100 contractors for each agency. Using the FPDS report data on the top 100 contractors, the data were aggre- gated to size the percentage of each agency’s spending that was directed toward these strate- gic suppliers. The summary of these findings is presented in Table 5. Table 5: Spending with Top 100 Contractors by Cabinet-Level Agency, Total Federal Government, FY2012 Agency Number Of Actions Dollars Obligated % Total Actions % Total Dollars Department of Agriculture 6,887 3.0 billion 9.4 57.4 Department of Commerce 6,266 1.6 billion 24.9 66.9 Department of Defense 10.4 million 228.8 billion 73.2 64.2 Department of Education 1,346 1.9 billion 38.6 95.0 Department of Energy 4,842 24.7 billion 35.5 98.4 Department of Health and Human Services 12,926 12.9 billion 14.7 67.5 Department of Homeland Security 16,963 8.0 billion 19.1 64.1 Department of Housing and Urban Development 893 1.5 billion 25.7 101.4 Department of the Interior 8,791 2.0 billion 10.2 49.2 Department of Justice 44,765 4.1 billion 22.4 63.8 Department of Labor 3,111 1.8 billion 33.3 88.7 Department of State 11,368 6.0 billion 29.3 81.8 Department of Transportation 6,714 4.5 billion 30.7 72.1 Department of the Treasury 7,826 5.0 billion 22.8 85.5 Department of Veterans Affairs 1.4 million 10.0 billion 71.4 58.2 Environmental Protection Agency 12,068 1.2 billion 52.0 80.6 General Services Administration 189,101 6.2 billion 30.7 65.3 National Aeronautics & Space Administration 17,318 14.6 billion 39.3 87.7
- 22. 21 Controlling Federal Spending by Managing the Long Tail of Procurement www.businessofgovernment.org There is wide variation in the size and scope of the concentration of spending with the top 100 contractors among the agencies. Additionally, there is a lack of correlation between the percentage of total dollars awarded to the top 100 contractors and the percentage of total actions accounted for by the strategic suppliers. For instance, in the Department of Energy (DoE), while 98.4% of the agency’s total procurement spending was directed toward the top 100 suppliers, the same group accounted for only 35.5% of the agency’s acquisition actions. This meant that for DoE, the average award for suppliers among the top 100 contractors was large. In fact, the average award was almost $4.8 million. On the other hand, due to the vari- ations in the number and kind of awards being made, the Department of Veterans Affairs made far more awards—almost 1.4 million—to its top 100 suppliers. This core supplier group, while still accounting for 58.2% of the VA’s total procurement spending, saw an aver- age award size of under $10,000. Similar comparisons can be made both across—and within—the various federal agencies due to the unique procurements necessary for their unique missions. Thus, there is great variability to be found among the Cabinet-level agencies in terms of both the nature of their acquisition spend and their concentration of spending with their top strategic suppliers. To size the individual agencies’ tail spend, we employed the same three-part methodology used to generate tail spend estimates in the aggregate for both the federal government as a whole and for the Department of Defense. As can be seen in Table 6, there is indeed great variability in the percentage of agency procurement spending that can be rightly classified as “tail spend” and the total maximum amount of tail spend. Overall, these federal agencies had a total maximal expected tail spend of $35.5 billion in FY2012, with the greatest amount— about $7.2 billion—being found in the Department of Veterans Affairs. The Department of Housing and Urban Development has no tail spend for FY2012, as its spending was almost exclusively with the top 100 contractors. In fact, in FY2012, due to large chargebacks and other acquisition actions, HUD actually had a small negative tail spend. The average maximum tail spend percentage across all non-Defense Cabinet-level agencies was found to be 24.5%. Outside of HUD, Energy has the lowest percentage (1.6%) of its acquisition spending categorized as tail spend, with the highest percentage (50.8%) of tail spend being at the Department of the Interior. The agency with the lowest total dollar amount of tail spend was the Department of Education, and yet, this agency still had maximal expected tail spend in excess of $100 million. Sizing Tail Spend: Agency Level Analysis within the Department of Defense The Department of Defense has just under 36% of its overall acquisition spending that can be potentially categorized as tail spend. Overall, out of the almost $356.7 billion spent on procuring goods and services in FY2012, the maximal tail spend accounted for almost $128 billion (Table 4 on page 18). However, there are wide variations in the degree of concentra- tion of agency acquisition spending with core, strategic suppliers, as is the case in agency- level analysis. This can be seen in the analysis of DoD agency-level spending for FY2012, shown in Table 7. Among the Departments of the Army, Navy, and Air Force, on average approximately one-quarter of all acquisition actions were conducted with the top 100 con- tractors for each agency, but these strategic suppliers saw almost three-quarters of all agency procurement spending directed to them. A majority of all DoD agencies had in excess of 90% of their acquisition spending directed toward their respective top 100 contractors. In fact, 13 DoD agencies had about 90% or more of their spending on goods and services directed to these core contractors. Their respec- tive missions can explain this concentrated spending with core, strategic partners. Thus, with little to no potential tail spend, these do not merit agency-level analysis in this setting, even
- 23. 22 Controlling Federal Spending by Managing the Long Tail of Procurement IBM Center for The Business of Government Table 6: Tail Spend Estimates for Non-Defense Cabinet-level Agencies in the Federal Government, FY2012 Agency Total Acquisition Spending Non-Core Spend % Maximal Expected Tail Spend Reasonably Expected Tail Spend Minimal Expected Tail Spend Department of Agriculture 5.2 billion 42.7 2.2 billion 1.8 billion 1.1 billion Department of Commerce 2.3 billion 33.1 777.4 million 621.9 million 3887 million Department of Education 2.0 billion 5.0 102.9 million 82.3 million 51.4 million Department of Energy 25.1 billion 1.6 405.5 million 324.4 million 202.8 million Department of Health and Human Services 19.1 billion 32.5 6.2 billion 5.0 billion 3.1 billion Department of Homeland Security 12.6 billion 35.9 4.5 billion 3.6 billion 2.3 billion Department of Housing and Urban Development* 1.4 billion -1.4 -19.6 million -15.7 million -9.8 million Department of the Interior 4.1 billion 50.8 2.1 billion 1.7 billion 1.1 billion Department of Justice 6.4 billion 36.2 2.3 billion 1.9 billion 1.2 billion Department of Labor 2.0 billion 11.3 227.3 million 181.8 million 113.6 million Department of State 7.3 billion 18.2 1.3 billion 1.1 billion 663.8 million Department of Transportation 6.2 billion 27.9 1.7 billion 1.4 billion 869.9 million Department of the Treasury 5.8 billion 14.5 848.7 million 679.0 million 424.4 million Department of Veterans Affairs 17.1 billion 41.8 7.2 billion 5.7 billion 3.6 billion Environmental Protection Agency 1.5 billion 19.4 290.8 million 232.6 million 145.4 million General Services Administration** 9.5 billion 34.7 3.3 billion 2.6 billion 1.6 billion National Aeronautics and Space Administration** 16.6 billion 12.3 2.0 billion 1.6 billion 1.0 billion * NOTE 1: Because of chargebacks and other actions, the agency had over 100% of its spend allocated to the Top 100 contractors for the agency, and thus negative tail spend projections. ** NOTE 2: These two agencies (the General Services Administration and the National Aeronautics and Space Administration) were incorporated in the analysis, as they were included in the FPDS Top 100 Contractors Report due to the size and scope of their respective acquisition activities.
- 24. 23 Controlling Federal Spending by Managing the Long Tail of Procurement www.businessofgovernment.org though their respective acquisition executives would be advised to carefully look at their spend patterns for potential issues relating to tail spend. In point of fact, in FY2012, the Defense Microelectronics Activity (DMEA) spent all of its $822.5 billion with a total of just 79 firms, making the issue of the core, top 100 contractors a non-issue for DMEA. Therefore, in projecting agency-level tail spend estimates, the specific agencies examined are the Departments of the Army, Navy, and Air Force, plus all DoD agencies with less than 90% of their annual acquisition spend in FY2012 directed to their top 100 suppliers. These include: • Defense Information Systems Agency (DISA) • Defense Logistics Agency (DLA) • Defense Commissary Agency (DeCA) • Washington Headquarters Services (WHS) These results are spotlighted in Table 8. Table 7: Spending with Top 100 Contractors by Agency in the Department of Defense, FY2012 Department of Defense Agency Number Of Actions Dollars Obligated %Total Actions % Total Dollars Army 53,867 65.0 billion 14.6 61.4 Navy 83,804 70.5 billion 27.2 75.8 Air Force 46,832 58.8 billion 32.8 84.9 TRICARE Management Activity (TMA) 2,129 11.9 billion 58.2 99.9 Defense Threat Reduction Agency (DTRA) 1,207 992.3 million 66.2 94.7 Defense Microelectronics Activity (DMEA) 633 822.5 million 100.0 100.0 United States Transportation Command (USTRANSCOM) 10.8 million 7.8 billion 99.9 99.8 Defense Advanced Research Projects Agency (DARPA) 809 783.4 million 74.6 99.3 Defense Information Systems Agency (DISA) 65,531 4.7 billion 88.8 89.8 Defense Logistics Agency (DLA) 296,814 34.1 billion 54.5 79.3 Defense Security Service (DSS) 567 58.7 million 34.3 98.2 Defense Commissary Agency (DeCA) 1.1 million 5.3 billion 59.1 83.9 Defense Finance and Accounting Services (DFAS)* 806 191.3 million 66.7 100.0 Defense Media Activity (DMA) 751 135.4 million 56.6 93.7 Department of Defense Education Activity (DODEA) 1,623 244.2 million 51.9 90.7 Washington Headquarters Services (WHS) 1,519 916.9 million 49.3 89.2 Missile Defense Agency (MDA) 3,782 6.8 billion 87.1 99.8 United States Special Operations Command (USSOCOM) 5,455 2.5 billion 61.9 94.0 * NOTE: Because of chargebacks and other actions, the agency had over 100% of their spend allocated to the top 100 contractors for their agency.
- 25. 24 Controlling Federal Spending by Managing the Long Tail of Procurement IBM Center for The Business of Government The initial sizing projection for DoD here was that for the agency as a whole, the maximal tail spend for FY2012 was an upper limit of $127.9 billion (Table 4 on page 18). As can be seen in Table 8, the maximal expected tail spend for the three armed services alone is almost $74 billion. In the Defense Logistics Agency (DLA), the upper limit of expected tail spend is almost $9 billion, and for the Defense Commissary Agency (DeCA), the size of the tail could be in excess of $1 billion, while at the minimal expected level, DeCA’s tail spend would stand at over half a billion dollars. For the Washington Headquarters Services (WHS), with approximately 10% of its acqui- sition outlays falling beyond the core supplier group, its tail spend would fall between $55.6 and $111.1 million annually, based on WHS’ FY2012 procurement spending. And for the non- analyzed DoD agencies (with tail spend sizing of less than 10% of procurement outlays), there is still a need for agency procurement executives to review their spending and see if a full spend analysis and tail spend management effort would prove beneficial. Based on the best practices in the area, such an effort would still uncover significant amounts of non-compliant spending and fragmented purchases that could be consolidated into more strategic, core buying areas— bringing more spend under management in their respective agency. Analysis of Tail Spend Data The analysis presented here has been the first attempt by any researcher or analyst to size tail spend for the federal government as a whole, for Cabinet-level agencies, and for the Department of Defense. As such, it is substantive in that it will equip acquisition executives and policy makers with insight into the size and scope of tail spend issues in federal procure- ment. For the federal government collectively, based on the most recent data available from the FPDS, the federal tail constitutes between $113.3 and $226.7 billion annually. Likewise, for the DoD, the defense tail falls between $63.9 and $127.9 billion yearly. These are sub- stantial numbers that would be addressable in any era, but in an era of tight budgetary times, the need to improve tail spend management in government is clear. Thus, there are two invari- able follow-up questions: • What are the potential savings to be gained through better tail spend management? • How do we get there? Table 8: Tail Spend Estimates for the Armed Services and Select Department of Defense Agencies, FY2012 DoD Agency Total Acquisition Spending Non-Core Spend % Maximal Expected Tail Spend Reasonably Expected Tail Spend Minimal Expected Tail Spend Army 105.7 billion 38.6 40.8 billion 32.6 billion 20.4 billion Navy 93.0 billion 24.2 22.5 billion 18.0 billion 11.3 billion Air Force 69.3 billion 15.1 10.5 billion 8.4 billion 5.2 billion Defense Information Systems Agency (DISA) 5.2 billion 10.2 531.3 million 425.0 million 265.6 million Defense Logistics Agency (DLA) 43.0 billion 20.8 8.9 billion 7.1 billion 4.5 billion Defense Commissary Agency (DeCA) 6.3 billion 16.1 1.0 billion 819.0 million 511.9 million Washington Headquarters Services (WHS) 1.0 billion 10.8 111.1 million 88.9 million 55.6 million
- 26. 25 Controlling Federal Spending by Managing the Long Tail of Procurement www.businessofgovernment.org Appendix III tackles the “how much potential savings are there” question on the same aggre- gate and agency-specific levels of analysis. In summary, it is important to note at the outset that the savings projections generated by this research are far more conservative than the tail spend management savings demonstrated in private industry. Consistent with this report’s approach at sizing tail spend in agencies, rather than providing a single annual savings target, we have provided acquisition executives and policy makers with a 4x3 matrix of savings esti- mates for each level of aggregation (federal government, DoD, and individual agencies). In doing so, we show that based on the level of commitment from agency acquisition leaders to a tail spend management effort and the results of their agency-level spend analyses—which is the only way to accurately size both tail spend and project savings/efficiencies, there are a range of possible savings outcomes. That being said, solid estimates presented here show that for the federal government as a whole, an aggressive tail spend management effort could pro- duce savings of between $6.8 and $13.6 billion annually. And in the Department of Defense alone, proactive, dedicated approach to tail spend management could generate savings of $7.7 billion annually. In the end, such numbers would be just an academic exercise without guidance on how to bring about real change—an awareness of the size and scope of tail spend and the potential for very real savings and efficiencies to be brought about through actually tackling the underlying prob- lems. Thus, in the concluding section of this report, there is both a model for addressing tail spend management and seven approaches to better managing tail spend in the public sector. Unlike other such frameworks offered in the emerging field of tail spend management that have heretofore been geared to the private sector, these tools provide public-sector acquisition execu- tives in all levels of government, both in the U.S. and abroad, with a path forward to address their agency’s tail spend management and drive change that can generate real savings, real efficiencies, and real results. In doing so, addressing the tail of governmental procurement spending can make acquisition—and the acquisition function—more strategic in the process.
- 27. 26 Controlling Federal Spending by Managing the Long Tail of Procurement IBM Center for The Business of Government Overview Tail spend management has become an important focus across the private sector. Now, look- ing at leading companies’ solid results and emerging best practices, both in the U.S. and abroad, public-sector acquisition leaders should begin to take note of—and take action on— tail spend. This is an especially critical time for all in public-sector procurement, with the continuing budget challenges and the increasing expectations for government to operate more efficiently and transparently. The foregoing analysis revealed the potential size of tail spend and the savings that can be achieved from addressing it at the federal level. And so, regard- less of where and at what level government manages the acquisition of goods and services, the tail spend opportunity is an important one. If tail spend can be addressed at the federal level, it can—and should—be addressed through- out the American public sector. Acquisition leaders thus have a pivotal role to play in not just making the case for tail spend management, but in seeing that their agencies take on a here- tofore intractable problem that now represents an opportunity—perhaps the best opportu- nity—for finding new procurement savings and efficiencies. In the concluding section of this report, we provide acquisition executives at the federal, state or local level with: • A model for addressing tail spend management • Seven approaches to managing tail spend A Model for Addressing Tail Spend Management Figure 2 shows a conceptual model for addressing tail spend. This model will work both in the public and private sector, for the issues are much the same. Tail Spend Awareness Tail spend education should come before any tail spend management effort can effectively proceed. This belief is offered in contrast with other tail spend management models (i.e. GEP, 2011; Woodcock, 2012). It is absolutely vital to the success of any tail spend management effort to conduct outreach—both within the acquisition area and in the larger organization—as to what tail spend is and why it is an important area of concern. Thus, tail spend awareness is a pre-step—the necessary prerequisite—at the heart of our tail spend management model. Creating an awareness of the tail spend concept—what it encompasses and why it is different from the organization’s managed spend—is key to getting buy-in from executives and from acquisition staffers. For the former group, this is paramount, for there will be an upfront investment needed for the effort, as the spend analysis will necessitate contracting with a Recommendations: Seven Approaches to Managing Tail Spend
- 28. 27 Controlling Federal Spending by Managing the Long Tail of Procurement www.businessofgovernment.org third-party specialist to perform the deep-dive data analysis. For the latter group, tail spend awareness is crucial not just to educating procurement staffers on the importance of the con- cept, but also in reassuring them that the effort to gain control over the agency’s tail spend will not create new work and new burdens for them. This outreach effort should be initiated either before, or at least in tandem, with the work of the third-party expert conducting the spend analysis. Then, when the spend analysis is concluded, the acquisition area will be fully knowledgeable about the tail spend concept and ready to buy into addressing it. The key element here is to gain buy-in for addressing tail spend—both from above, in terms of executive-level support and funding, and from below, in order to gain the support of acquisi- tion staffers. It is critical also to get support from rank-and-file managers and employees out- side of the acquisition area. This is vital in the effort to address tail spend—and its attendant costs and inefficiencies—while beneficial for the agency as a whole. It may in fact prove dis- ruptive in the short term, to both units and individuals in the organization, if changes are made in the way they procure needed goods and services. As a leading analyst framed the issue: “There is no doubt that tail spend management requires commitment from key stake- holders within any organisation. This is not a quick fix savings exercise, however, given the appropriate focus, it can deliver significant cost savings and value-add over time” (Shake Business Solutions, 2012). Spend Analysis The necessary first step in the tail spend management model is spend analysis. In congruence with the other experts in this emerging field of both study and practice, we strongly believe that a thorough spend analysis is the foundational action necessary for an organization to honestly and proactively tackle its tail spend issues. As documented earlier, there are today third-party procurement services readily available that will perform spend analysis for the organization, and we would strongly recommend that any agency seeking to take on its tail spend should contract with these specialists. The outside perspective and expertise that they bring to the table and the solid ROI of the contracting arrangements for such services make using a third-party firm an absolute necessity. In taking spend analysis out of house, one also does not begin the path to tail spend management by further overburdening existing acquisition staff with another project. Spend Analysis Tail Spend Awareness Spend Sorting and Clarifying Spend Implementation Figure 2: Tail Spend Management Model
- 29. 28 Controlling Federal Spending by Managing the Long Tail of Procurement IBM Center for The Business of Government What should the spend analysis focus upon? A good model to follow is provided by the Defense Acquisition University (2013), which advises that spend analysis should break down agency spending in terms of: • Who did the buying? (contracting agency) • Who did the spending? (requesting agency) • How much was spent? • What type of contract award was used? • What was purchased? • What was the size of the purchase? • What acquisition method was used? • What type of contract was used? • Who received the work? We would add three additional areas of concern that specifically relate to tail spend manage- ment. These are: • When was the purchase made? • From where (geographically) did the request come? • Was the purchase fully compliant with all applicable acquisition policies? By adding these areas that focus on “maverick” purchasing and acquisitions made at the far reaches of the agency, one can uncover both areas of concern and non-compliance. Spend Sorting and Clarifying The second step in the tail spend management model is spend sorting and clarifying. This is the stage at which the third party has presented the agency with the findings of its spend analysis. Now, there needs to be a period when the outside experts and the internal ones—the acquisition executives and staffers—analyze the results and refine them for actionable items. With the results of spend analysis in hand, the first task is “determining why each block of spend is in the tail and hopefully remove it” (Barner, 2012). From private-sector experience with tail spend management efforts, the initial findings of a spend analysis are almost always not clear as to “this is tail” and “this is core.” Indeed, there are often shades of gray and areas that necessitate further research and refinement. Yet, this dialogue is productive in pinpointing both immediate areas of concern (i.e., areas where there may be clear and sizable maverick spending ongoing in the organization) and areas where immediate action to consolidate fragmented and/or misclassified spending can be quickly accomplished. Spend that has been unnecessarily duplicated and fragmented can be consolidated and made strategic—and thereby be in the core of agency spending—increasing its spend under manage- ment. As a recent white paper from GEP (2011) squarely framed the matter, “right from the start managing tail spend effectively involves reducing the size of the tail.” This is accomplished by identifying spend that was formerly handled on an ad hoc or even improper manner and routing the buys for those goods and services through “normal” acquisition channels. As Flanagan (2012) noted, with the consolidation of buys, “Suddenly, there is an opportunity to simplify buying patterns for these different goods and services and present them to the market in a much more strategic and compelling way.” With the consolidation of spot buying in low-
- 30. 29 Controlling Federal Spending by Managing the Long Tail of Procurement www.businessofgovernment.org volume categories into larger, even contracted buying opportunities, the organization can gain better pricing and significantly reduce outlays in specific categories of goods and services. Spend Implementation The final step in our model is spend implementation. Please note that this is not a third and final step, as effectively managing tail spend is not a one-time, one-shot endeavor. Rather, it should be thought of as an ongoing process, and spend analyses should be conducted periodi- cally as a check to ensure that the organization, as a whole, is doing as effective a job as pos- sible at managing the entirety of its spend—both in the core and in the tail. Specifically, however, guidance as to targeted actions for the spend implementation phase, based on the seven types of tail spend, follow. Seven Ways to Improve Tail Spend Management Overview How should you go about addressing the tail spend management issues that a spend analysis uncovers? The seven-category typology used here for tail spend has been: • Maverick spending • Unaddressed spending • Fragmented spending • Spending on low-price, high-frequency items • Misclassified spending • Unusual spending • Spending on low-price, low-volume items The specific categorization is not nearly as important as the fact that the spending is being focused upon, first in the spend analysis itself, and then in the tail spend management effort. Also, the order of priority certainly will change given the specific situation for the agency and the amount and form of spend that might fall into any of the categories. The common theme among the options is that in no case does tail spend management involve placing a burden on the acquisition area with additional work, nor is there any blame to be cast for past practices (unless, of course, criminality might be involved). The focus is—as it always should be—look- ing forward to creating better and more efficient procurement practices for the organization that will benefit the entire agency and those that it serves. Each category of tail spend needs a unique approach to effectively address the specific spend- ing within it and the attendant issues involved. The spend analysis will highlight areas that need immediate managerial attention, while other areas will depend on the experience and interaction of acquisition leaders and third-party specialists to determine what is the appropri- ate path to pursue and how fast, how deep, and how broad to take the effort. Through taking actions such as those described here for each category of tail spend, acquisition executives will find that tail spend management efforts will not only produce a quick ROI (return on investment) on the spend analysis from attacking obvious issues, but moving forward, can generate significant savings and operational benefits from attacking the harder problems. This is because the ongoing work with third-party specialists can pinpoint emerging non-compliant spending issues and address problems far earlier in time that what standard operating proce- dures would have uncovered.
- 31. 30 Controlling Federal Spending by Managing the Long Tail of Procurement IBM Center for The Business of Government Maverick Spending What It Is This category encompasses spending that falls outside of the organization’s procurement guidelines. What Are the Action Options? • Determine how, when, and why the spending occurred. • Clearly identify who was behind the acquisitions and what their motivations were. • Ascertain why the purchase(s) fell outside procurement guidelines and determine if any changes to the regulations are in order to support the agency’s mission. • Examine if spend can be routed into existing contracts. Unaddressed Spending What It Is This category includes any spend items that have not been addressed by procurement in a reasonable period of time (generally considered to be two to three years). What Are the Action Options? • Determine why the good/service in question has not been competed recently. • Establish whether or not the item is the most current and/or appropriate for the situa- tion. • Consider if there are like substitutes available for the item that would be available through normal channels. • Examine if spend can be routed into existing contracts. • Consider reverse auctioning to ensure appropriate competition for the goods/services involved. Fragmented Spending What It Is These are like items that are being repeatedly purchased by various parts of the organization that could be consolidated into procurements that would fall into the organization’s core spend based on the aggregate value of the buys. What Are the Action Options? • Target fragmentation and investigate why this has occurred historically. • Consolidate buys across users, locations, and units within the agency as much as possible. • Work toward intra- and interagency consolidation of spend in targeted items to lever- age buying power and buy more strategically. • Examine whether spend can be routed into existing contracts (and whether contracts need to be re-competed due to heightened use volumes). • Consider reverse auctioning to ensure appropriate competition for the goods/services involved.
- 32. 31 Controlling Federal Spending by Managing the Long Tail of Procurement www.businessofgovernment.org Spending on Low-Price, High-Frequency Items What It Is These are items that have low individual value, but in the aggregate over time, are a signifi- cant amount of spend as spot buys of like items are repeated, both within units and across the organization. What Are the Action Options? • Consider if there are like substitutes available for the item that would be available through normal channels. • Consolidate buys across users, locations, and units within the agency as much as possible. • Work toward intra- and interagency consolidation of spend in targeted items to lever- age buying power and buy more strategically. • Examine if spend can be routed into existing contracts. • Consider reverse auctioning to ensure appropriate competition for the goods/services involved. Misclassified Spending What It Is This category includes items that are being purchased individually that should be consolidated into existing supply contracts and competition systems. What Are the Action Options? • Reclassify spend into proper categories. • Examine if spend can be routed into existing contracts. • Determine if spend needs to be re-competed through normal processes • Consider reverse auctioning to ensure appropriate competition for the goods/services involved. Unusual Spending What It Is These are high-value items that are new procurements or are procured only once, or so rarely that the organization’s procurement staff has no expertise in this area. What Are the Action Options? • Consider if there are like substitutes available for the item that would be available through normal channels. • Consider reverse auctioning to ensure appropriate competition for the goods/services involved. Spending on Low-Price, Low-Volume Items What It Is These are items at the far end of the tail of spending, which have very little value to look at in tail spend analysis efforts due to these characteristics.
- 33. 32 Controlling Federal Spending by Managing the Long Tail of Procurement IBM Center for The Business of Government What Are the Action Options? • Categorize items that need not have further consideration so as not to consume any additional attention in tail spend management efforts. • Determine if items can be consolidated in any way, both on an intra- and interagency basis. • Consider if there are like substitutes available for the item that would be available through normal channels. • Consolidate buys across users, locations, and units within the agency as much as possible. • Examine if spend can be routed into existing contracts. • Consider reverse auctioning to ensure appropriate competition for the goods/services involved. Discussion of Managing Tail Spend There are some common themes that emerge from efforts to better manage tail spend. One key point is that by addressing tail spend areas, one outcome will be to move more spend- ing—through more coordination, consolidation, and “defragmentation” of spend—from the tail to the core. The byproduct of this is that the agency’s spend under management will grow, and as experience has shown, the metrics associated with the acquisition area should be aug- mented by this development. Importantly, this positive development does not come by loading more work onto the existing, often overburdened acquisition staff, thereby producing a win-win situation for all in the procurement function. Thus the decision to make the necessary invest- ments in time, managerial attention, and organizational resources necessary to effectively and proactively tackle tail spend management issues is, in essence, a “no-brainer.” The return on investment for tail spend management efforts can thus be measured not just in savings, but in improved coordination and compliance. Additionally, there will be a secondary, harder-to-measure—but perhaps even more important—ROI achieved. By making important strides in improving operational efficiencies, the acquisition function’s stature as a valuable partner in the agency’s success in mission achievement will be enhanced. Finally, the irony is that the best path to more strategic sourcing and focus on core spending may be to focus on the long tail of spending. As leading-edge organizations, including the fed- eral government, look to greater use of strategic sourcing, a new look at the edge of procure- ment—beyond spend under management today—may well be the way forward and the way to increase spend under management, and in the process, make the acquisition function even more strategic.
- 34. 33 Controlling Federal Spending by Managing the Long Tail of Procurement www.businessofgovernment.org Accenture (2013). Stop Chasing the Tail: Leverage Third Parties to Eradicate Tail Spend Waste. Insight, February 14, 2013. Available at: http://www.accenture.com/ SiteCollectionDocuments/microsites/supply-watch/13-0205U_StopChasingTail_PoV_LoRes.pdf. Aldred, Simon (2009). Manage Your Tail Spend. ADR Business Briefing, April 2009. Available at: http://www.adr-international.com/new-media-pr/articles/manage_your_tail/. Anderson, Chris (2004). The Long Tail: Forget Squeezing Millions from a Few Megahits at the Top of the Charts. The Future of Entertainment is in the Millions of Niche Markets at the Shallow End of the Bitstream. Wired, October 2004. Available at: http://www.wired.com/ wired/archive/12.10/tail.html. Barner, Kelly (2012). Tail Spend Management—How to Squeeze Savings from the Most Fragmented 20% of Spend, Buyers Meeting Point, February 23, 2012. Available at: http:// buyersmeetingpoint.com/blogs/bmps-qthe-pointq/entry/webinar-notes-tail-spend-management- how-to-squeeze-savings-from-the-most-fragmented-20-of-spend. Bartolini, Andrew (2012). Measure of Success. CPO Agenda, January 2012. Available at: http://www.cpoagenda.com/previous-articles/winter-2011-12/features/measure-of-success/. Brust, Robert (2012). Indirect Procurement: From Back Office to Board Room. Business Finance, February 15, 2012. Available at: http://businessfinancemag.com/article/indirect-pro- curement-back-office-board-room-0215. Cummings, John (2008a). Procurement’s Time to Shine. Business Finance, October 6, 2008. Available at: http://businessfinancemag.com/article/procurements-time-shine-1006. Cummings, John (2008b). How to Move Procurement to the Next Level. Business Finance, November 3, 2008. Available at: http://businessfinancemag.com/article/how-move-procure- ment-next-level-1103. Defense Acquisition University (2013). Acquipedia: Strategic Sourcing. Available at: https://dap.dau.mil/acquipedia/Pages/ArticleDetails.aspx?aid=694501c0-e1ba-4f62-8e37- 855f80b876b1. Federal Procurement Data System—Next Generation (2012). Top 100 Contractors Report for FY2012. Available at: https://www.fpds.gov/fpdsng_cms/index.php/reports/62-top-100-con- tractors-report. References
- 35. 34 Controlling Federal Spending by Managing the Long Tail of Procurement IBM Center for The Business of Government Flanagan, Mike (2012). The Trend Towards Tail End Spend Management, Xchanging, September 10, 2012. Available at: http://blogs.xchanging.com/generic-blog/trend-towards-tail- end-spend-management-mike-flanagan. Fox, Neal (2006). Dynamic Strategic Sourcing, Contract Management, November 2006, 57–58. Available at: http://www.ncmahq.org/files/Articles/85679_CM1106_-_C03_Sourcing.pdf GEP (2011). Understanding Tail-Spend Management—A White Paper from GEP—Global eProcure. Available at: http://www.gep.com/sites/default/files/docs/Whitepaper-tailspend.pdf Gens, Frank (2006). The IT Market’s $150B SMB “Long Tail.” IDC Exchange, March 15th, 2006. Available at: http://blogs.idc.com/ie/?p=53. HCM Works (2012). 2012 Survey Results—Indirect Services Procurement: The Roadmap to Success (Released May 2012). Available at http://hcmworks.com (registration required). Hodge, Barbara (2009). Squeezing the Last Drop—Managing Tail-End Spend. Shared Services News, June 10, 2009. Available at: http://www.ssonetwork.com/squeezing-the-last- drop-managing-tail-end-spend/5086-6-A. Koch, Richard (1999). The 80/20 Principle: The Secret to Achieving More with Less. New York: Crown Business. Loughlin, Pete (2012). Supply Chain Finance—Are You Ignoring Your Greatest Source of Saving? Purchasing Insight (May 7, 2012). Available at: http://purchasinginsight.com/supply- chain-finance-are-you-ignoring-your-greatest-source-of-saving/. Manjoo, Farhad (2008). Why Chris Anderson’s “Long Tail” Theory Might Be All Wrong. Slate, July 14, 2008. Available at: http://www.slate.com/articles/technology/technology/2008/07/ long_tails_and_big_heads.html. Narula, Avinash (2005). 80/20 Rule of Communicating Your Ideas Effectively. New Delhi: Management Talk. Office of Management and Budget (OMB). Improving Acquisition Through Strategic Sourcing. December 5, 2012. Available at http://www.whitehouse.gov/sites/default/files/omb/ memoranda/2013/m-13-02_0.pdf. Orlowski, Andrew (2008). Chopping the Long Tail Down to Size: Wired’s Advice Could Seriously Damage Your Business. The Register, November 7, 2008. Available at: http://www.theregister.co.uk/2008/11/07/long_tail_debunked/. Opera Solutions (2011). Procurement Optimisation: Realising Savings for Local UK Governments—A White Paper from Opera Solutions. Available at: http://www.badscience.net/ wp-content/uploads/Opera-gov-savings-local-gov.pdf Pathak, Satyen and Rajeev Menon (2008). Squeezing the Last Drop—Managing Tail-End Spend. Inside Sourcing, November 2008. Available at: http://www.sig.org/i4a/pages/index. cfm?pageid=4311.
- 36. 35 Controlling Federal Spending by Managing the Long Tail of Procurement www.businessofgovernment.org PROACTIS (2013). Seven Ways to Control Costs by Reining in “Tail Spend.” March 18, 2013. Available at: http://proactisblog.blogspot.com/2013/03/seven-ways-to-control-costs-by- reining.html. PROACTIS (2012). White Paper: Tail-Spend Management: How to Squeeze Savings from the Most Fragmented 20% of Spend. Available at: http://www.kineticis.com.au/what-is-tail-spend/ (registration required). Purchasing Practice. Don’t Let the Tail Wag the Dog: Procurement Must Get Control of the Long Tail of Spend to Avoid the Loss of Value This Distraction Can Impose on the Strategic End of Spend Management. Summer 2012. Available at: http://purchasingpractice.com/dont- let-the-tail-wag-the-dog/. Ramachandran, C.V. and Theresa Lawless (2003). Tackling the “Tail End.” Supply & Demand Chain Executive, May 19, 2003. Available at: http://www.sdcexec.com/article/10290004/ tackling-the-tail-end. Raja, Ramachander and Matthew Bardell (2011). Understanding Tail-Spend Management: A White Paper for the Sourcing Interests Group. Available at: http://www.sig.org/i4a/pages/index. cfm?pageid=5823 (registration required). Stegenga, Wouter (2011). C-Parts Management—How to Manage the Tail End Spend. Elemica, July 19, 2011. Available at: http://www.elemica.com/procurement/c-parts- management-how-to-manage-the-tail-end-spend/. Shake Business Solutions (2012). Tail Spend Management—A White Paper from Shake Business Solutions. November 2012. Available at: http://www.shakesolutions.com/tail-spend- management/. Weigelt, Matthew (2012). Procurement: Contracting’s Seismic Shift? FCW.com, December 11, 2012. Available at: http://fcw.com/Articles/2012/12/11/strategic-sourcing.aspx?Page=1. Weyn, Ted (2012). Indirect Procurement—Opportunity for the Taking … Real Results, Real Fast. Inside Sourcing, May 2012. Available at: http://www.sig.org/i4a/pages/index. cfm?pageid=6642. The White House (2011). Executive Order 13589—Promoting Efficient Spending. Issued November 2011. Available at: http://www.whitehouse.gov/the-press-office/2011/11/09/ executive-order-promoting-efficient-spending. Woodcock, Simon (2012). Heads or Tails?: The Relative Benefits of Targeting Tail-end Spend—A White Paper from Xchanging. Available at: http://www.xchanging.com/what-we-do/ procurement/media (registration required).
- 37. 36 Controlling Federal Spending by Managing the Long Tail of Procurement IBM Center for The Business of Government About the Author David C. Wyld currently serves as the C.E. Laborde Professor of Management at Southeastern Louisiana University in Hammond, Louisiana. He is the Director of the College of Business’ Strategic e-Commerce/e-Government Initiative, the Founding Editor of the International Journal of Managing Information Technology, and a frequent contributor to both academic jour- nals and trade publications. He has established himself as one of the leading academic experts on emerging applications of technology in both the public and private sector. He has been an active consultant, a qualified expert witness, and an invited speaker on the strategic management of technology to both trade and academic audiences, as well as an invited panelist on technology issues on The Discovery Channel, Federal News Radio, and other media outlets. He presently serves as the Executive Director of the Reverse Auction Research Center (http://www.reverseauctionresearch. org/), which serves as a hub of research and news in the expanding world of competitive bidding. In recognition of his research accomplishments, Dr. Wyld has been awarded Southeastern Louisiana University’s President’s Award for Excellence in Research and been named a Rising Star in Government Information Technology by Federal Computer Week magazine. Dr. Wyld and his family reside just outside New Orleans in Hammond, Louisiana.
- 38. 37 Controlling Federal Spending by Managing the Long Tail of Procurement www.businessofgovernment.org To contact the author: David C. Wyld Southeastern Louisiana University C.E. Laborde Professor of Management Department of Management and Business Administration SLU—Box 10350 Hammond, LA 70402-0350 (985) 549-3079 Cell: (985) 789-2127 Fax: (985) 549-2019 e-mail: dwyld@selu.edu LinkedIn: http://www.linkedin.com/pub/david-wyld/7/370/492 Facebook: https://www.facebook.com/david.wyld Twitter: https://twitter.com/WyldTop10 Reverse Auction Research Center: http://www.reverseauctionresearch.org/ Key Contact Information