Download to read offline
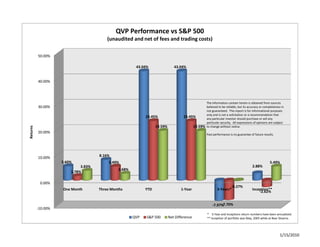

The document compares the performance of the QVP portfolio to the S&P 500 index over various time periods from one month to since inception in May 2005. It shows that the QVP portfolio outperformed the S&P 500 for all periods except the past month and since inception, with returns as high as 43.04% for the past three months compared to 23.45% for the S&P 500.


