Download to read offline


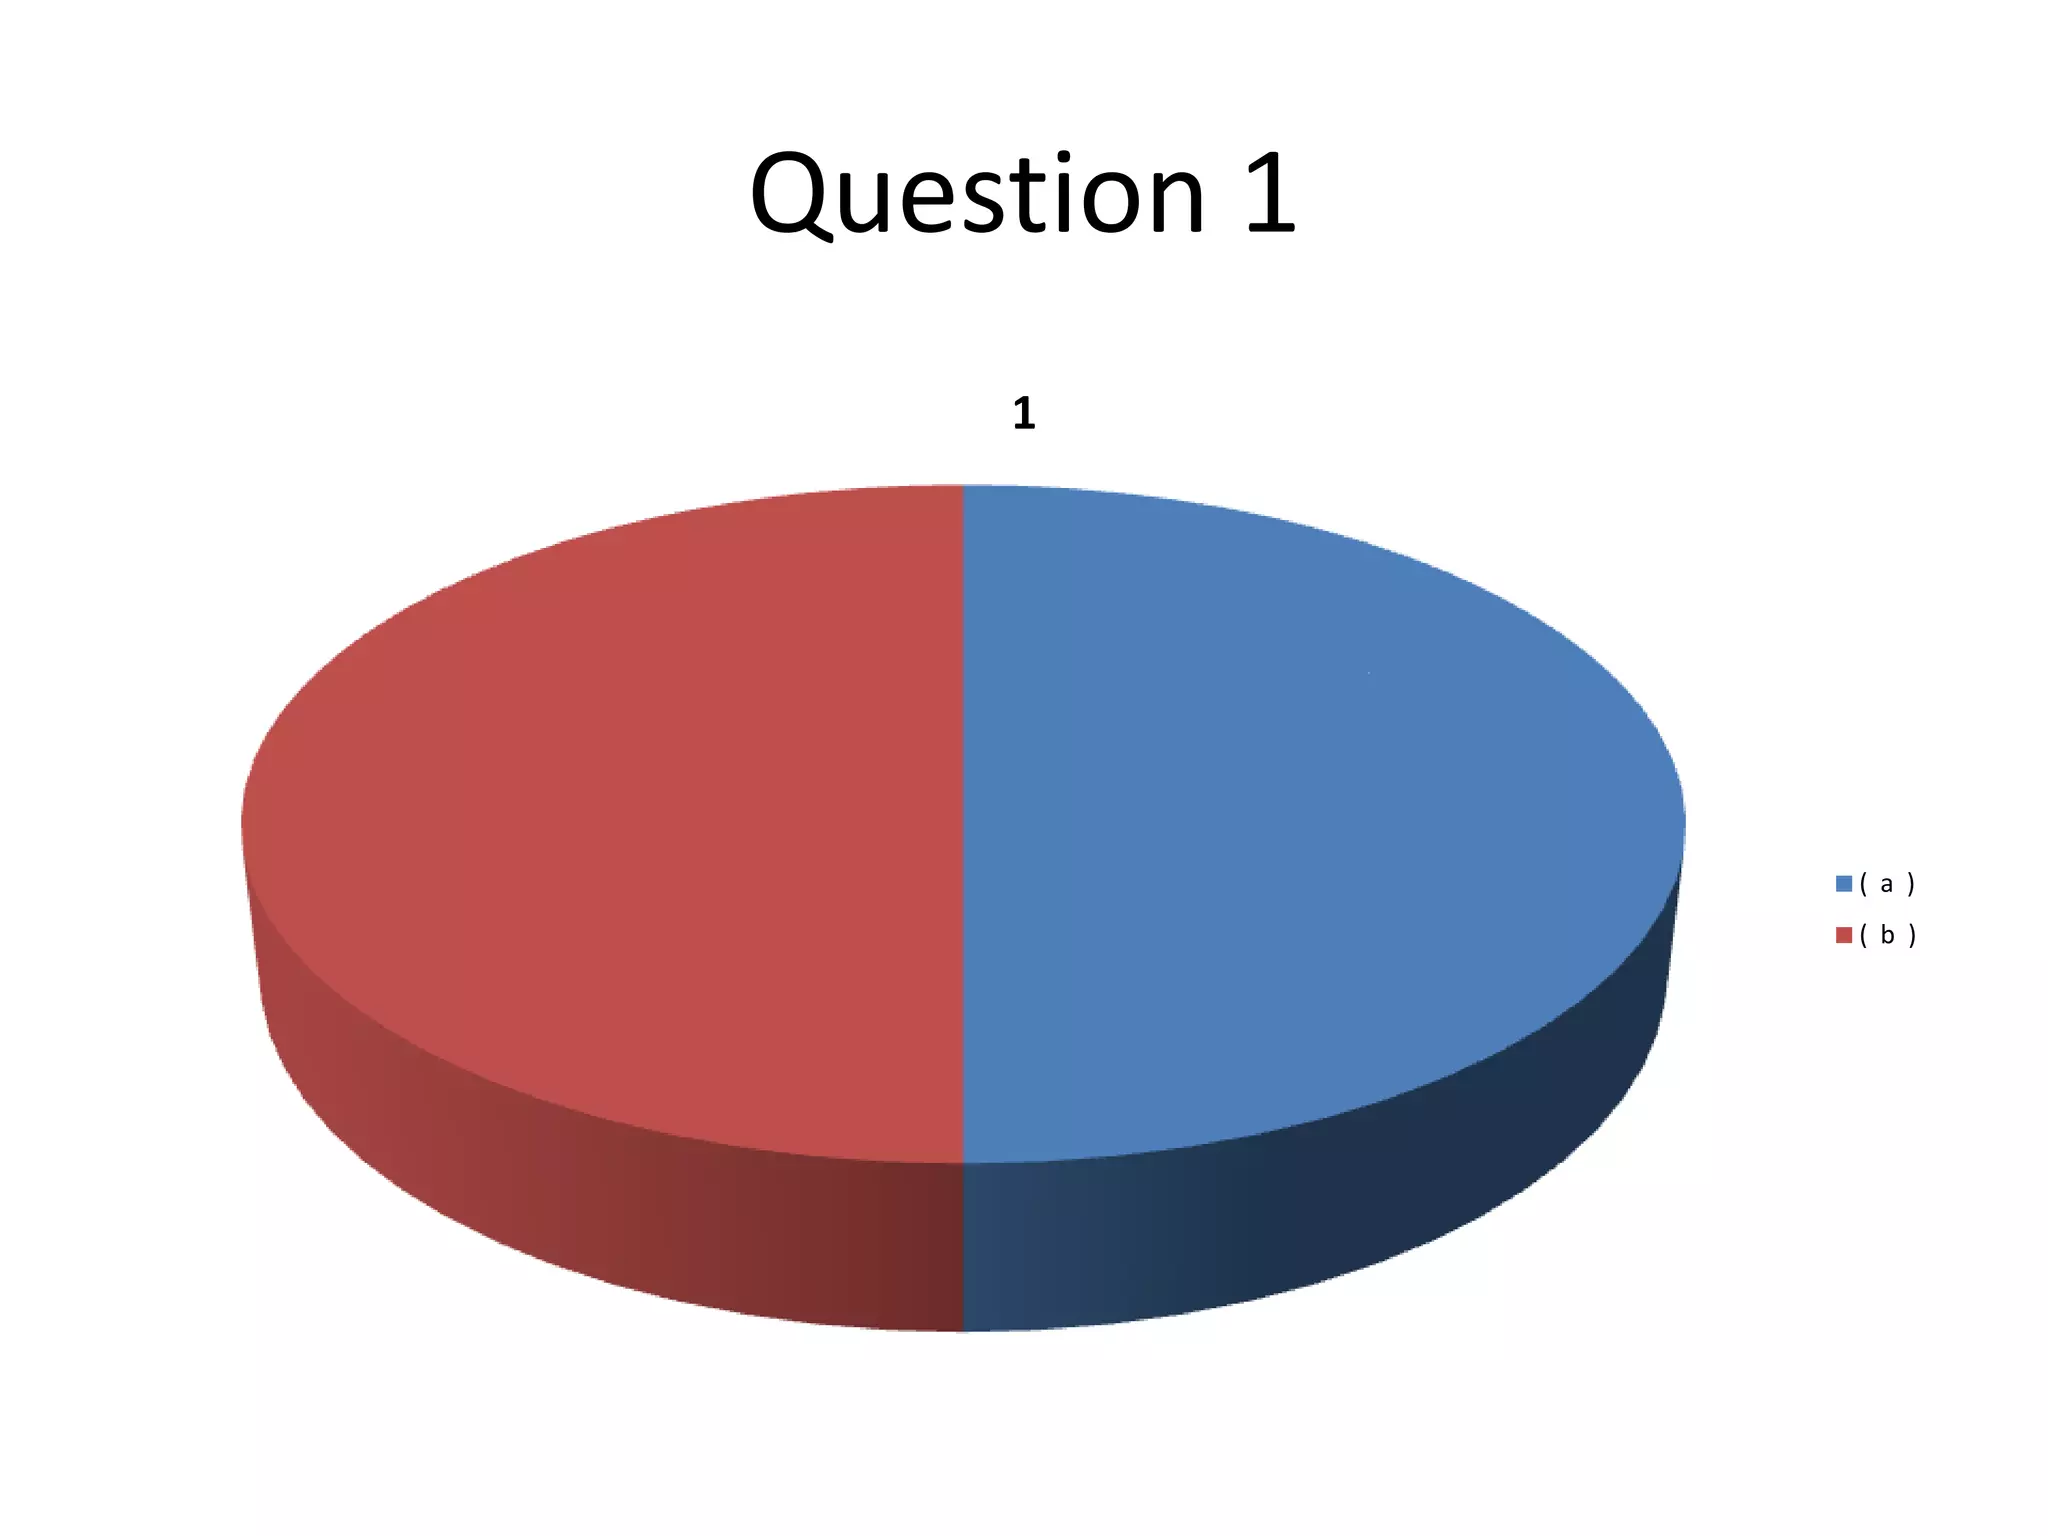

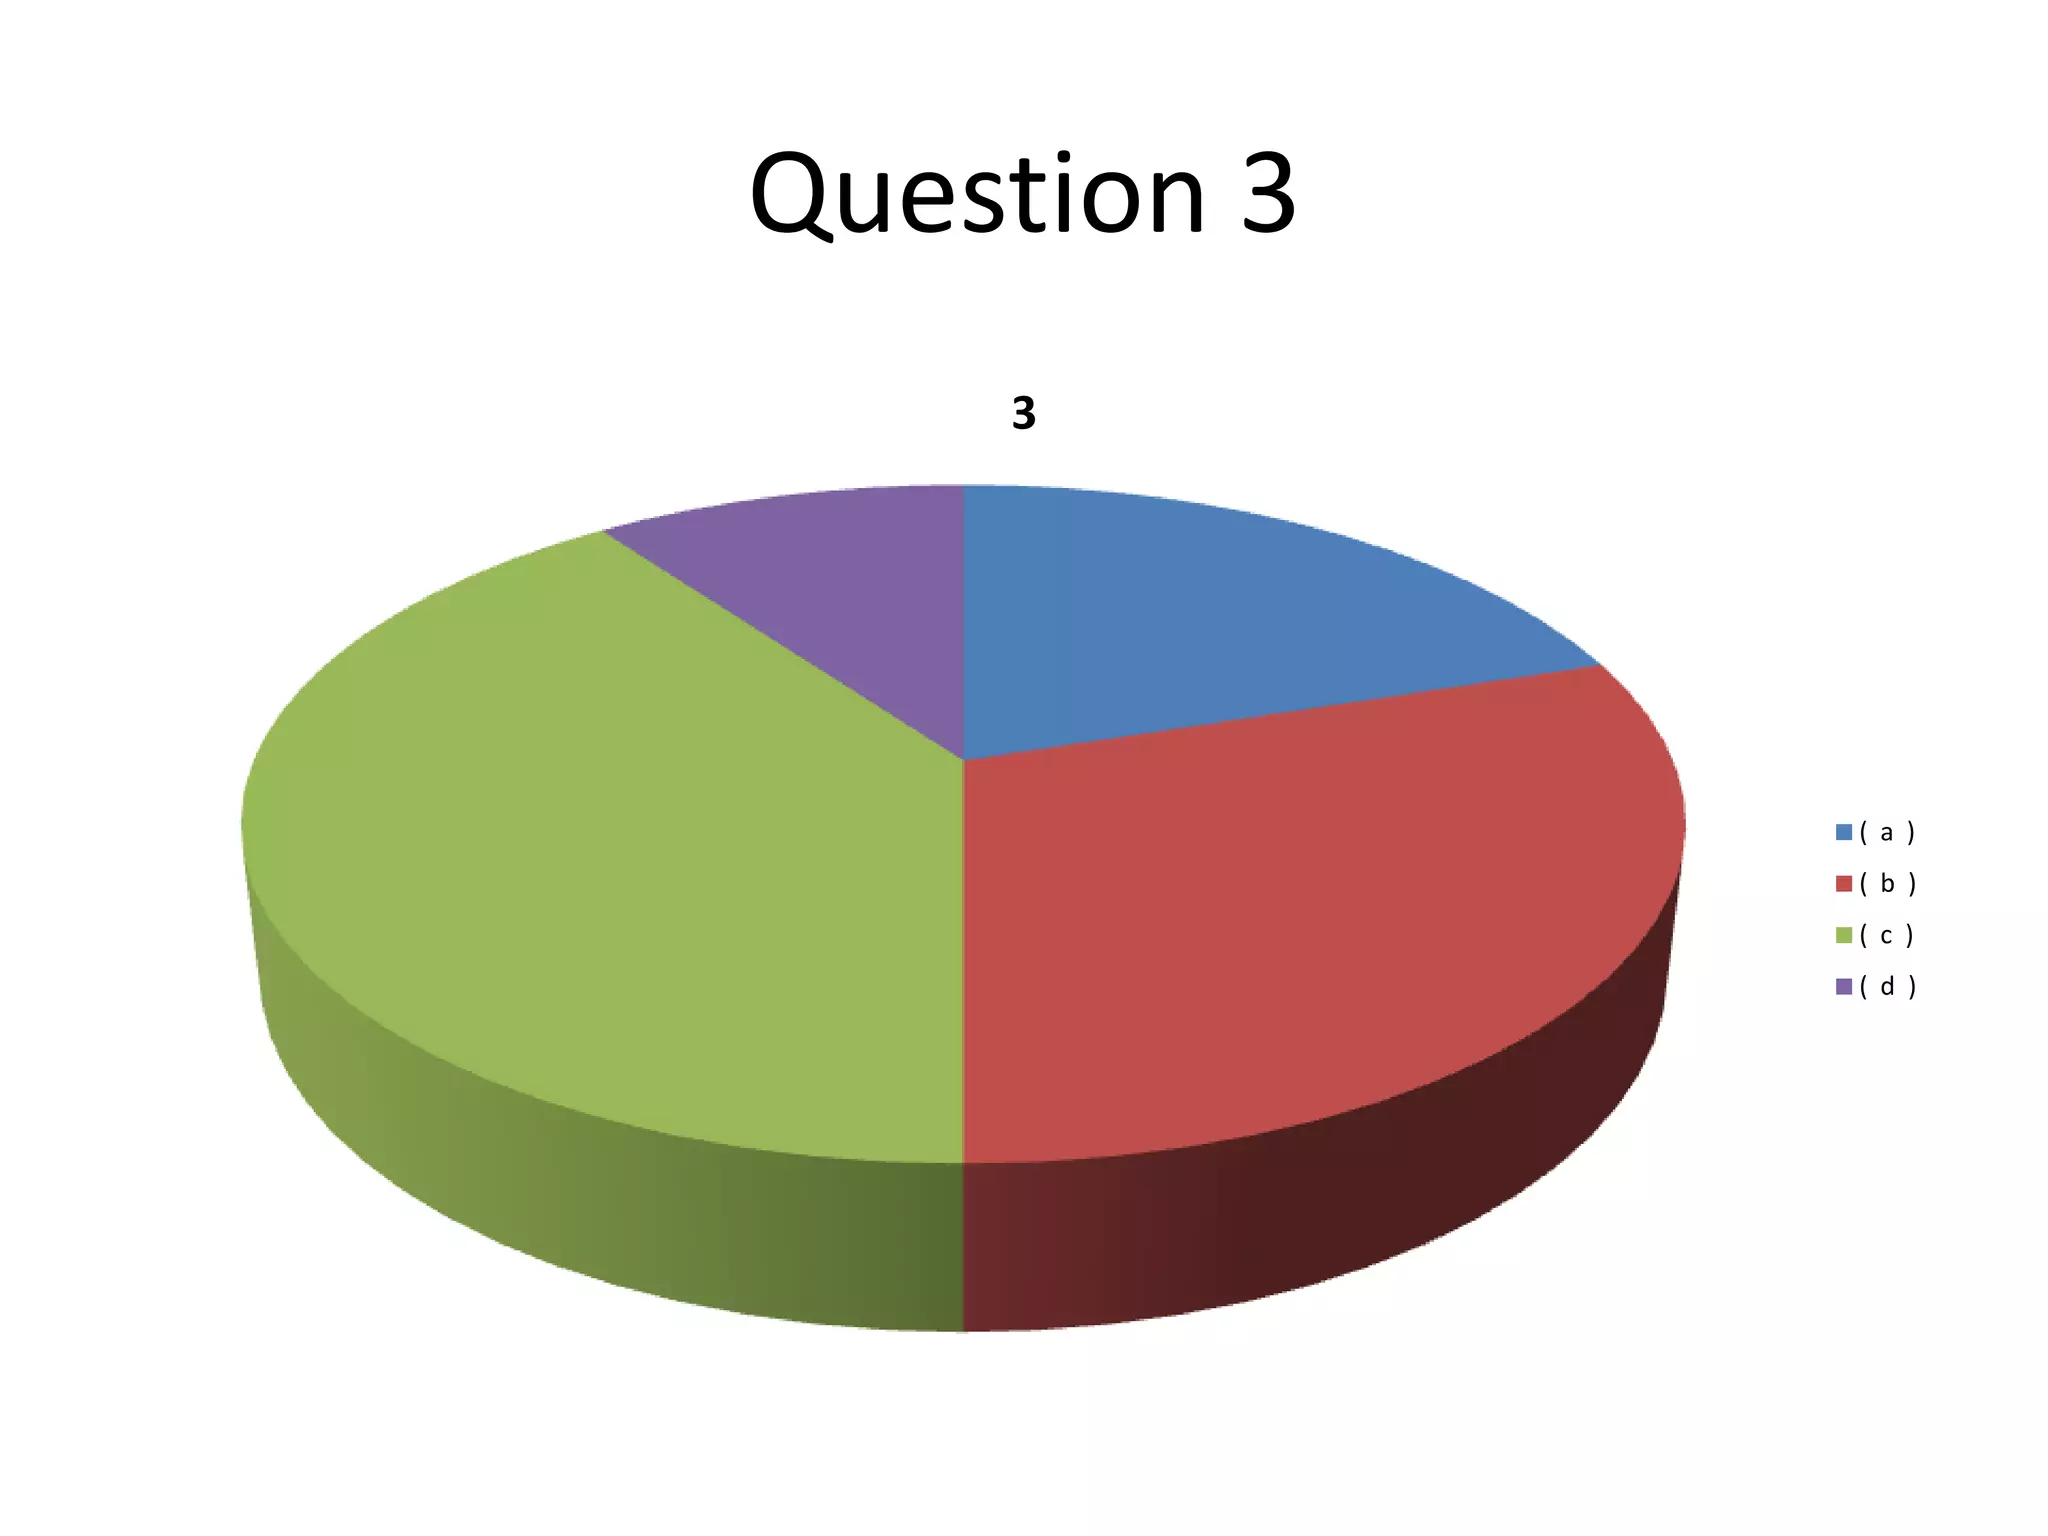
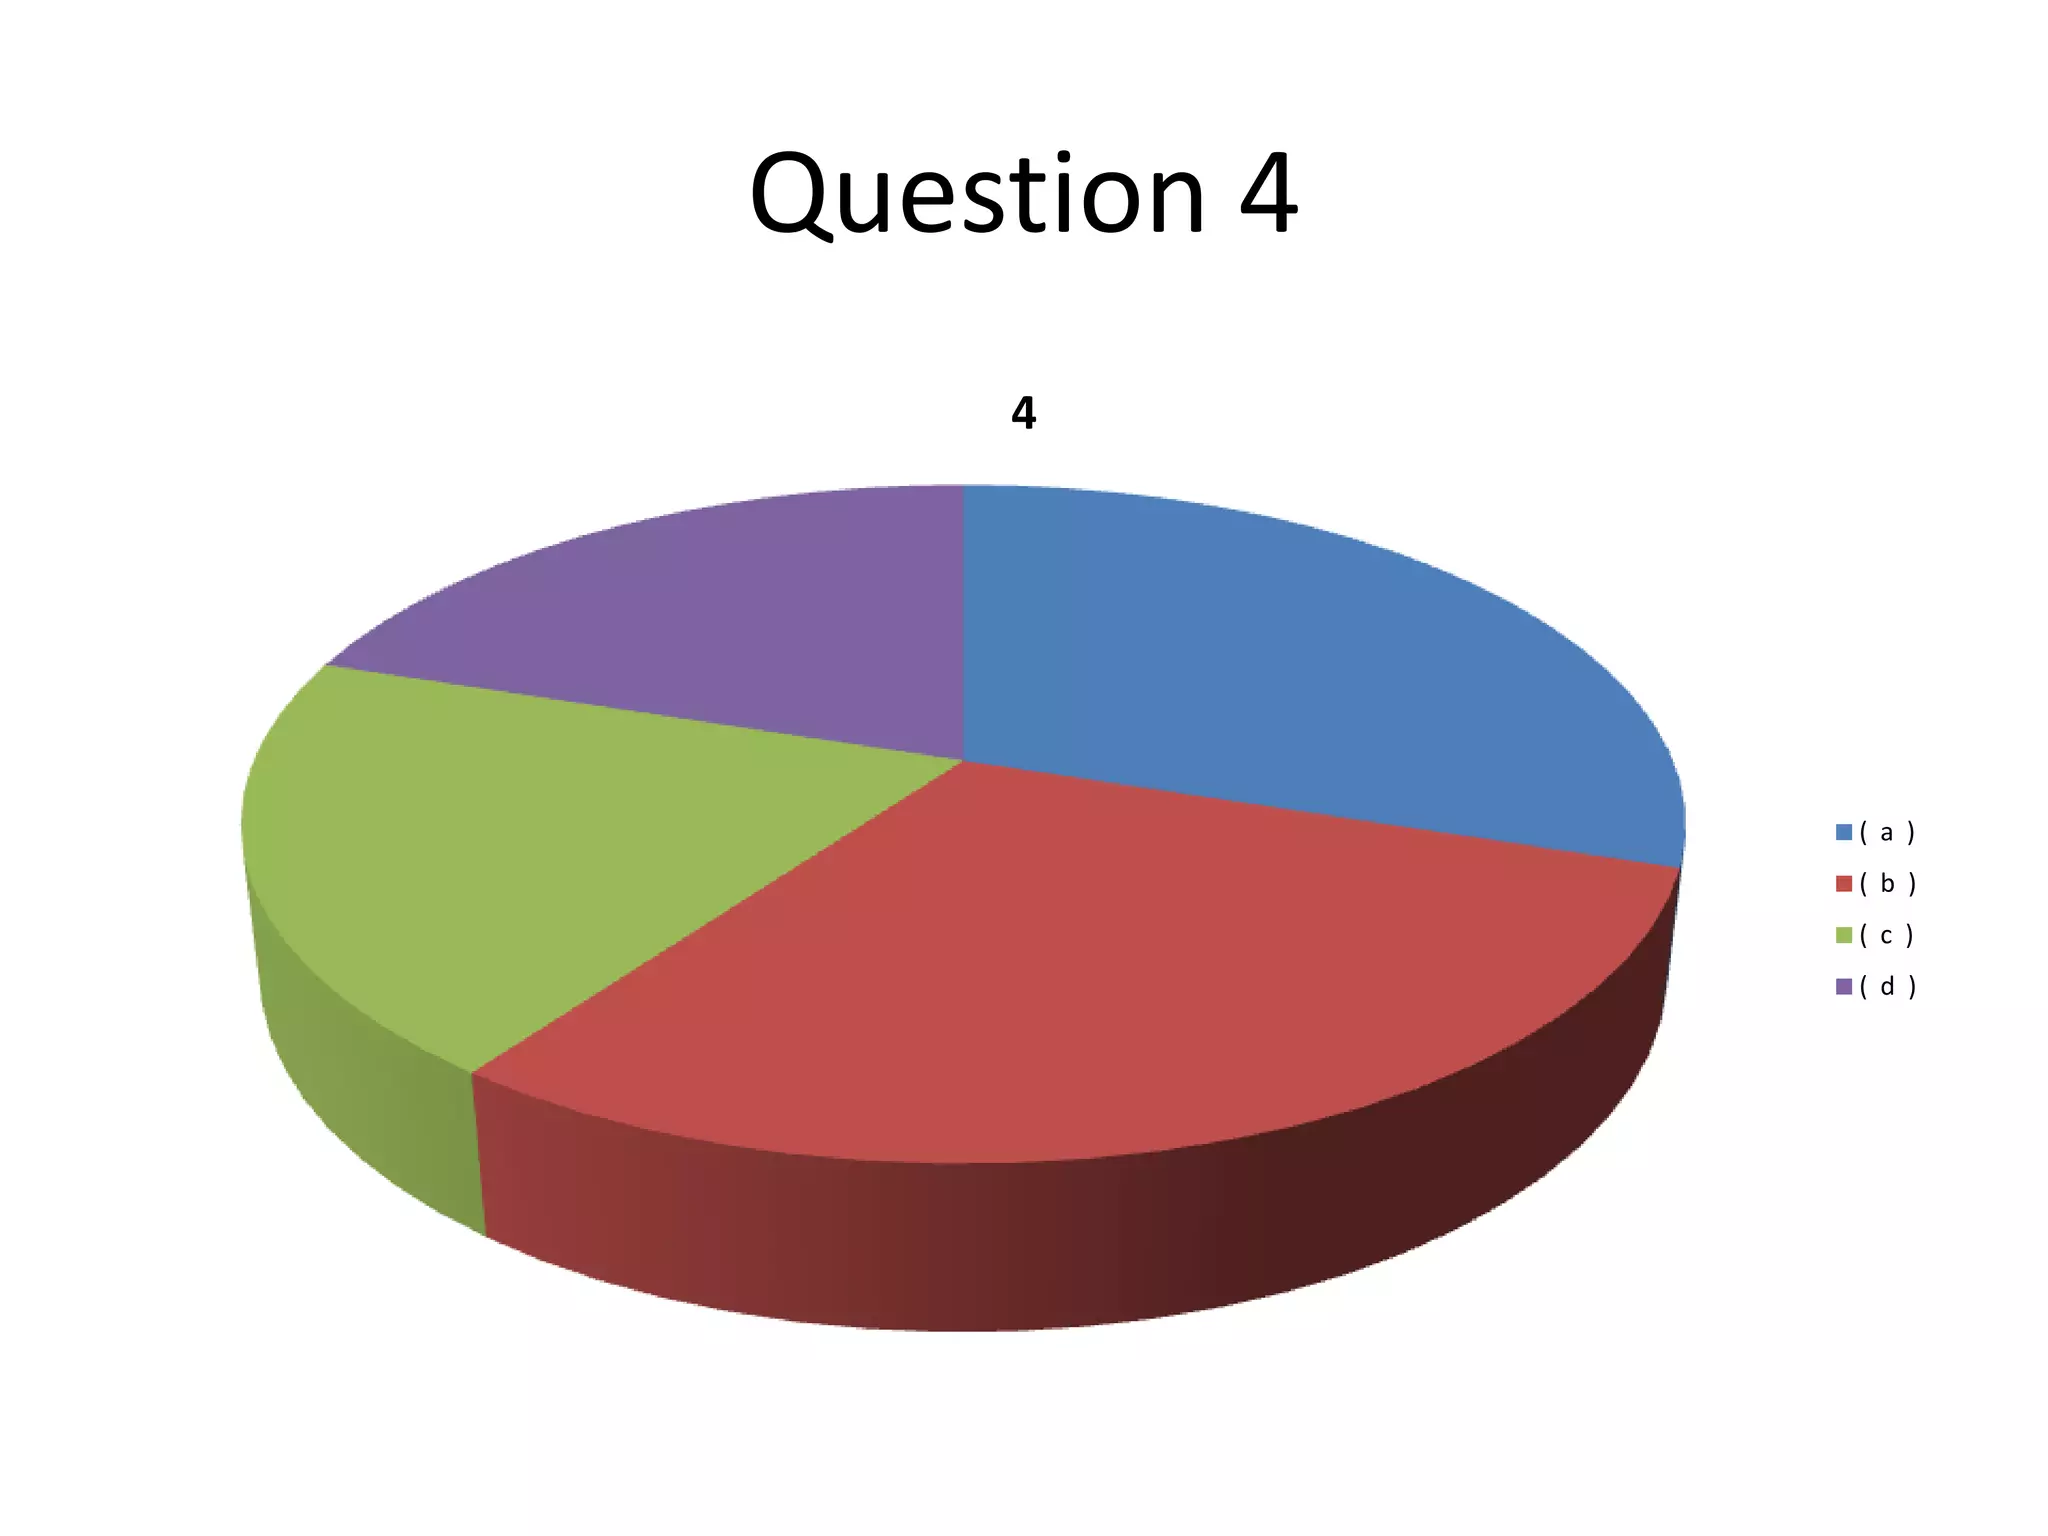

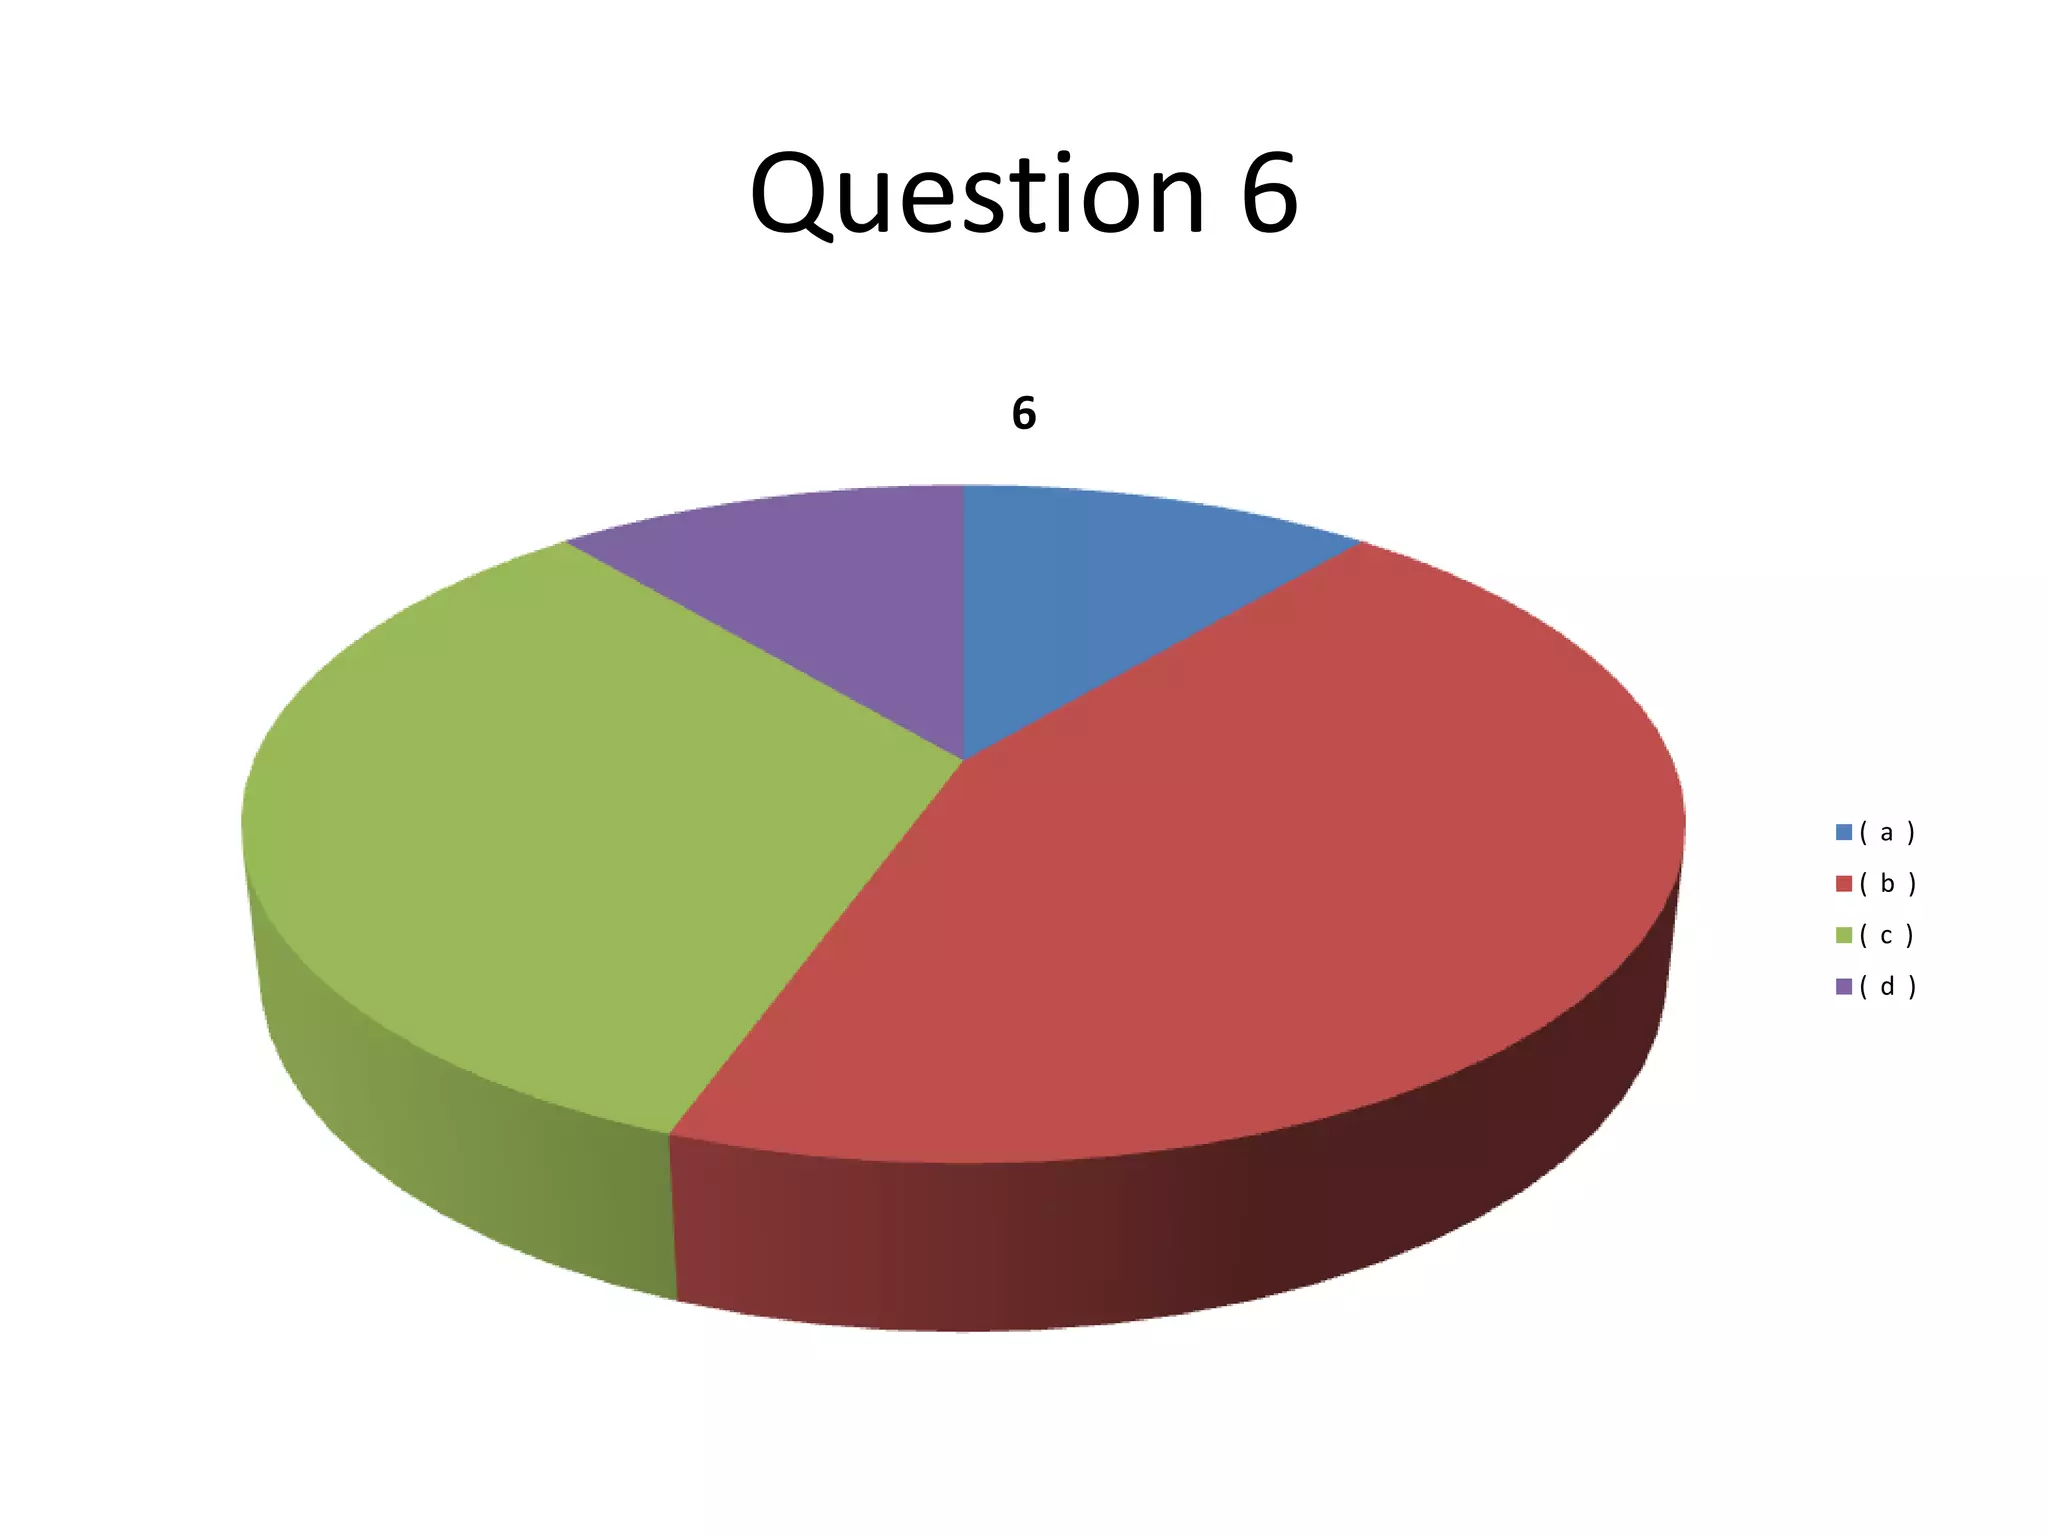

I analyzed 10 responses to my questionnaire by turning the closed question answers into pie charts to evaluate the proportion of similar responses for each question. This allowed me to visually see what percentages of people chose the same answers across my 7 questions.


