QNBFS Weekly Market Report May 26, 2016
•
0 likes•233 views

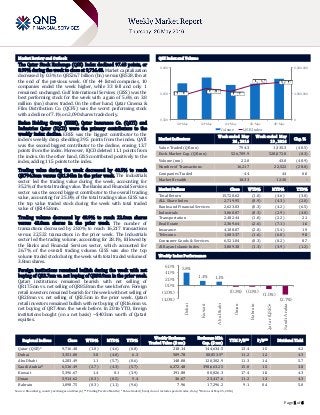
The Qatar Stock Exchange (QSE) Index declined 97.48 points, or 0.99% during the week to close at 9,716.48.

Recommended
More Related Content
More from QNB Group
More from QNB Group (20)
Recently uploaded
Recently uploaded (20)
QNBFS Weekly Market Report May 26, 2016
- 1. ` Page 1 of 6 Market Review and Outlook QSE Index and Volume The Qatar Stock Exchange (QSE) Index declined 97.48 points, or 0.99% during the week to close at 9,716.48. Market capitalization decreased by 0.3% to QR526.7 billion (bn) versus QR528.1bn at the end of the previous week. Of the 44 listed companies, 10 companies ended the week higher, while 33 fell and only 1 remained unchanged. Gulf International Services (GISS) was the best performing stock for the week with a gain of 5.6% on 3.8 million (mn) shares traded. On the other hand, Qatar Cinema & Film Distribution Co. (QCFS) was the worst performing stock with a decline of 7.1% on 2,090 shares traded only. Ezdan Holding Group (ERES), Qatar Insurance Co. (QATI) and Industries Qatar (IQCD) were the primary contributors to the weekly index decline. ERES was the biggest contributor to the index’s weekly drop, shedding 39.5 points from the index. QATI was the second biggest contributor to the decline, erasing 13.7 points from the index. Moreover, IQCD deleted 11.1 points from the index. On the other hand, GISS contributed positively to the index, adding 11.5 points to the index. Trading value during the week decreased by 40.5% to reach QR794.3mn versus QR1.34bn in the prior week. The Industrials sector led the trading value during the week, accounting for 35.2% of the total trading value. The Banks and Financial Services sector was the second biggest contributor to the overall trading value, accounting for 25.8% of the total trading value. GISS was the top value traded stock during the week with total traded value of QR145.8mn. Trading volume decreased by 48.9% to reach 22.0mn shares versus 43.0mn shares in the prior week. The number of transactions decreased by 28.0% to reach 16,217 transactions versus 22,522 transactions in the prior week. The Industrials sector led the trading volume, accounting for 28.1%, followed by the Banks and Financial Services sector, which accounted for 26.7% of the overall trading volume. GISS was also the top volume traded stock during the week with total traded volume of 3.8mn shares. Foreign institutions remained bullish during the week with net buying of QR3.7mn vs. net buying of QR80.9mn in the prior week. Qatari institutions remained bearish with net selling of QR17.5mn vs. net selling of QR85.8mn the week before. Foreign retail investors remained bearish for the week with net selling of QR2.8mn vs. net selling of QR2.5mn in the prior week. Qatari retail investors remained bullish with net buying of QR16.6mn vs. net buying of QR7.4mn the week before. In 2016 YTD, foreign institutions bought (on a net basis) ~$403mn worth of Qatari equities. Market Indicators Week ended May 26 , 2016 Week ended May 19 , 2016 Chg. % Value Traded (QR mn) 794.3 1,335.3 (40.5) Exch. Market Cap. (QR mn) 526,709.9 528,072.8 (0.3) Volume (mn) 22.0 43.0 (48.9) Number of Transactions 16,217 22,522 (28.0) Companies Traded 44 44 0.0 Market Breadth 10:33 12:30 – Market Indices Close WTD% MTD% YTD% Total Return 15,720.62 (1.0) (4.6) (3.0) ALL Share Index 2,719.95 (0.9) (4.3) (2.0) Banks and Financial Services 2,623.83 (0.3) (4.2) (6.5) Industrials 3,060.07 (0.3) (2.9) (4.0) Transportation 2,482.44 (1.0) (2.2) 2.1 Real Estate 2,369.64 (2.6) (7.1) 1.6 Insurance 4,108.87 (2.0) (5.4) 1.9 Telecoms 1,083.37 (1.6) (6.8) 9.8 Consumer Goods & Services 6,521.04 (0.3) (0.2) 8.7 Al Rayan Islamic Index 3,809.38 (1.3) (3.9) (1.2) Market Indices Weekly Index Performance Regional Indices Close WTD% MTD% YTD% Weekly Exchange Traded Value ($ mn) Exchange Mkt. Cap. ($ mn) TTM P/E** P/B** Dividend Yield Qatar (QSE)* 9,716.48 (1.0) (4.6) (6.8) 218.14 144,634.5 13.4 1.5 4.2 Dubai 3,351.00 3.8 (4.0) 6.3 509.78 88,853.5# 11.2 1.2 4.3 Abu Dhabi 4,283.49 1.1 (5.7) (0.6) 148.08 120,302.9 11.3 1.4 5.7 Saudi Arabia# 6,516.49 (2.7) (4.3) (5.7) 6,272.48 398,663.25 15.0 1.5 3.8 Kuwait 5,396.67 1.4 0.1 (3.9) 191.88 80,826.3 17.4 1.0 4.3 Oman 5,914.62 (0.3) (0.5) 9.4 36.67 23,417.6 11.2 1.3 4.3 Bahrain 1,098.75 (0.3) (1.1) (9.6) 7.96 17,296.2 9.1 0.4 5.0 Source: Bloomberg, country exchanges and Zawya (** Trailing Twelve Months; * Value traded ($ mn) do not include special trades, if any; #Data as of May 25, 2016) 9,638.26 9,681.54 9,664.85 9,705.74 9,716.48 0 3,000,000 6,000,000 9,500 9,650 9,800 22-May 23-May 24-May 25-May 26-May Volume QSE Index 3.8% 1.4% 1.1% (0.3%) (0.3%) (1.0%) (2.7%)(4.0%) (2.0%) 0.0% 2.0% 4.0% 6.0% Dubai Kuwait AbuDhabi Oman Bahrain Qatar(QSE)* SaudiArabia
- 2. Page 2 of 6 News Economic Corporate News QCB likely to keep policy rate at 4.5% for most of 2016 – BMI Research, Country Risk Analyst (MENA), Olivier Najar said that the Qatar Central Bank (QCB) is expected to maintain its policy rate at 4.5% for most of 2016 to support lending amid slowing down of economic growth. Najar said, “Facing increasing pressures on the riyal, the QCB will nevertheless hike rates by 25 basis points before the end of the year to converge with rising US rates. But the rapidity at which it does so will depend on the pace of the US Federal Reserve’s (rate) hiking.” BMI Research, a Fitch Group company, expects QCB to continue delaying its convergence with the Fed’s hiking cycle for most of 2016 to support lending amid a slowdown in economic growth. (Gulf- Times.com) BMI: Qatar fuel price hike ‘positive’ on fiscal consolidation needs – BMI Research, Country Risk Analyst (MENA) Olivier Najar indicated that the Qatari government’s increase of petrol prices is a “positive” move, given the need for fiscal consolidation as revenues have “fallen sharply” alongside hydrocarbon prices. He said, “Despite the hike, fuel and gasoline prices in Qatar remain among the lowest in the world.” Currently, the fuel price in Qatar announced by the Ministry of Energy and Industry is as follows: gasoline (super 97) QR1.30/liter, gasoline (premium 90) QR1.15, and diesel QR1.40. In January, Qatar Fuel Company (QFLS) had announced a revision in fuel prices, the first one in five years. Despite the recent revision, fuel prices in Qatar are still among the most affordable in the world. (Gulf-Times.com) Moody’s: Robust growth, high wealth levels support credit profile of Qatar – According to Moody’s, Qatar’s credit profile is supported by robust growth, extraordinary high wealth levels, and strong buffers, but its debt levels are comparatively high and reform plans present implementation risks. Despite the “negative” effect of a protracted period of low oil prices, Qatar’s overall credit profile remains consistent with ‘Aa2’ rating on expected continued strong growth, extraordinarily high wealth levels, low vulnerability to oil price shock and a fiscal policy that would shield sizable buffers, Moody’s said in a report. Highlighting that Qatar’s strong growth would be driven by continued large infrastructure investments, ahead of the 2022 FIFA World Cup, it said, “we forecast average annual real GDP growth of 3.6% for 2016-2020, reflecting zero growth in oil and gas production from 2017, as well as a decline in real growth in the non-oil sectors over the forecast horizon, averaging 6.7% in 2016-2020, down from 10.1% during 2011-2015.” (Gulf-Times.com) MEED: Qatar accounts for 8.57% of total value of planned GCC projects – MEED said in a report that the Qatar accounts for 8.57% of the total value of the projects planned in the GCC (as of May), which amounted to $2tn. At the MEED Construction Leadership Summit in Dubai, professional services firm Deloitte said Saudi Arabia led the region in terms of the value of projects in the pre- execution stage, with 38.9% of the total value, followed by the UAE with 34.8%. Kuwait follows Qatar with 8.22%. Oman accounted for 6.48% and Bahrain 2.97% share of the market. (Gulf-Times.com) Addition of QATI right issue shares to shareholders’ accounts – Qatar Central Securities Depository Company (QCSD) announces that the new subscribed shares of the Qatar Insurance Company (QATI) have been deposited into the investors’ accounts, the new capital is QR2.411.386.590 and the new total shares is (241.138.659). The new subscribed shares will be available for trading starting from May 26, 2016. (QSE) CEO: QFLS to deploy 20 more mobile petrol stations – Qatar Fuel Company (QFLS) CEO Ibrahim Jaham al-Kuwari announced that the company will soon deploy 20 additional mobile petrol stations in and around Doha to meet mounting demand from motorists. Al-Kuwari made the announcement on the sidelines of QFLS’s AGM, which was presided over by QFLS Chairman, Sheikh Saoud bin Abdulrahman bin Hassan al-Thani. Al-Kuwari said, “We have finalized with the authorities concerned certain places for the deployment of mobile petrol stations, which will be stationed at various locations in Doha. There are currently six operational mobile petrol stations and we will soon add 20 more. In addition to that, we are ordering around 30 mobile petrol stations, which we expect to receive in the next three months. They would be on standby and can be deployed as the need arises.” He added the government has already identified different locations in and around Doha, where the additional 20 mobile stations will be installed within the year. (Gulf-Times.com) UDCD plans to sell stake in Gulf Formaldehyde – The United Development Company (UDCD) announced that it intends to sell its 10% stake in the Gulf Formaldehyde Company and it will disclose any decision or agreement to be made in this regard. (QSE) DHBK to expand its foreign operations to deal with slower growth in Qatar – According to Doha Bank (DHBK) Chief Executive Officer Raghavan Seetharaman, the bank is planning to expand its foreign operations to compensate for slower growth in Qatar, due to decline in oil prices which caused liquidity to dry up. (Bloomberg, Gulf-Times.com) S&P Affirms Industries Qatar 'AA-' Rating – S&P Global Ratings today affirmed its 'AA-' long-term corporate credit rating on Qatari-based commodity chemicals and steel producer Industries Qatar (IQCD). The outlook is stable. (Bloomberg) QFBQ in deal with JLL to guide Qatar, Gulf investors on UK and Europe real estate – Qatar First Bank (QFBQ) signed pact with the UK’s largest property adviser, JLL, in view of the increasing demand for real estate investment in the UK and Europe from investors in Qatar and the wider Gulf Cooperation Council region. The agreement provides specialized real estate services to individuals and corporate enterprises seeking to add value to their portfolios by owning, occupying and investing in real estate across the world. The deal with JLL, a Fortune 500 company, would also offer shareholders and clients the ability to source real estate opportunities globally based on their specific requirements and budget. (Gulf-Times.com) ORDS gets Cisco cloud and managed services certification – Ooredoo (ORDS) announced that it has been awarded the Cisco Cloud and Managed Services Program (CMSP) certification after successfully completing a stringent audit. The program is a comprehensive framework designed to recognize partners that offer cloud, managed, or virtual managed services based on Cisco technologies. ORDS offers some of the most advanced cloud services for businesses in the region and the certification will give customers renewed confidence in its ability to develop and deploy original solutions for organizations and enterprises. Meanwhile, ORDS has mandated banks for a forthcoming US dollar bond. ORDS has picked a number of banks including ANZ, Bank of America Merrill Lynch, Citigroup, and HSBC. ORDS is seeking to raise $750mn-$1bn through the transaction. ORDS was in talks with banks to raise over $1.5bn through bonds and loans in 2016. The company, which operates in about a dozen territories across the Middle East, Africa and Asia, is planning to refinance a $1bn revolver that matures in March 2017. ORDS is rated ‘A2’ by Moody’s, ‘A-’ by Standard & Poor’s and ‘A+’ by Fitch. (Gulf- Times.com)
- 3. Page 3 of 6 Qatar Stock Exchange Top Gainers Top Decliners Source: Qatar Stock Exchange (QSE) Source: Qatar Stock Exchange (QSE) Most Active Shares by Value (QR Million) Most Active Shares by Volume (Million) Source: Qatar Stock Exchange (QSE) Source: Qatar Stock Exchange (QSE) Investor Trading Percentage to Total Value Traded Net Traded Value by Nationality (QR Million) Source: Qatar Stock Exchange (QSE) Source: Qatar Stock Exchange (QSE) 5.6% 2.1% 2.0% 1.1% 0.8% 0.0% 2.5% 5.0% 7.5% Gulf International Services Qatar General Insurance & Reinsurance Medicare Group Mannai Corp. Qatar International Islamic Bank -7.1% -4.9% -4.9% -2.9% -2.9% -10.5% -7.0% -3.5% 0.0% Qatar Cinema & Film Distribution Dlala Holding National Leasing Ezdan Real Estate Gulf Warehousing 145.8 68.9 60.5 56.7 39.1 0.0 60.0 120.0 180.0 Gulf International Services Ooredoo QNB Group Industries Qatar Masraf Al Rayan 3.8 2.2 1.9 1.5 1.2 0.0 1.5 3.0 4.5 Gulf International Services Ezdan Real Estate Qatar First Bank Vodafone Qatar Masraf Al Rayan 0% 20% 40% 60% 80% 100% Buy Sell 47.53% 45.44% 15.12% 17.32% 13.76% 14.11% 23.59% 23.13% Qatari Individuals Qatari Institutions Non-Qatari Individuals Non-Qatari Institutions 498 297 498 296 (1) 1 (100) - 100 200 300 400 500 600 Qatari Non-Qatari Net Investment Total Sold Total Bought
- 4. Page 4 of 6 TECHNICAL ANALYSIS OF THE QSE INDEX Source: Bloomberg The QSE Index closed down by 0.99% at 9,71648 vs the week; this move puts the Index back in the bearish path. As we have mentioned last week, the Index will probably test the 9,700 immediate-support level. The MACD has been moving below the zero line and curving down again and hence the bearish sentiment. The expected resistance level remains at 10,500 points and the support at 9,500 points. DEFINITIONS OF KEY TERMS USED IN TECHNICAL ANALYSIS RSI (Relative Strength Index) indicator – RSI is a momentum oscillator that measures the speed and change of price movements. The RSI oscillates between 0 to 100. The index is deemed to be overbought once the RSI approaches the 70 level, indicating that a correction is likely. On the other hand, if the RSI approaches 30, it is an indication that the index may be getting oversold and therefore likely to bounce back. MACD (Moving Average Convergence Divergence) indicator – The indicator consists of the MACD line and a signal line. The divergence or the convergence of the MACD line with the signal line indicates the strength in the momentum during the uptrend or downtrend, as the case may be. When the MACD crosses the signal line from below and trades above it, it gives a positive indication. The reverse is the situation for a bearish trend. Candlestick chart – A candlestick chart is a price chart that displays the high, low, open, and close for a security. The ‘body’ of the chart is portion between the open and close price, while the high and low intraday movements form the ‘shadow’. The candlestick may represent any time frame. We use a one-day candlestick chart (every candlestick represents one trading day) in our analysis. Doji candlestick pattern – A Doji candlestick is formed when a security's open and close are practically equal. The pattern indicates indecisiveness, and based on preceding price actions and future confirmation, may indicate a bullish or bearish trend reversal. Shooting Star/Inverted Hammer candlestick patterns – These candlestick patterns have a small real body (open price and close price are near to each other), and a long upper shadow (large intraday movement on the upside). The Shooting Star is a bearish reversal pattern that forms after a rally. The Inverted Hammer looks exactly like a Shooting Star, but forms after a downtrend. Inverted Hammers represent a potential bullish trend reversal.
- 5. Page 5 of 6 Source: Bloomberg Company Name Price (May 26) % Change WTD % Change YTD Market Cap. QR Million TTM P/E P/B Div. Yield Qatar National Bank 136.00 (0.07) (6.74) 114,196 10.0 1.9 2.6 Qatar Islamic Bank 94.70 (0.32) (11.25) 22,377 11.0 1.5 4.5 Commercial Bank of Qatar 37.10 (0.27) (19.17) 12,118 11.3 0.9 8.1 Doha Bank 35.85 0.70 (19.44) 9,263 7.8 1.1 8.4 Al Ahli Bank 42.30 (0.47) (3.55) 8,071 12.6 1.8 3.5 Qatar International Islamic Bank 61.50 0.82 (4.35) 9,309 11.7 1.8 6.5 Masraf Al Rayan 33.05 (0.45) (12.10) 24,788 11.8 2.2 5.3 Al Khalij Commercial Bank 16.50 (2.08) (8.18) 5,940 9.3 0.9 6.1 Qatar First Bank 12.10 (1.63) N/A 2,420 N/A N/A N/A National Leasing 16.90 (4.90) 19.86 836 N/A 0.8 3.0 Dlala Holding 21.66 (4.92) 17.14 615 N/A 1.8 N/A Qatar & Oman Investment 11.18 (0.89) (9.11) 352 19.2 1.1 5.4 Islamic Holding Group 66.00 (2.80) (16.14) 374 107.7 4.6 2.3 Banking and Financial Services 210,659 Zad Holding 86.00 (0.69) 1.42 1,125 11.7 1.3 4.7 Qatar German Co. for Medical Devices 11.95 (2.13) (12.90) 138 N/A 1.4 N/A Salam International Investment 11.12 (0.27) (5.92) 1,271 11.0 0.7 9.0 Medicare Group 104.00 1.96 (12.82) 2,927 20.2 3.0 1.7 Qatar Cinema & Film Distribution 35.00 (7.14) (4.41) 204 15.2 1.6 4.6 Qatar Fuel 154.00 0.00 12.76 14,047 11.2 2.2 4.9 Widam Food Co. 58.80 0.34 11.36 1,058 13.6 3.7 4.6 Al Meera Consumer Goods 207.50 (2.81) (5.68) 4,150 25.1 3.3 4.3 Consumer Goods and Services 24,921 Qatar Industrial Manufacturing 40.00 (0.99) 0.38 1,901 10.3 1.4 7.5 Qatar National Cement 87.20 0.35 (5.96) 5,181 11.2 1.7 4.2 Industries Qatar 98.00 (1.11) (11.79) 59,290 14.2 1.9 5.1 Qatari Investors Group 49.80 (2.35) 32.10 6,191 23.5 2.6 2.5 Qatar Electricity and Water 204.80 (0.44) (5.36) 22,528 15.0 3.3 3.7 Mannai Corp. 90.00 1.12 (5.56) 4,106 8.3 1.8 5.6 Aamal 13.16 (1.05) (5.93) 8,291 13.1 1.1 N/A Gulf International Services 38.80 5.58 (24.66) 7,211 13.8 1.9 2.6 Mesaieed Petrochemical Holding 18.49 (0.59) (4.69) 23,229 19.5 1.7 3.8 Industrials 137,927 Qatar Insurance 75.00 (2.60) 7.87 18,278 14.9 2.8 2.8 Doha Insurance 19.31 (2.47) (8.05) 966 8.9 0.9 5.2 Qatar General Insurance & Reinsurance 48.00 2.13 3.33 4,200 4.7 0.7 2.8 Al Khaleej Takaful Insurance 24.70 (2.76) (19.02) 631 21.0 1.1 4.0 Qatar Islamic Insurance 58.40 0.69 (18.89) 876 12.3 2.9 6.8 Insurance 24,950 United Development 18.50 (1.49) (10.84) 6,551 9.5 0.6 8.1 Barw a Real Estate 31.10 (2.20) (22.25) 12,102 26.6 0.7 7.1 Ezdan Real Estate 17.04 (2.91) 7.17 45,199 25.8 1.5 2.9 Mazaya Qatar Real Estate Development 13.62 (2.37) 0.71 1,502 13.4 1.1 2.0 Real Estate 65,353 Ooredoo 85.40 (1.95) 13.87 27,355 11.0 1.2 3.5 Vodafone Qatar 11.19 (0.27) (11.89) 9,460 N/A 1.9 1.9 Telecoms 36,815 Qatar Navigation (Milaha) 86.80 (2.36) (8.63) 9,941 9.1 0.8 5.8 Gulf Warehousing 60.00 (2.91) 5.45 3,516 16.3 2.6 2.5 Qatar Gas Transport (Nakilat) 23.14 0.56 (0.90) 12,820 12.9 3.9 5.4 Transportation 26,277 Qatar Exchange 526,709
- 6. Contacts Saugata Sarkar Shahan Keushgerian Zaid al-Nafoosi , CMT, CFTe Head of Research Senior Research Analyst Senior Research Analyst Tel: (+974) 4476 6534 Tel: (+974) 4476 6509 Tel: (+974) 4476 6535 saugata.sarkar@qnbfs.com.qa shahan.keushgerian@qnbfs.com.qa zaid.alnafoosi@qnbfs.com.qa QNB Financial Services Co. WLL One Person Company Contact Center: (+974) 4476 6666 PO Box 24025 Doha, Qatar Disclaimer and Copyright Notice: This publication has been prepared by QNB Financial Services Co. WLL One Person Company (“QNBFS”) a wholly-owned subsidiary of QNB SAQ (“QNB”). QNBFS is regulated by the Qatar Financial Markets Authority and the Qatar Exchange QNB SAQ is regulated by the Qatar Central Bank. This publication expresses the views and opinions of QNBFS at a given time only. It is not an offer, promotion or recommendation to buy or sell securities or other investments, nor is it intended to constitute legal, tax, accounting, or financial advice. QNBFS accepts no liability whatsoever for any direct or indirect losses arising from use of this report. Any investment decision should depend on the individual circumstances of the investor and be based on specifically engaged investment advice. We therefore strongly advise potential investors to seek independent professional advice before making any investment decision. Although the information in this report has been obtained from sources that QNBFS believes to be reliable, we have not independently verified such information and it may not be accurate or complete. QNBFS does not make any representations or warranties as to the accuracy and completeness of the information it may contain, and declines any liability in that respect. For reports dealing with Technical Analysis, expressed opinions and/or recommendations may be different or contrary to the opinions/recommendations of QNBFS Fundamental Research as a result of depending solely on the historical technical data (price and volume). QNBFS reserves the right to amend the views and opinions expressed in this publication at any time. It may also express viewpoints or make investment decisions that differ significantly from, or even contradict, the views and opinions included in this report. This report may not be reproduced in whole or in part without permission from QNBFS COPYRIGHT: No part of this document may be reproduced without the explicit written permission of QNBFS. Page 6 of 6