QNBFS Daily Technical Trader - Qatar for November 08, 2018 التحليل الفني اليو...QNB Group
The trend has been up on the Index and seems to be intact. Corrections are possible and can be used to add positions. A solid breakout above the 10,360 would take the index to the 10,550-10,600 levels.
QNBFS Daily Technical Trader - Qatar for November 07, 2018 التحليل الفني اليو...QNB Group
The trend has been up on the Index and seems to be intact. Corrections are possible and can be used to add positions. A solid breakout above the 10,360 would take the index to the 10,550-10,600 levels.
QNBFS Daily Technical Trader - Qatar for June 04 2018 التحليل الفني اليومي لب...QNB Group
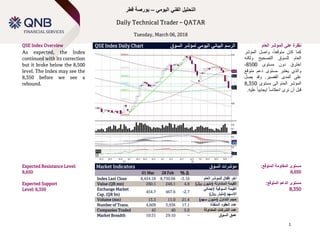
The MSCI EM Index rebalancing, which took place last Thursday, has created a strong support level at the 8,730 level (instead of the previous 8,800 level).
QNBFS Daily Technical Trader - Qatar for November 21, 2018 التحليل الفني اليو...QNB Group
The trend has been up on the Index and seems to be intact. Corrections are possible and can be used to add positions. A solid breakout above the 10,360 would take the index to the 10,550-10,600 levels.
QNBFS Daily Technical Trader - Qatar for April 08, 2018 التحليل الفني اليومي ...Aicha El-Mamy
The Index managed to breakout and remain above
the corrective channel (see chart), which is positive. As a result, we expect the Index to continue its uptick as long as it stays above the 8,500 level.
QNBFS Daily Technical Trader - Qatar for April 18, 2018 التحليل الفني اليومي ...QNB Group
The general Index closed flat and remains below the 9,000 psychological level. We remain positive on the main direction on the Index, but we prefer to see a confirmation of our outlook with a close above the above mentioned level.
QNBFS Daily Technical Trader - Qatar for November 08, 2018 التحليل الفني اليو...QNB Group
The trend has been up on the Index and seems to be intact. Corrections are possible and can be used to add positions. A solid breakout above the 10,360 would take the index to the 10,550-10,600 levels.
QNBFS Daily Technical Trader - Qatar for November 07, 2018 التحليل الفني اليو...QNB Group
The trend has been up on the Index and seems to be intact. Corrections are possible and can be used to add positions. A solid breakout above the 10,360 would take the index to the 10,550-10,600 levels.
QNBFS Daily Technical Trader - Qatar for June 04 2018 التحليل الفني اليومي لب...QNB Group
The MSCI EM Index rebalancing, which took place last Thursday, has created a strong support level at the 8,730 level (instead of the previous 8,800 level).
QNBFS Daily Technical Trader - Qatar for November 21, 2018 التحليل الفني اليو...QNB Group
The trend has been up on the Index and seems to be intact. Corrections are possible and can be used to add positions. A solid breakout above the 10,360 would take the index to the 10,550-10,600 levels.
QNBFS Daily Technical Trader - Qatar for April 08, 2018 التحليل الفني اليومي ...Aicha El-Mamy
The Index managed to breakout and remain above
the corrective channel (see chart), which is positive. As a result, we expect the Index to continue its uptick as long as it stays above the 8,500 level.
QNBFS Daily Technical Trader - Qatar for April 18, 2018 التحليل الفني اليومي ...QNB Group
The general Index closed flat and remains below the 9,000 psychological level. We remain positive on the main direction on the Index, but we prefer to see a confirmation of our outlook with a close above the above mentioned level.
QNBFS Daily Technical Trader - Qatar - September 11 2019 التحليل الفني اليومي...QNB Group
The Index started a move above its SMAS, which is a good sign and we may see the Index move to our next expected resistance between the 10,700 and the 10,800 levels.
QNBFS Daily Technical Trader - Qatar for March 05, 2018 التحليل الفني اليومي ...Aicha El-Mamy
The Index remains under corrective pressure, but we see a sign for a possible bullish recovery. It is a bullish, but weak, candlestick formation called the Harami. If the Index breaches below the 8,650, then it would be heading towards the 8,500 level.
QNBFS Daily Technical Trader - Qatar for November 14, 2018 التحليل الفني اليو...QNB Group
The QSE Index declined 1.0% to close at 10,314.6. Losses were led by the Telecoms and Industrials indices, falling 1.8% and 1.1%, respectively. Top losers were Qatar National Cement Company and Medicare Group, falling 3.3% each. Among the top gainers, Mannai Corporation gained 2.2%, while Gulf International Services was up 1.5%.
QNBFS Daily Technical Trader Qatar - April 12, 2020 التحليل الفني اليومي لبور...QNB Group
After the QE Index reached extreme levels, it has moved slightly up. At this stage, however, the Index is clearly lacking direction as the selling pressure remains a strong factor in the next expected move.
QNBFS Daily Technical Trader - Qatar for April 16, 2018 التحليل الفني اليومي ...QNB Group
The Index moved slightly down as we expected in the corrective wave. That being said, there is a potential for the Index to reach the 8,700 level, but it remains bullish. Breaking below the level could change our perspective on the Index.
QNBFS Daily Technical Trader - Qatar for September 10, 2018 التحليل الفني الي...QNB Group
The General Index stabilized as seen from the chart but the main trend remains up. We await a reversal signal against the recent correction to accumulate.
QNBFS Daily Technical Trader - Qatar for November 04, 2018 التحليل الفني اليو...QNB Group
The trend has been up on the Index and seems to be intact. Corrections are possible and can be used to add positions. A solid breakout above the 10,360 would take the index to the 10,550-10,600 levels.
QNBFS Daily Technical Trader - Qatar for November 28, 2018 التحليل الفني اليو...QNB Group
The trend has been up on the Index and seems to be intact. Corrections are possible and can be used to add positions. A solid breakout above the 10,360 would take the index to the 10,550-10,600 levels.
QNBFS Daily Technical Trader Qatar - April 14, 2020 التحليل الفني اليومي لبور...QNB Group
After the QE Index reached extreme levels, it has moved slightly up. At this stage, however, the Index is clearly lacking direction as the selling pressure remains a strong factor in the next expected move.
QNBFS Daily Technical Trader - Qatar for April 24, 2018 التحليل الفني اليومي ...QNB Group
An indecision candlestick has
been created yesterday on
the Qatar’s general Index;
traded volumes were also
higher. As a result, we may
see a correction, but we
expect the 9,000 to be a
strong support.
QNBFS Daily Technical Trader - Qatar for March 21, 2018 التحليل الفني اليومي ...Aicha El-Mamy
Another day in the green and the Index flirted with the 9,000 level (6 points away), which is positive. Traded volumes were higher
and as a result, we expect the Index to move above the mentioned level.
QNBFS Daily Technical Trader Qatar - February 10, 2020 التحليل الفني اليومي ل...QNB Group
The General Index reached a critical point as it continued with its weakness and reached around the 10,150 level. Testing the level is expected and a drop below there would take the Index towards the 10,000 major support.
QNBFS Daily Technical Trader - Qatar for November 21, 2018 التحليل الفني اليو...QNB Group
The trend has been up on the Index and seems to be intact. Corrections are possible and can be used to add positions. A solid breakout above the 10,360 would take the index to the 10,550-10,600 levels.
QNBFS Daily Technical Trader - Qatar for May 16 2018 التحليل الفني اليومي لبو...QNB Group
The Index closed flattish but
on a weaker note, and it could
not sustain the intra-day
breakout above the 9,000
resistance level. Like we have
mentioned in previous
reports, the Index needs to
clear the 9,000 then the 9,200
levels to be healthy.
QNBFS Daily Technical Trader - Qatar for April 10, 2018 التحليل الفني اليومي ...QNB Group
The Index ended Monday’s session with a strong, and positive, move. We remain optimistic and we are watching the 9,000 level closely; a breakout above the mentioned level means further upside would be expected.
QNBFS Daily Technical Trader - Qatar for March 14, 2018 التحليل الفني اليومي ...Aicha El-Mamy
The Index gapped up yesterday but could not reach the 9,000 level. It needs to clear the mentioned level; the 50SMA has been
moving around it, it is also needed to confirm the bullish flag formation. The recent gap could be filled before the breakout.
QNBFS Daily Technical Trader - Qatar for February 08, 2018 التحليل الفني اليو...Aicha El-Mamy
The jumped on higher volumes which is a healthy sign; we expect the market to continue with this uptick in the short term. The
Increase in traded volumes associated with the jump could encourage higher bullish participation.
QNBFS Daily Technical Trader Qatar - September 17 2019 التحليل الفني اليومي ل...QNB Group
The Index started a move above its SMAS, which is a good sign and we may see the Index move to our next expected resistance between the 10,700 and the 10,800 levels.
QNBFS Daily Technical Trader - Qatar for May 03 2018 التحليل الفني اليومي لبو...QNB Group
The Index may correct
further if it sustains the
breach below the 9,000 level;
such corrections may take
the Index down to the 8,800
level then the 8,600 level.
The Index would need to
breakout above the 9,200
level to become bullish again.
QNBFS Daily Technical Trader - Qatar for March 18, 2018 التحليل الفني اليومي ...Aicha El-Mamy
The Index managed to penetrate above the flag continuation pattern last Thursday; it looks positive over the coming session and in the medium term. That been said, it should cross above the psychological level of 9,000 to be on the safe side.
QNBFS Daily Technical Trader - Qatar for March 25, 2018 التحليل الفني اليومي ...Aicha El-Mamy
The market closed down 0.54% from vs the previous session, indicating then weakness has persisted. That been said, the index
remains above the corrective channel seen on the chart, proving the uncertainty seen on the expected direction of the market.
QNBFS Daily Technical Trader - Qatar for March 19, 2018 التحليل الفني اليومي ...Aicha El-Mamy
The Index is testing the upper side of the recent correction’s channel; the Index needs to break above it, and preferably above the 9,000 level for the Index to be on the safe side.
Similar to QNBFS Daily Technical Trader - Qatar for March 06, 2018 التحليل الفني اليومي لبورصة قطر (20)
QNBFS Daily Technical Trader - Qatar for April 09, 2018 التحليل الفني اليومي ...Aicha El-Mamy
A typical start for the week; no significant change noticed on the Index with significant drop in volumes. We remain positive on the Index especially if the Index breaks above the 8,800 intraday
resistance level.
QNBFS Daily Market Report April 08, 2018Aicha El-Mamy
The QSE Index rose 1.0% to close at 8,792.9. Gains were led by the Banks & Financial Services and Real Estate indices, gaining 2.0% and 1.8%, respectively.
QNBFS Daily Technical Trader - Qatar for April 05, 2018 التحليل الفني اليومي ...Aicha El-Mamy
The market ended yet another session in the red zone and formed a Doji candle. In our assessment, the Index should rise toward the 9,000 mark in the coming sessions.
QNBFS Daily Technical Trader - Qatar for April 04, 2018 التحليل الفني اليومي ...Aicha El-Mamy
The market edged down marginally by 0.08%. However, the Index is gradually moving towards the upper end of the correction channel. Further confirmation is needed through a breakout from this channel towards the 9,000 level.
QNBFS Daily Technical Trader - Qatar for April 03, 2018 التحليل الفني اليومي ...Aicha El-Mamy
The Index ended another session in the green zone, with the MACD moving towards the zero line. Moreover, the Index sits on the 50SMA, having already crossed the 100SMA and 200SMA support levels.
QNBFS Daily Technical Trader - Qatar for April 01, 2018 التحليل الفني اليومي ...Aicha El-Mamy
The Index remained inside the corrective channel but created a Doji candlestick, which signifies indecision among market participants. That means these participants are looking for a
direction after the recent weakness. The good news is that the Index sits on the 200SMA, which is a strong support level.
QNBFS Daily Technical Trader - Qatar for March 29, 2018 التحليل الفني اليومي ...Aicha El-Mamy
The Index moved inside the previously created corrective channel, and this is an alarming situation. The only positive side of the situation is the Index reached the 200SMA, which may act as a
support level. Further decline on the Index inside the channel signals sharper weakness could be unfolding.
QNBFS Daily Technical Trader - Qatar for March 28, 2018 التحليل الفني اليومي ...Aicha El-Mamy
The Index moved further down but remains above the upper side of the corrective channel. We are a bit concerned because the
MACD indicator is has tilted downwards and remains under the zero line, which means bearish momentum has been in control and may continue further.
QNBFS Daily Technical Trader - Qatar for March 27, 2018 التحليل الفني اليومي ...Aicha El-Mamy
Another day in the red but the general Index remains above the 8,650 points, which is slightly positive. The bulls need to take
control of the situation above or around the mentioned level; sustaining an entry inside the corrective channel means weakness could persist.
QNBFS Daily Technical Trader - Qatar for March 26, 2018 التحليل الفني اليومي ...Aicha El-Mamy
The general Index regressed in the beginning of the week but remains above the upper side of the corrective channel. We expect to see some support around that side which is just above our expected support of the 8,650 mark.
QNBFS Daily Technical Trader - Qatar for March 22, 2018 التحليل الفني اليومي ...Aicha El-Mamy
The Index is giving us conflicting signals, between a possible correction because it could not break above the 9,000 level and the expected upward motion stemming from a breakout above the
corrective channel. Our assessment remains in favor
of the positive momentum, given that the Index breaks and sustains its level above.
the 9,000 mark.
QNBFS Daily Technical Trader - Qatar for March 20, 2018 التحليل الفني اليومي ...Aicha El-Mamy
The Index managed to close above the corrective channel
which extended since January. The uptick was accompanied with relatively higher volumes and we are becoming more optimistic for the breakout above the 9,000 level.
QNBFS Daily Technical Trader - Qatar for March 15, 2018 التحليل الفني اليومي ...Aicha El-Mamy
As we expected, the Index filled the price gap through a drop in yesterday’s session. The good news is that the Index managed to reduce much of its intraday losses and closed slightly lower. That been said, we remains cautious on the Index until it manages to break above the 9,000 resistance level.
QNBFS Daily Technical Trader - Qatar for March 13, 2018 التحليل الفني اليومي ...Aicha El-Mamy
The strength of yesterday’s move could mark the end of the recent correction. The Index is bouncing off its 200SMA and that is a strong support to depart from. Further confirmation is needed through a breakout above the 9,000 level, which will clear the other moving averages and to confirm a bullish flag formation.
QNBFS Daily Technical Trader - Qatar for March 08, 2018 التحليل الفني اليومي ...Aicha El-Mamy
The Index is reaching the 8,350 level we have expected all along. The current level happens to be just around the 61.8% Fibonacci retracement of the previous bullish move (which took place between last November 2017 and January 2018). The mentioned retracement could add to strength of the support. However, we await a strong reversal signal on the daily chart before we suggest a rally from the current levels.
QNBFS Daily Technical Trader - Qatar for March 07, 2018 التحليل الفني اليومي ...Aicha El-Mamy
Another day was concluded in the red zone and the MACD is moving below the zero line. We keep our first support level at the 8,350 mark and we await a reversal signal there.
QNBFS Daily Technical Trader - Qatar for March 07, 2018 التحليل الفني اليومي ...Aicha El-Mamy
Another day was concluded in the red zone and the MACD is moving below the zero line. We keep our first support level at the 8,350 mark and we await a reversal signal there.
QNBFS Daily Market Report March 06, 2018Aicha El-Mamy
The QSE Index rose 0.9% to close at 8,730.1. Gains were led by the Consumer Goods & Services and Transportation indices, gaining 3.0% and 2.6%, respectively.
QNBFS Daily Technical Trader - Qatar for February 25, 2018 التحليل الفني اليو...Aicha El-Mamy
The Index started the week on a weaker note, which is
expected on Sundays; volumes have dropped also for the same reason. We remain cautious on the next move; the only light we
see at the end of the tunnel is the MACD indicator, being above the zero line.
QNBFS Daily Technical Trader - Qatar for February 25, 2018 التحليل الفني اليو...Aicha El-Mamy
The Index closed slightly down last Thursday; weakness was the main characteristic of the Index in the past week and could
continue in the coming week. Volumes have dropped significantly and testing the 9,000 support is a very possible scenario.
where can I find a legit pi merchant onlineDOT TECH
Yes. This is very easy what you need is a recommendation from someone who has successfully traded pi coins before with a merchant.
Who is a pi merchant?
A pi merchant is someone who buys pi network coins and resell them to Investors looking forward to hold thousands of pi coins before the open mainnet.
I will leave the telegram contact of my personal pi merchant to trade with
@Pi_vendor_247
Financial Assets: Debit vs Equity Securities.pptxWrito-Finance
financial assets represent claim for future benefit or cash. Financial assets are formed by establishing contracts between participants. These financial assets are used for collection of huge amounts of money for business purposes.
Two major Types: Debt Securities and Equity Securities.
Debt Securities are Also known as fixed-income securities or instruments. The type of assets is formed by establishing contracts between investor and issuer of the asset.
• The first type of Debit securities is BONDS. Bonds are issued by corporations and government (both local and national government).
• The second important type of Debit security is NOTES. Apart from similarities associated with notes and bonds, notes have shorter term maturity.
• The 3rd important type of Debit security is TRESURY BILLS. These securities have short-term ranging from three months, six months, and one year. Issuer of such securities are governments.
• Above discussed debit securities are mostly issued by governments and corporations. CERTIFICATE OF DEPOSITS CDs are issued by Banks and Financial Institutions. Risk factor associated with CDs gets reduced when issued by reputable institutions or Banks.
Following are the risk attached with debt securities: Credit risk, interest rate risk and currency risk
There are no fixed maturity dates in such securities, and asset’s value is determined by company’s performance. There are two major types of equity securities: common stock and preferred stock.
Common Stock: These are simple equity securities and bear no complexities which the preferred stock bears. Holders of such securities or instrument have the voting rights when it comes to select the company’s board of director or the business decisions to be made.
Preferred Stock: Preferred stocks are sometime referred to as hybrid securities, because it contains elements of both debit security and equity security. Preferred stock confers ownership rights to security holder that is why it is equity instrument
<a href="https://www.writofinance.com/equity-securities-features-types-risk/" >Equity securities </a> as a whole is used for capital funding for companies. Companies have multiple expenses to cover. Potential growth of company is required in competitive market. So, these securities are used for capital generation, and then uses it for company’s growth.
Concluding remarks
Both are employed in business. Businesses are often established through debit securities, then what is the need for equity securities. Companies have to cover multiple expenses and expansion of business. They can also use equity instruments for repayment of debits. So, there are multiple uses for securities. As an investor, you need tools for analysis. Investment decisions are made by carefully analyzing the market. For better analysis of the stock market, investors often employ financial analysis of companies.
what is the best method to sell pi coins in 2024DOT TECH
The best way to sell your pi coins safely is trading with an exchange..but since pi is not launched in any exchange, and second option is through a VERIFIED pi merchant.
Who is a pi merchant?
A pi merchant is someone who buys pi coins from miners and pioneers and resell them to Investors looking forward to hold massive amounts before mainnet launch in 2026.
I will leave the telegram contact of my personal pi merchant to trade pi coins with.
@Pi_vendor_247
how can I sell pi coins after successfully completing KYCDOT TECH
Pi coins is not launched yet in any exchange 💱 this means it's not swappable, the current pi displaying on coin market cap is the iou version of pi. And you can learn all about that on my previous post.
RIGHT NOW THE ONLY WAY you can sell pi coins is through verified pi merchants. A pi merchant is someone who buys pi coins and resell them to exchanges and crypto whales. Looking forward to hold massive quantities of pi coins before the mainnet launch.
This is because pi network is not doing any pre-sale or ico offerings, the only way to get my coins is from buying from miners. So a merchant facilitates the transactions between the miners and these exchanges holding pi.
I and my friends has sold more than 6000 pi coins successfully with this method. I will be happy to share the contact of my personal pi merchant. The one i trade with, if you have your own merchant you can trade with them. For those who are new.
Message: @Pi_vendor_247 on telegram.
I wouldn't advise you selling all percentage of the pi coins. Leave at least a before so its a win win during open mainnet. Have a nice day pioneers ♥️
#kyc #mainnet #picoins #pi #sellpi #piwallet
#pinetwork
how to sell pi coins effectively (from 50 - 100k pi)DOT TECH
Anywhere in the world, including Africa, America, and Europe, you can sell Pi Network Coins online and receive cash through online payment options.
Pi has not yet been launched on any exchange because we are currently using the confined Mainnet. The planned launch date for Pi is June 28, 2026.
Reselling to investors who want to hold until the mainnet launch in 2026 is currently the sole way to sell.
Consequently, right now. All you need to do is select the right pi network provider.
Who is a pi merchant?
An individual who buys coins from miners on the pi network and resells them to investors hoping to hang onto them until the mainnet is launched is known as a pi merchant.
debuts.
I'll provide you the Telegram username
@Pi_vendor_247
US Economic Outlook - Being Decided - M Capital Group August 2021.pdfpchutichetpong
The U.S. economy is continuing its impressive recovery from the COVID-19 pandemic and not slowing down despite re-occurring bumps. The U.S. savings rate reached its highest ever recorded level at 34% in April 2020 and Americans seem ready to spend. The sectors that had been hurt the most by the pandemic specifically reduced consumer spending, like retail, leisure, hospitality, and travel, are now experiencing massive growth in revenue and job openings.
Could this growth lead to a “Roaring Twenties”? As quickly as the U.S. economy contracted, experiencing a 9.1% drop in economic output relative to the business cycle in Q2 2020, the largest in recorded history, it has rebounded beyond expectations. This surprising growth seems to be fueled by the U.S. government’s aggressive fiscal and monetary policies, and an increase in consumer spending as mobility restrictions are lifted. Unemployment rates between June 2020 and June 2021 decreased by 5.2%, while the demand for labor is increasing, coupled with increasing wages to incentivize Americans to rejoin the labor force. Schools and businesses are expected to fully reopen soon. In parallel, vaccination rates across the country and the world continue to rise, with full vaccination rates of 50% and 14.8% respectively.
However, it is not completely smooth sailing from here. According to M Capital Group, the main risks that threaten the continued growth of the U.S. economy are inflation, unsettled trade relations, and another wave of Covid-19 mutations that could shut down the world again. Have we learned from the past year of COVID-19 and adapted our economy accordingly?
“In order for the U.S. economy to continue growing, whether there is another wave or not, the U.S. needs to focus on diversifying supply chains, supporting business investment, and maintaining consumer spending,” says Grace Feeley, a research analyst at M Capital Group.
While the economic indicators are positive, the risks are coming closer to manifesting and threatening such growth. The new variants spreading throughout the world, Delta, Lambda, and Gamma, are vaccine-resistant and muddy the predictions made about the economy and health of the country. These variants bring back the feeling of uncertainty that has wreaked havoc not only on the stock market but the mindset of people around the world. MCG provides unique insight on how to mitigate these risks to possibly ensure a bright economic future.
USDA Loans in California: A Comprehensive Overview.pptxmarketing367770
USDA Loans in California: A Comprehensive Overview
If you're dreaming of owning a home in California's rural or suburban areas, a USDA loan might be the perfect solution. The U.S. Department of Agriculture (USDA) offers these loans to help low-to-moderate-income individuals and families achieve homeownership.
Key Features of USDA Loans:
Zero Down Payment: USDA loans require no down payment, making homeownership more accessible.
Competitive Interest Rates: These loans often come with lower interest rates compared to conventional loans.
Flexible Credit Requirements: USDA loans have more lenient credit score requirements, helping those with less-than-perfect credit.
Guaranteed Loan Program: The USDA guarantees a portion of the loan, reducing risk for lenders and expanding borrowing options.
Eligibility Criteria:
Location: The property must be located in a USDA-designated rural or suburban area. Many areas in California qualify.
Income Limits: Applicants must meet income guidelines, which vary by region and household size.
Primary Residence: The home must be used as the borrower's primary residence.
Application Process:
Find a USDA-Approved Lender: Not all lenders offer USDA loans, so it's essential to choose one approved by the USDA.
Pre-Qualification: Determine your eligibility and the amount you can borrow.
Property Search: Look for properties in eligible rural or suburban areas.
Loan Application: Submit your application, including financial and personal information.
Processing and Approval: The lender and USDA will review your application. If approved, you can proceed to closing.
USDA loans are an excellent option for those looking to buy a home in California's rural and suburban areas. With no down payment and flexible requirements, these loans make homeownership more attainable for many families. Explore your eligibility today and take the first step toward owning your dream home.
what is the future of Pi Network currency.DOT TECH
The future of the Pi cryptocurrency is uncertain, and its success will depend on several factors. Pi is a relatively new cryptocurrency that aims to be user-friendly and accessible to a wide audience. Here are a few key considerations for its future:
Message: @Pi_vendor_247 on telegram if u want to sell PI COINS.
1. Mainnet Launch: As of my last knowledge update in January 2022, Pi was still in the testnet phase. Its success will depend on a successful transition to a mainnet, where actual transactions can take place.
2. User Adoption: Pi's success will be closely tied to user adoption. The more users who join the network and actively participate, the stronger the ecosystem can become.
3. Utility and Use Cases: For a cryptocurrency to thrive, it must offer utility and practical use cases. The Pi team has talked about various applications, including peer-to-peer transactions, smart contracts, and more. The development and implementation of these features will be essential.
4. Regulatory Environment: The regulatory environment for cryptocurrencies is evolving globally. How Pi navigates and complies with regulations in various jurisdictions will significantly impact its future.
5. Technology Development: The Pi network must continue to develop and improve its technology, security, and scalability to compete with established cryptocurrencies.
6. Community Engagement: The Pi community plays a critical role in its future. Engaged users can help build trust and grow the network.
7. Monetization and Sustainability: The Pi team's monetization strategy, such as fees, partnerships, or other revenue sources, will affect its long-term sustainability.
It's essential to approach Pi or any new cryptocurrency with caution and conduct due diligence. Cryptocurrency investments involve risks, and potential rewards can be uncertain. The success and future of Pi will depend on the collective efforts of its team, community, and the broader cryptocurrency market dynamics. It's advisable to stay updated on Pi's development and follow any updates from the official Pi Network website or announcements from the team.
The European Unemployment Puzzle: implications from population agingGRAPE
We study the link between the evolving age structure of the working population and unemployment. We build a large new Keynesian OLG model with a realistic age structure, labor market frictions, sticky prices, and aggregate shocks. Once calibrated to the European economy, we quantify the extent to which demographic changes over the last three decades have contributed to the decline of the unemployment rate. Our findings yield important implications for the future evolution of unemployment given the anticipated further aging of the working population in Europe. We also quantify the implications for optimal monetary policy: lowering inflation volatility becomes less costly in terms of GDP and unemployment volatility, which hints that optimal monetary policy may be more hawkish in an aging society. Finally, our results also propose a partial reversal of the European-US unemployment puzzle due to the fact that the share of young workers is expected to remain robust in the US.
how can i use my minded pi coins I need some funds.DOT TECH
If you are interested in selling your pi coins, i have a verified pi merchant, who buys pi coins and resell them to exchanges looking forward to hold till mainnet launch.
Because the core team has announced that pi network will not be doing any pre-sale. The only way exchanges like huobi, bitmart and hotbit can get pi is by buying from miners.
Now a merchant stands in between these exchanges and the miners. As a link to make transactions smooth. Because right now in the enclosed mainnet you can't sell pi coins your self. You need the help of a merchant,
i will leave the telegram contact of my personal pi merchant below. 👇 I and my friends has traded more than 3000pi coins with him successfully.
@Pi_vendor_247
Falcon stands out as a top-tier P2P Invoice Discounting platform in India, bridging esteemed blue-chip companies and eager investors. Our goal is to transform the investment landscape in India by establishing a comprehensive destination for borrowers and investors with diverse profiles and needs, all while minimizing risk. What sets Falcon apart is the elimination of intermediaries such as commercial banks and depository institutions, allowing investors to enjoy higher yields.
What website can I sell pi coins securely.DOT TECH
Currently there are no website or exchange that allow buying or selling of pi coins..
But you can still easily sell pi coins, by reselling it to exchanges/crypto whales interested in holding thousands of pi coins before the mainnet launch.
Who is a pi merchant?
A pi merchant is someone who buys pi coins from miners and resell to these crypto whales and holders of pi..
This is because pi network is not doing any pre-sale. The only way exchanges can get pi is by buying from miners and pi merchants stands in between the miners and the exchanges.
How can I sell my pi coins?
Selling pi coins is really easy, but first you need to migrate to mainnet wallet before you can do that. I will leave the telegram contact of my personal pi merchant to trade with.
Tele-gram.
@Pi_vendor_247
4. 4
Definitions
Candlestick: A chart that displays the high, low, opening and closing prices for a security in a single period. The body of the candle is made up by
the opening and the closing prices, i.e., the taller the body the greater the range between these two prices and vice versa. A colored candle
denotes a closing price that is lower than the opening price, while a white candle shows the opposite. The candlestick's shadows or wicks show
the period's high and low prices and how they compare to the opening and closing price. In general, the shape of the candle will vary upon the
positions of the period's high, low, opening and closing prices.
Support: A level that could cause more buyers to step in in order to prevent the security from falling or causing the security price to head higher.
Resistance: An inverse of a support level. A resistance area or level could cause more sellers to step in in order to prevent the security from rising
or causing the security price to head lower.
SMA (Simple Moving Average): Is an arithmetic average, which calculates the average price of a security over a defined number of periods and is
thus considered a lagging indicator. SMAs used in our analysis refer to closing prices. In general, SMAs serve many purposes, such as a
smoothing tool, an indicative price direction and potential support/resistance levels.
Market Breadth: Breadth indicates the number of securities that have closed higher vs. the number of decliners in a particular exchange.
MACD (Moving Average Convergence/Divergence): Is a trading indicator, which shows changes in the strength, direction, momentum and
duration of a trend in a stock's price through a collection of three time series calculated from historical closing price data.
RSI (Relative Strength Index): Is a momentum indicator that compares a security’s price gains to its losses for a predetermined number of periods
(we generally use 14 periods). The RSI attempts to point out how a security, in relative terms, is in the overbought/oversold zone. Securities with
a RSI above 70 could be considered as overbought, and below 30 could be considered as oversold.
Pattern/Formation: Is a graphical presentation of a security’s price activity over a certain period of time. Formations come in different shapes
(such as, head & shoulders, triangles, flags, and so on). They can be used to identify potential trends, reversal of trends, price targets, entry and
exit points, etc.
Fibonacci Retracements: Are horizontal lines that indicate expected areas of support/resistance for a security based on a predetermined price
movement. These levels are usually indicated by Fibonacci ratios of 23.6%, 38.2%, 50.0%, 61.8% and 100% from that particular movement.
Fibonacci Pivot and Intraday Support/Resistance: A Pivot Point is generally used to formulate expected future support/resistance levels. From
the base Pivot Point, Fibonacci multiples of the high-low differential are added to form resistance levels and subtracted to form support levels.
5. 5
Contacts
Zaid al-Nafoosi, CMT, CFTe
Senior Research Analyst
Tel: (+974) 4476 6535
zaid.alnafoosi@qnbfs.com.qa
Saugata Sarkar, CFA, CAIA
Head of Research
Tel: (+974) 4476 6534
saugata.sarkar@qnbfs.com.qa
Shahan Keushgerian
Senior Research Analyst
Tel: (+974) 4476 6509
shahan.keushgerian@qnbfs.com.qa
Mohamed Abo Daff
Senior Research Analyst
Tel: (+974) 4476 6589
mohd.abodaff@qnbfs.com.qa
Ahmed El-Khudary
Head of Trading
Tel: (+974) 4476 6533
ahmed.elkhudary@qnbfs.com.qa
Feras al-Sarraj
Head of Sales
Tel: (+974) 4476 6514
feras.alsarraj@qnbfs.com.qa
QNB Financial Services
Contact Center: (+974) 4476 6666
PO Box 24025
Doha, Qatar
Disclaimer and Copyright Notice: This publication has been prepared by QNB Financial Services Co. W.L.L. (“QNBFS”) a wholly-owned subsidiary of Qatar National Bank (Q.P.S.C.)
(“QNB”). QNBFS is regulated by the Qatar Financial Markets Authority and the Qatar Exchange QNB SAQ is regulated by the Qatar Central Bank. This publication expresses the
views and opinions of QNBFS at a given time only. It is not an offer, promotion or recommendation to buy or sell securities or other investments, nor is it intended to constitute legal,
tax, accounting, or financial advice. QNBFS accepts no liability whatsoever for any direct or indirect losses arising from use of this report. Any investment decision should depend on
the individual circumstances of the investor and be based on specifically engaged investment advice. We therefore strongly advise potential investors to seek independent
professional advice before making any investment decision. Although the information in this report has been obtained from sources that QNBFS believes to be reliable, we have not
independently verified such information and it may not be accurate or complete. QNBFS does not make any representations or warranties as to the accuracy and completeness of the
information it may contain, and declines any liability in that respect. For reports dealing with Technical Analysis, expressed opinions and/or recommendations may be different or
contrary to the opinions/recommendations of QNBFS Fundamental Research as a result of depending solely on the historical technical data (price and volume). QNBFS reserves the
right to amend the views and opinions expressed in this publication at any time. It may also express viewpoints or make investment decisions that differ significantly from, or even
contradict, the views and opinions included in this report. This report may not be reproduced in whole or in part without permission from QNBFS.