Download as PDF, PPTX


![12
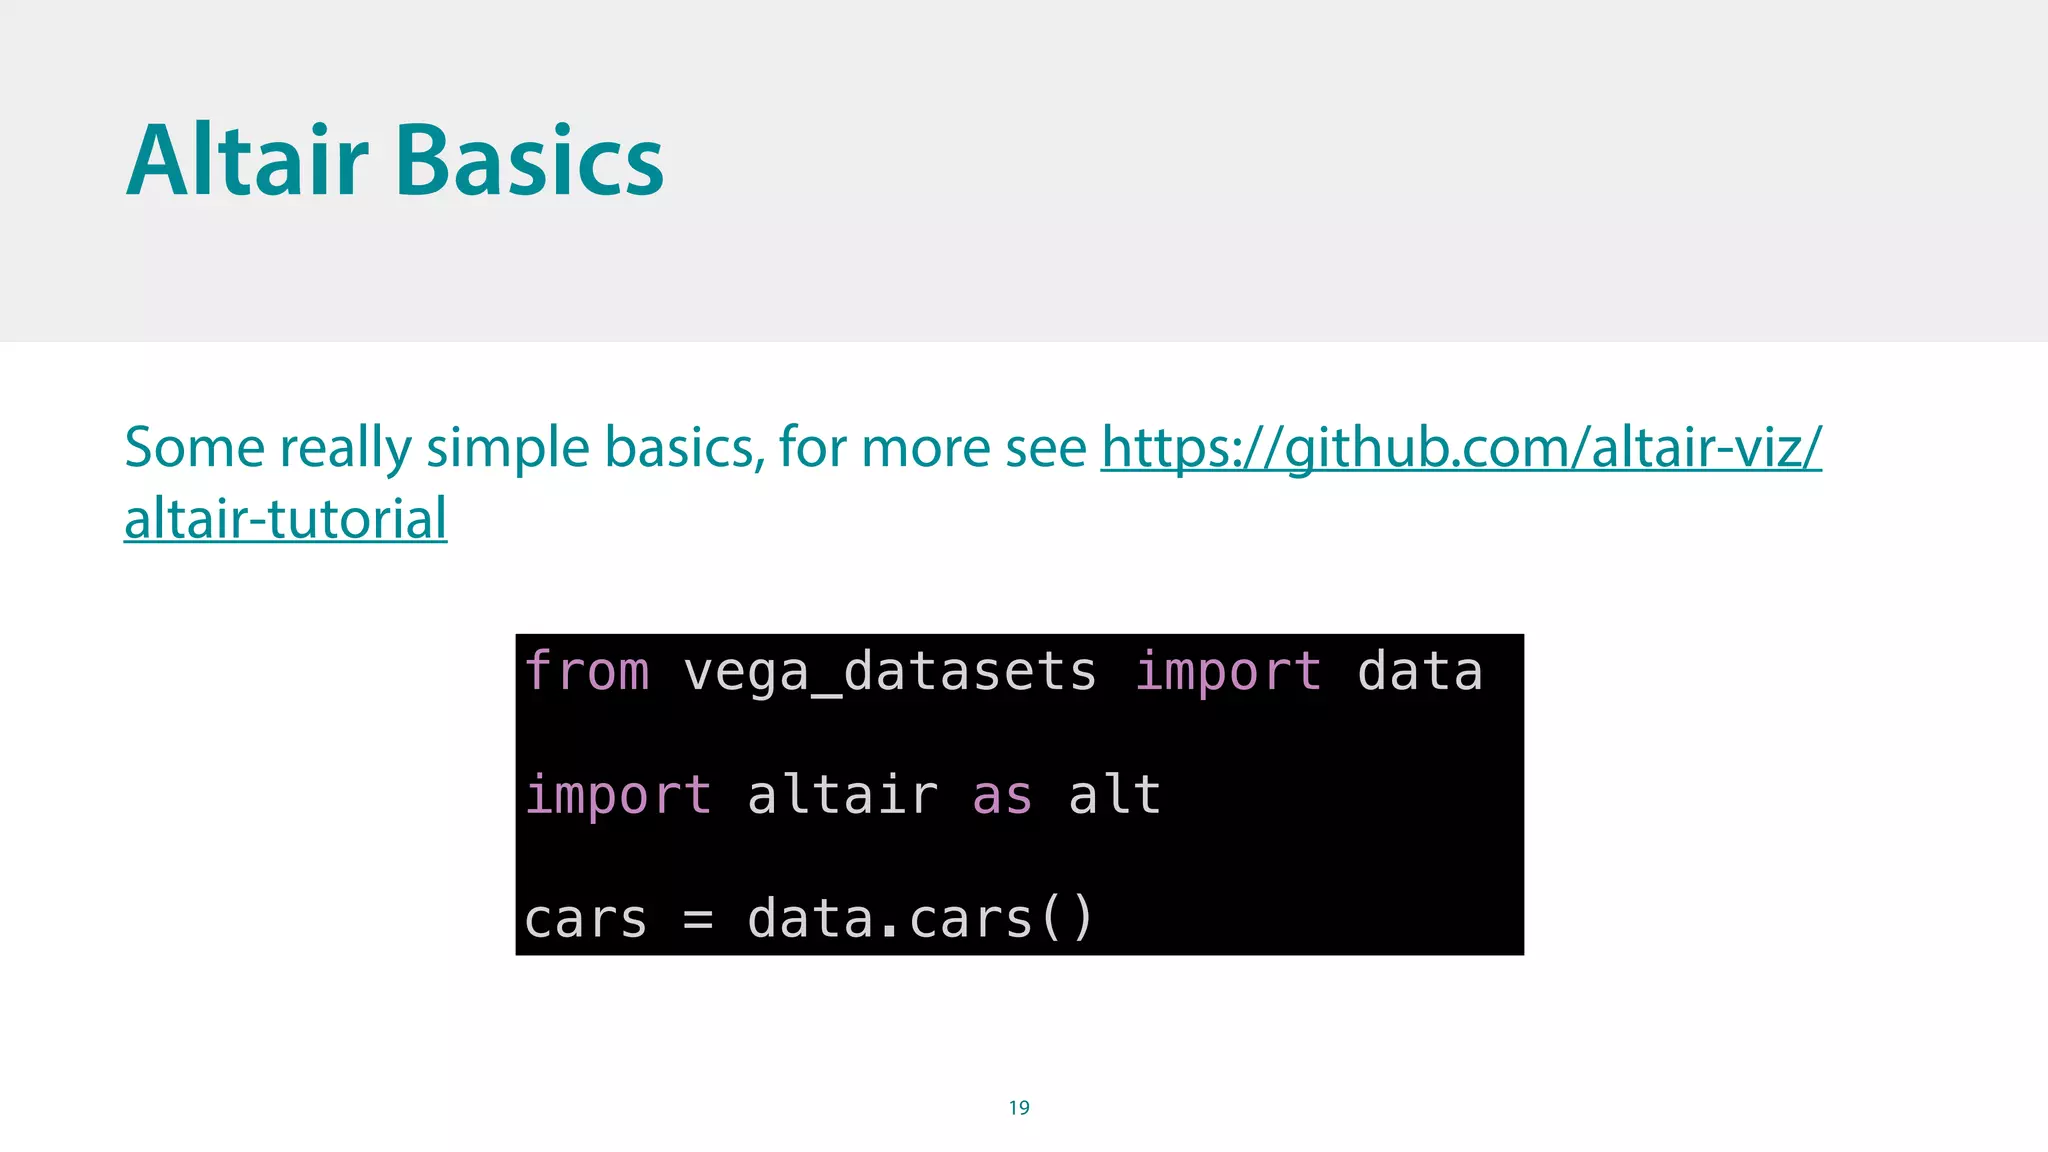
Vega(-lite) specs in Python
from flask import Flask, jsonify
app = Flask(__name__)
@app.route("/barchart.json")
def barchart():
return jsonify({
"$schema": "https://vega.github.io/schema/vega-lite/v2.json",
"description": "A simple bar chart with embedded data.",
"data": {
"values": [
{"a": "A","b": 28}, {"a": "B","b": 55}, {"a": "C","b": 43},
{"a": "D","b": 91}, {"a": "E","b": 81}, {"a": "F","b": 53},
{"a": "G","b": 19}, {"a": "H","b": 87}, {"a": "I","b": 52}
]
},
"mark": "bar",
"encoding": {
"x": {"field": "a", "type": "ordinal"},
"y": {"field": "b", "type": "quantitative"}
}
}](https://image.slidesharecdn.com/pydataamsterdamaltairvegavue-180527155534/75/PyData-Amsterdam-2018-Building-customer-visible-data-science-dashboards-with-Altair-Vega-Vue-12-2048.jpg)
![13
Altair
import altair as alt
import pandas as pd
df = pd.DataFrame({
'a': ["A", "B", "C", "D", "E", "F", "G", "H", "I"],
'b': [28, 55, 43, 91, 81, 53, 19, 87, 52]
})
alt.Chart(df).mark_bar().encode(
x='a',
y='b',
)](https://image.slidesharecdn.com/pydataamsterdamaltairvegavue-180527155534/75/PyData-Amsterdam-2018-Building-customer-visible-data-science-dashboards-with-Altair-Vega-Vue-13-2048.jpg)
![15
app = Flask(__name__)
cars = vega_datasets.data.cars()
@app.route("/vega-example")
def hello():
columns = [
…
]
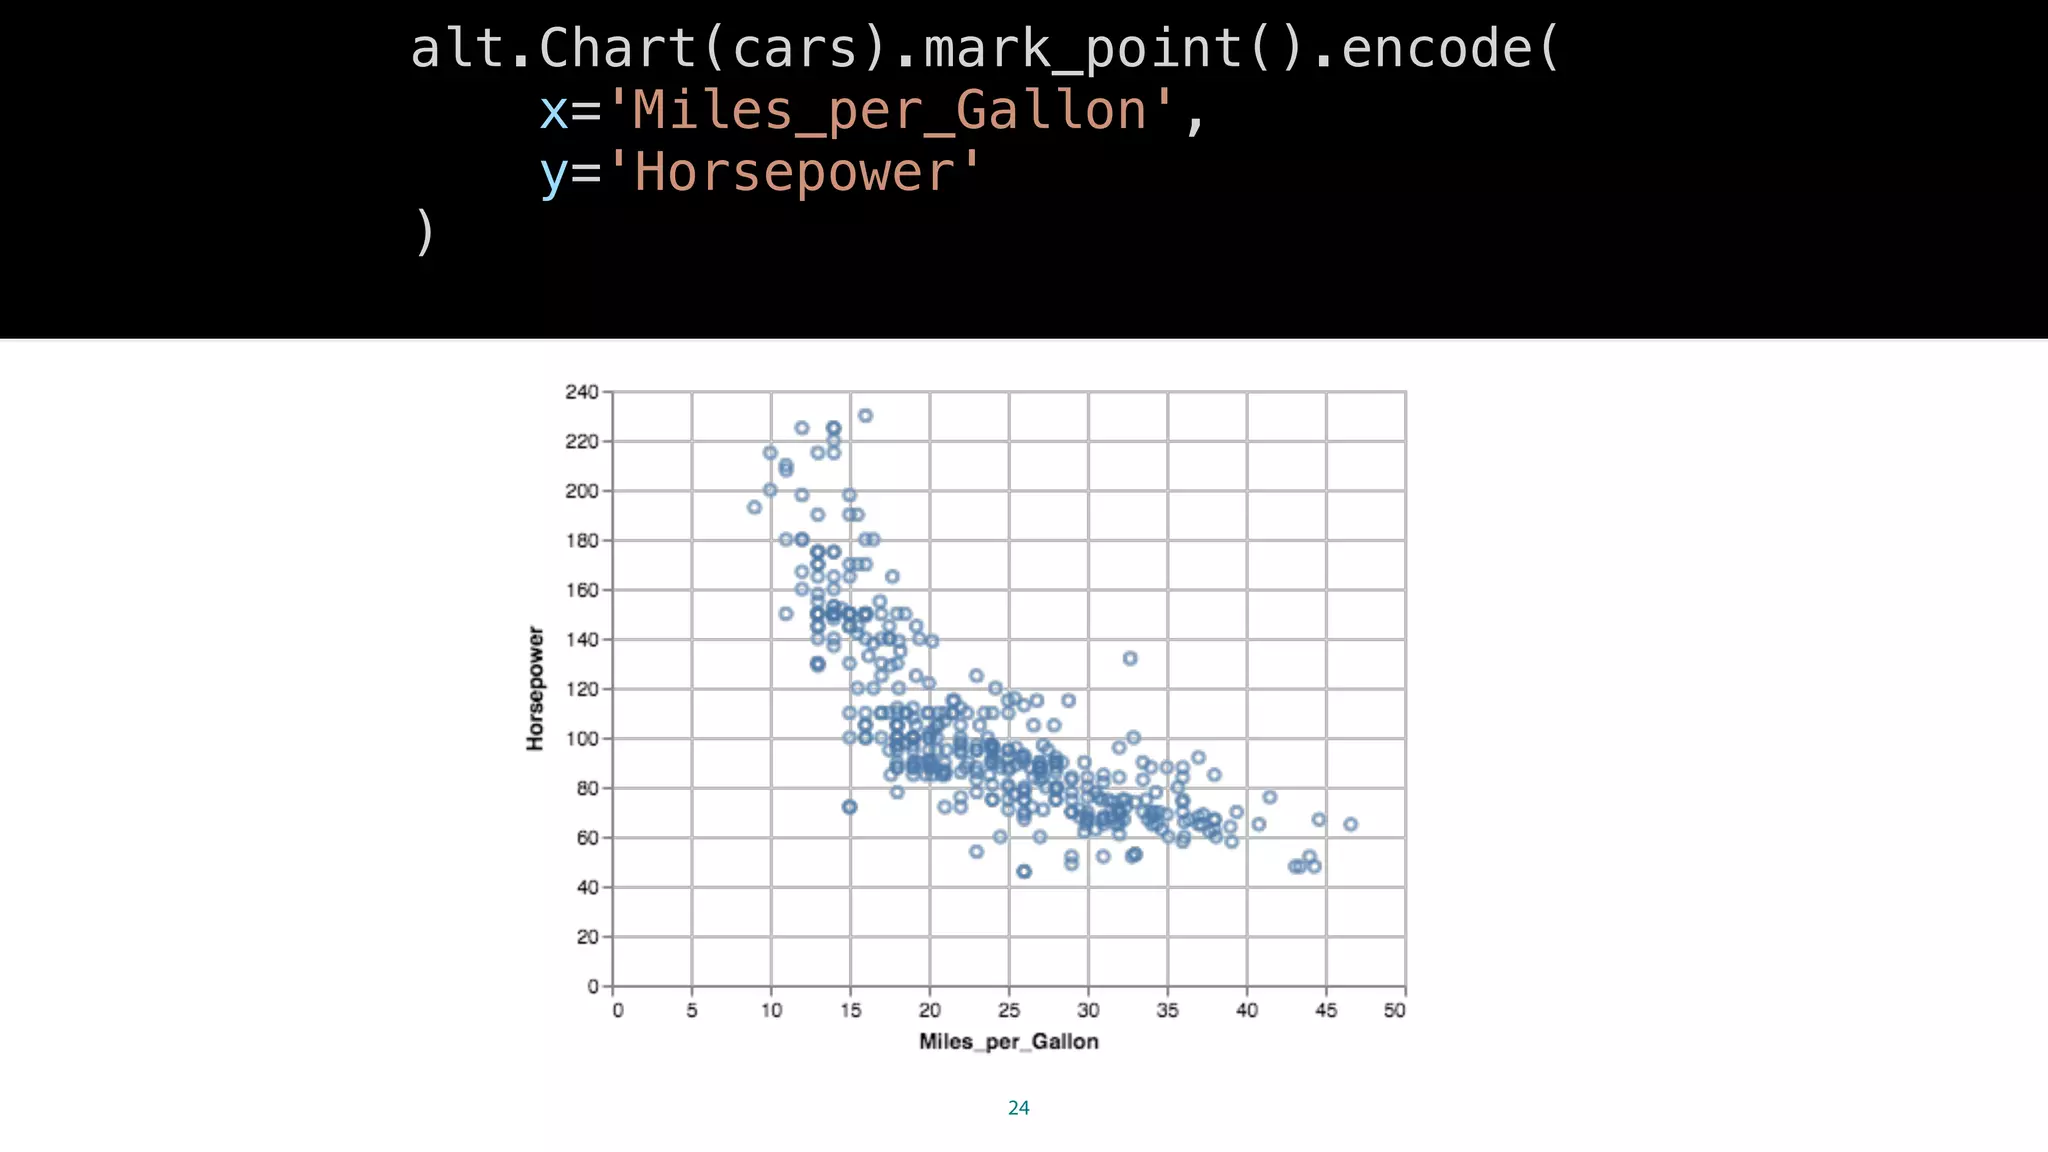
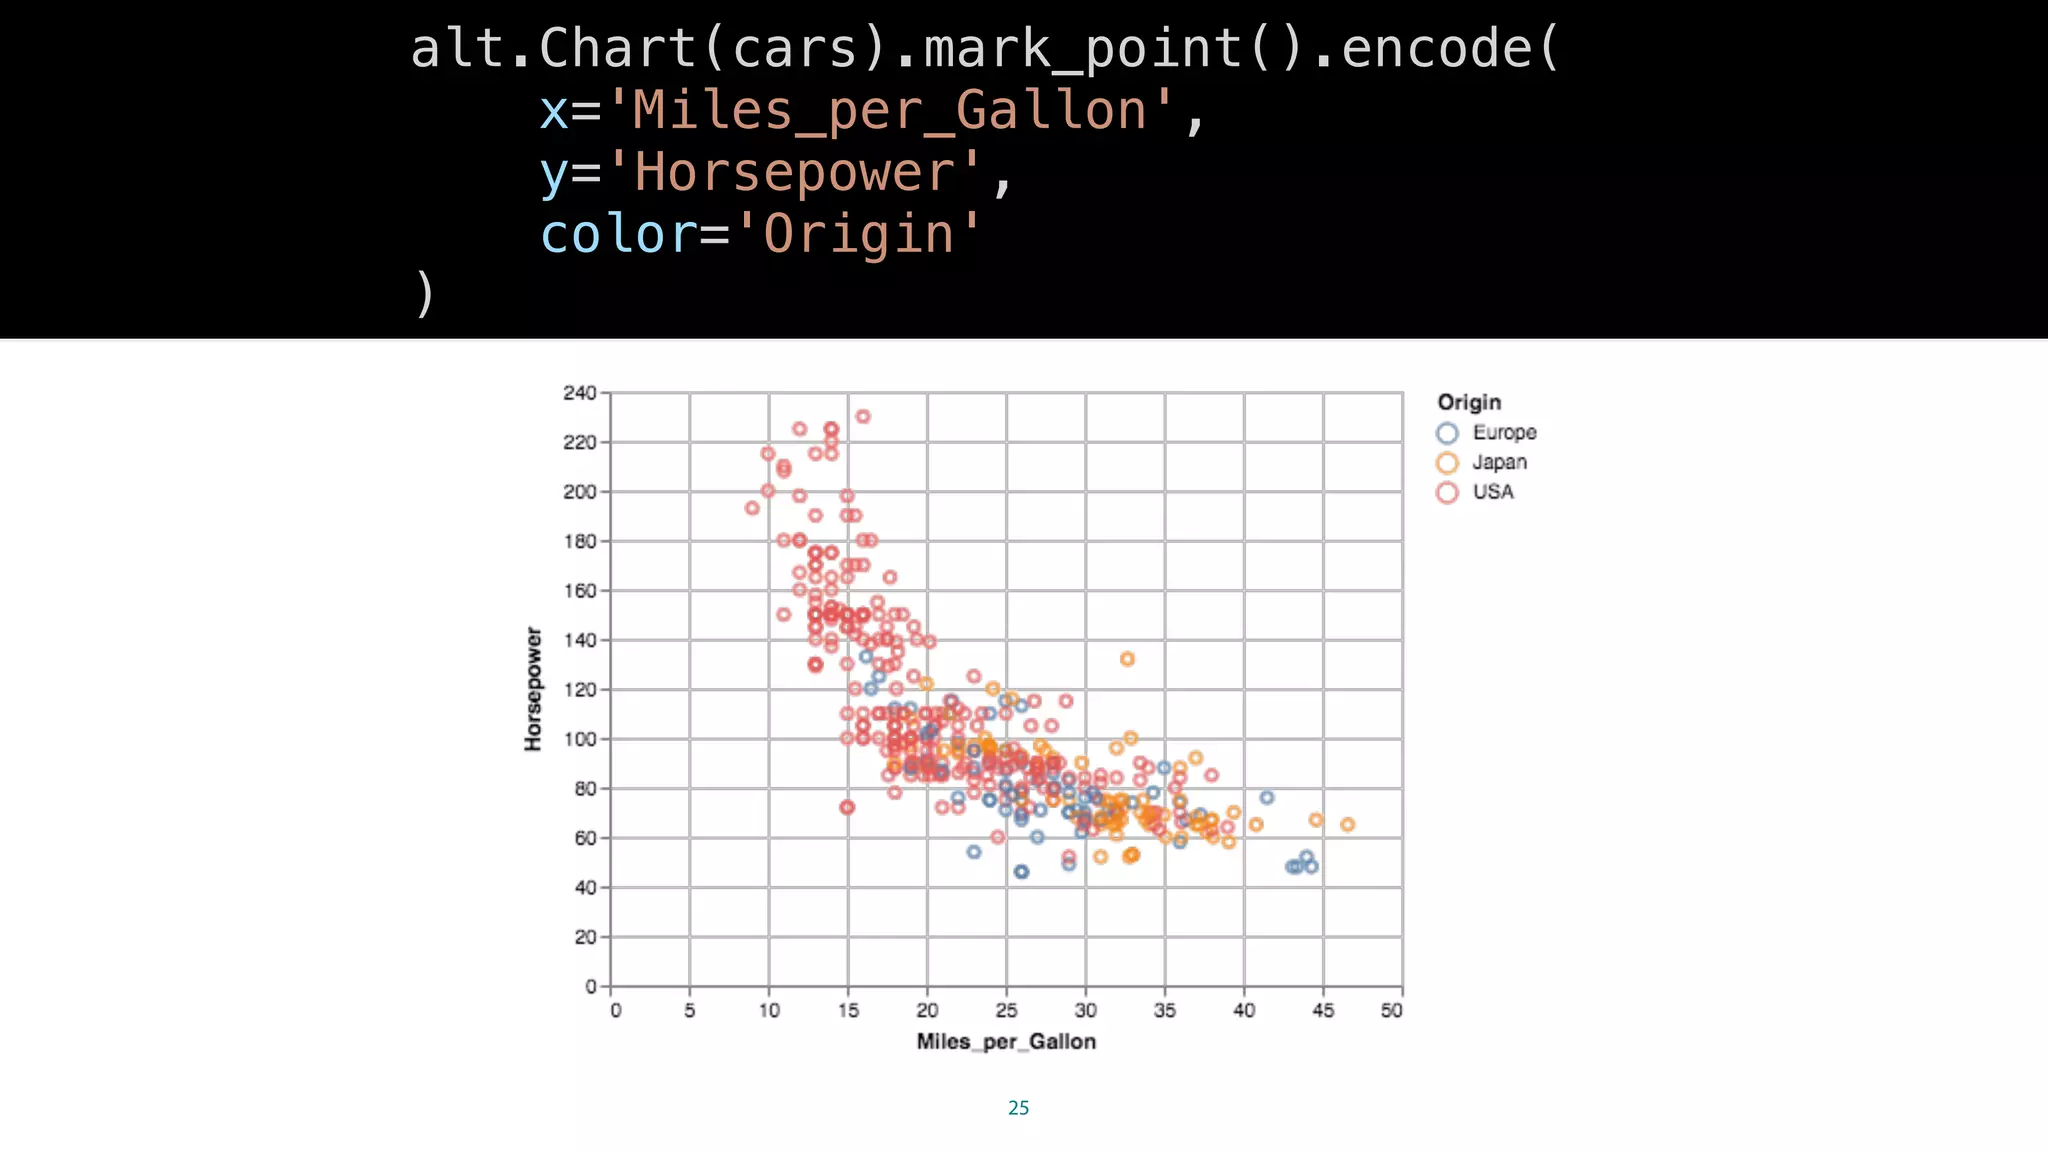
chart = alt.Chart(cars).mark_point().encode(
x=random.choice(columns),
y=random.choice(columns)
)
return jsonify(chart.to_dict())
app.py](https://image.slidesharecdn.com/pydataamsterdamaltairvegavue-180527155534/75/PyData-Amsterdam-2018-Building-customer-visible-data-science-dashboards-with-Altair-Vega-Vue-15-2048.jpg)

![27
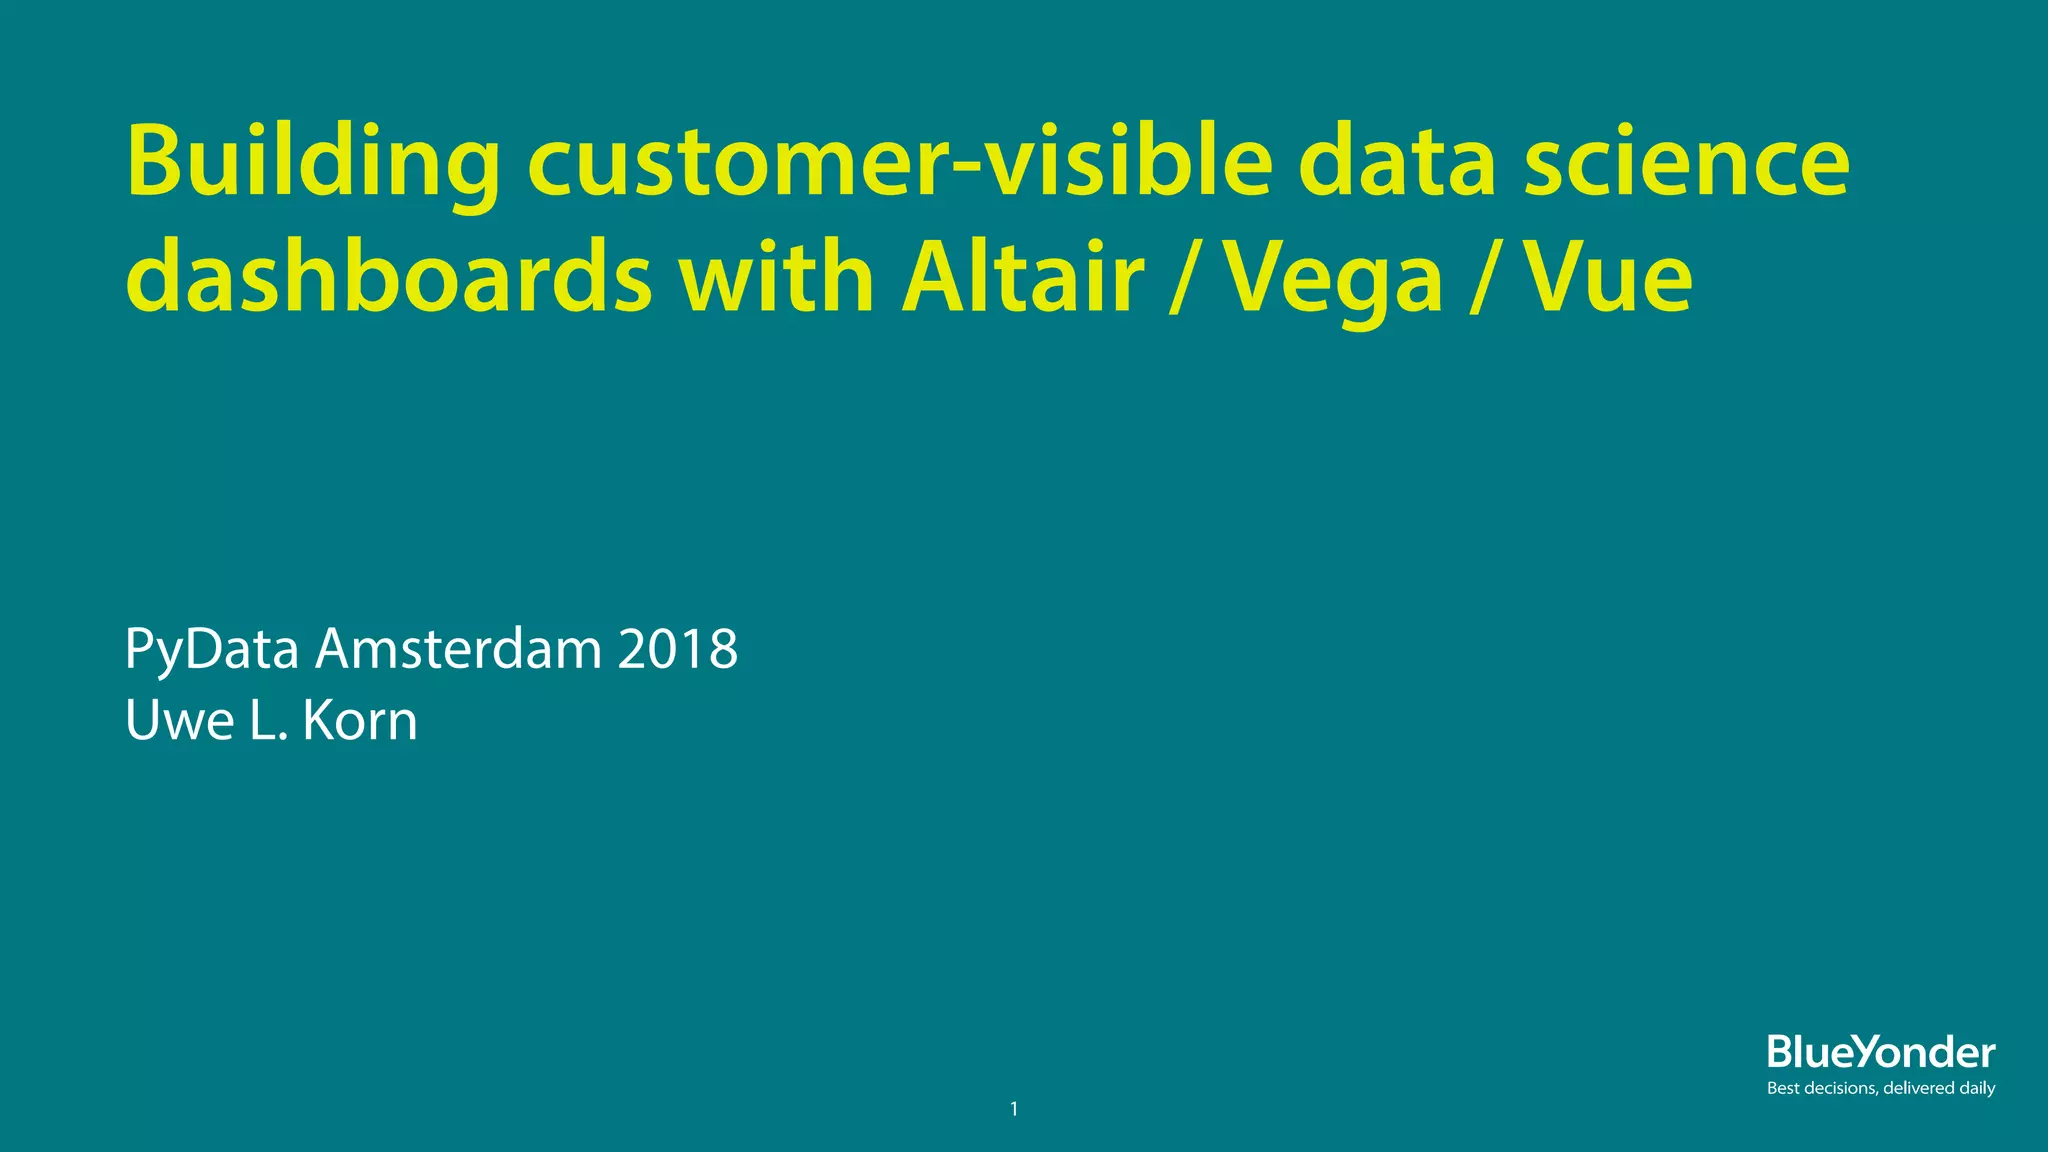
By JOEXX (Own work) [CC BY-SA 3.0 (http://creativecommons.org/licenses/by-sa/3.0)], via Wikimedia Commons
By JOEXX (Own work) [CC BY-SA 3.0 (http://creativecommons.org/licenses/by-sa/3.0)], via Wikimedia Commons
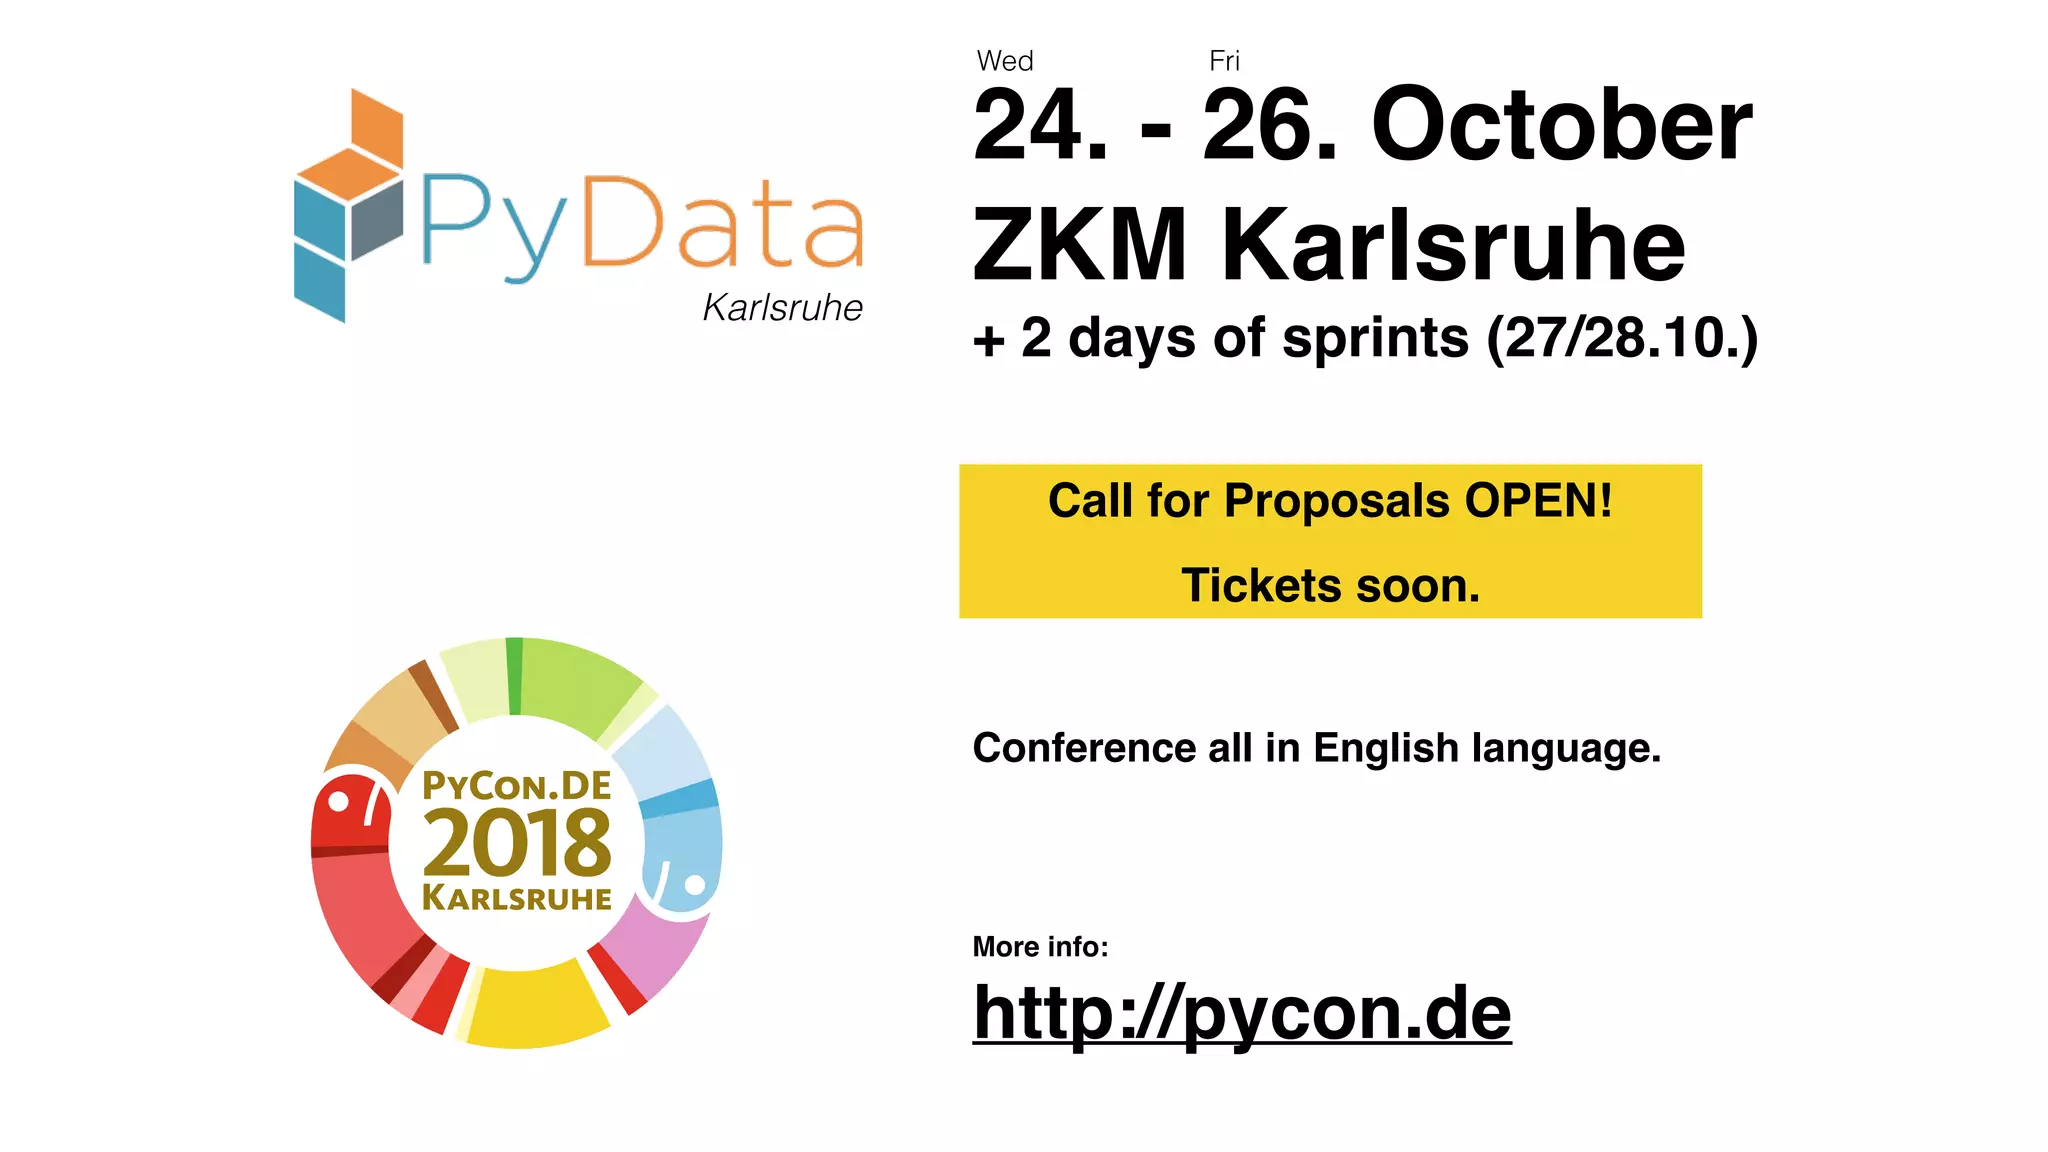
24. - 26. October
+ 2 days of sprints (27/28.10.)
ZKM Karlsruhe, DEKarlsruhe
Call for Participation opens next week.](https://image.slidesharecdn.com/pydataamsterdamaltairvegavue-180527155534/75/PyData-Amsterdam-2018-Building-customer-visible-data-science-dashboards-with-Altair-Vega-Vue-27-2048.jpg)

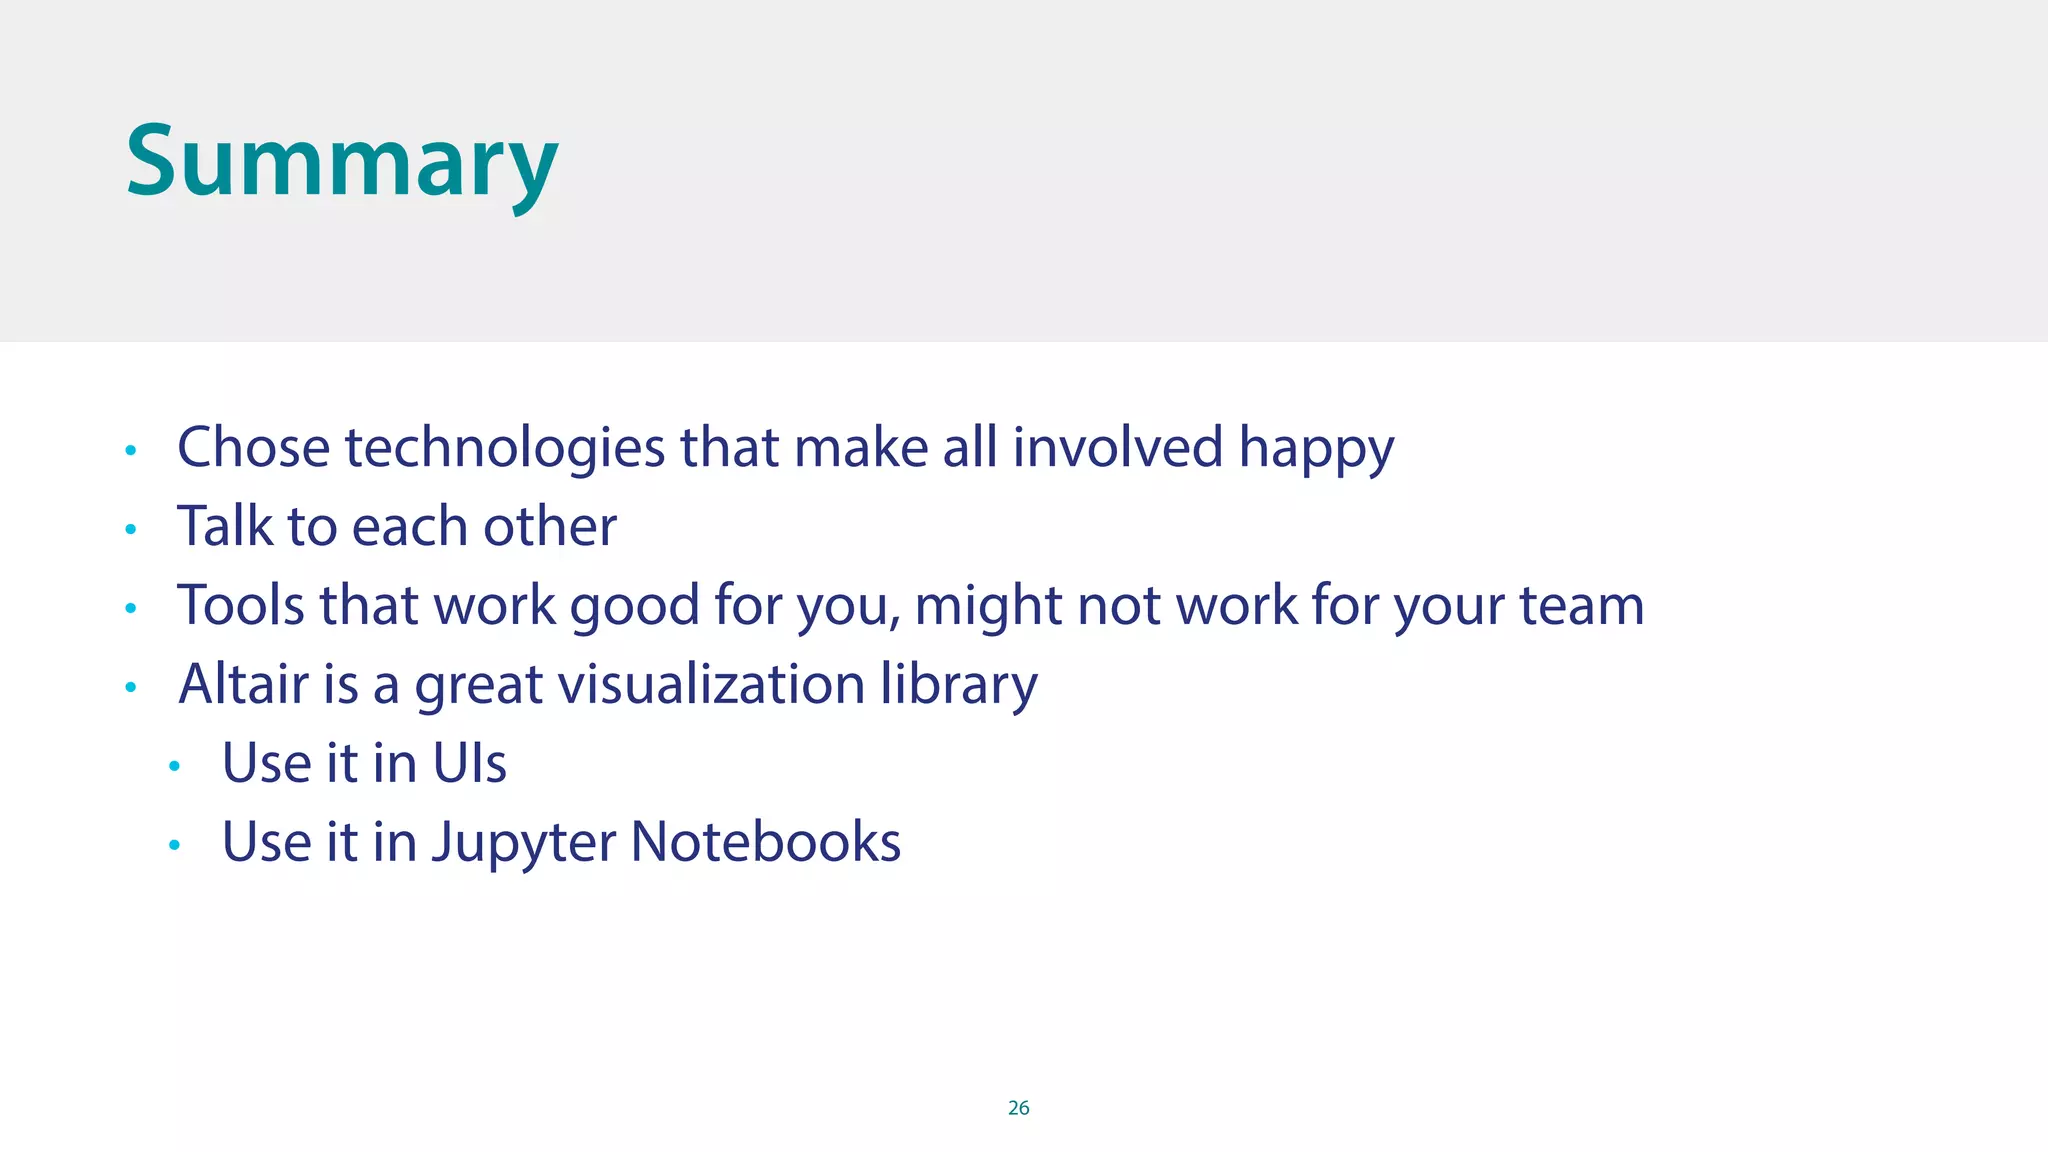
The document discusses building customer-visible data science dashboards using Altair, Vega, and Vue.js, emphasizing the need for accessible visualizations for non-technical users. It covers the advantages of using various technologies in collaboration with frontend developers, exploring components like charts and interactive widgets. The presentation ultimately advocates for using suitable tools and technologies that benefit both data scientists and their teams.