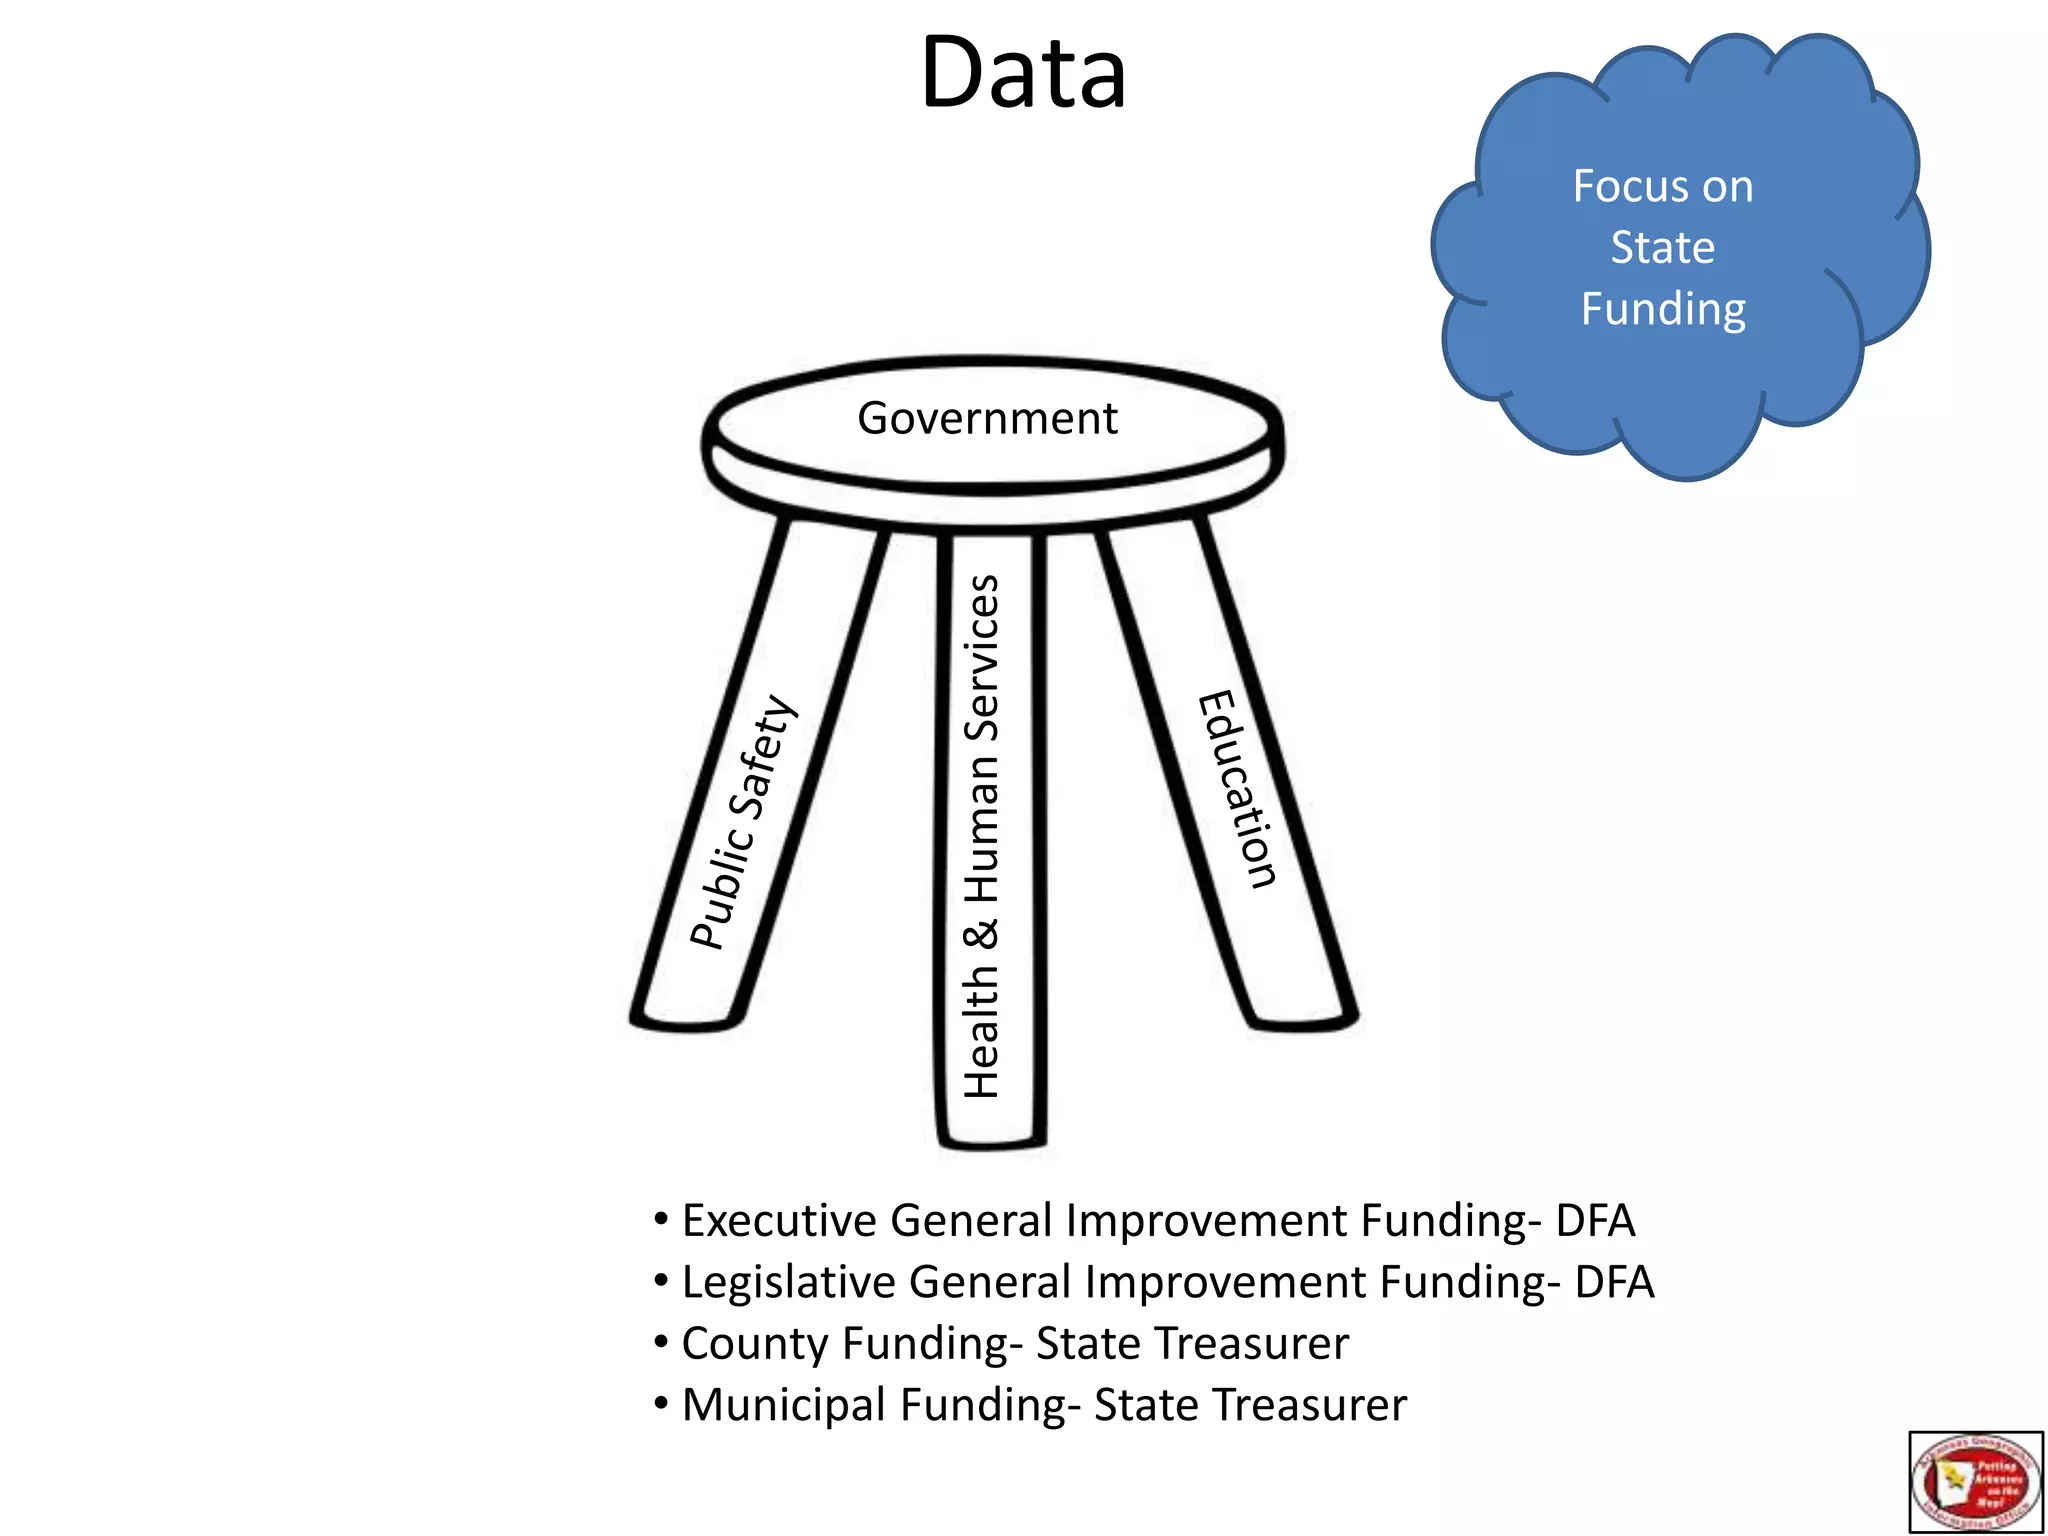
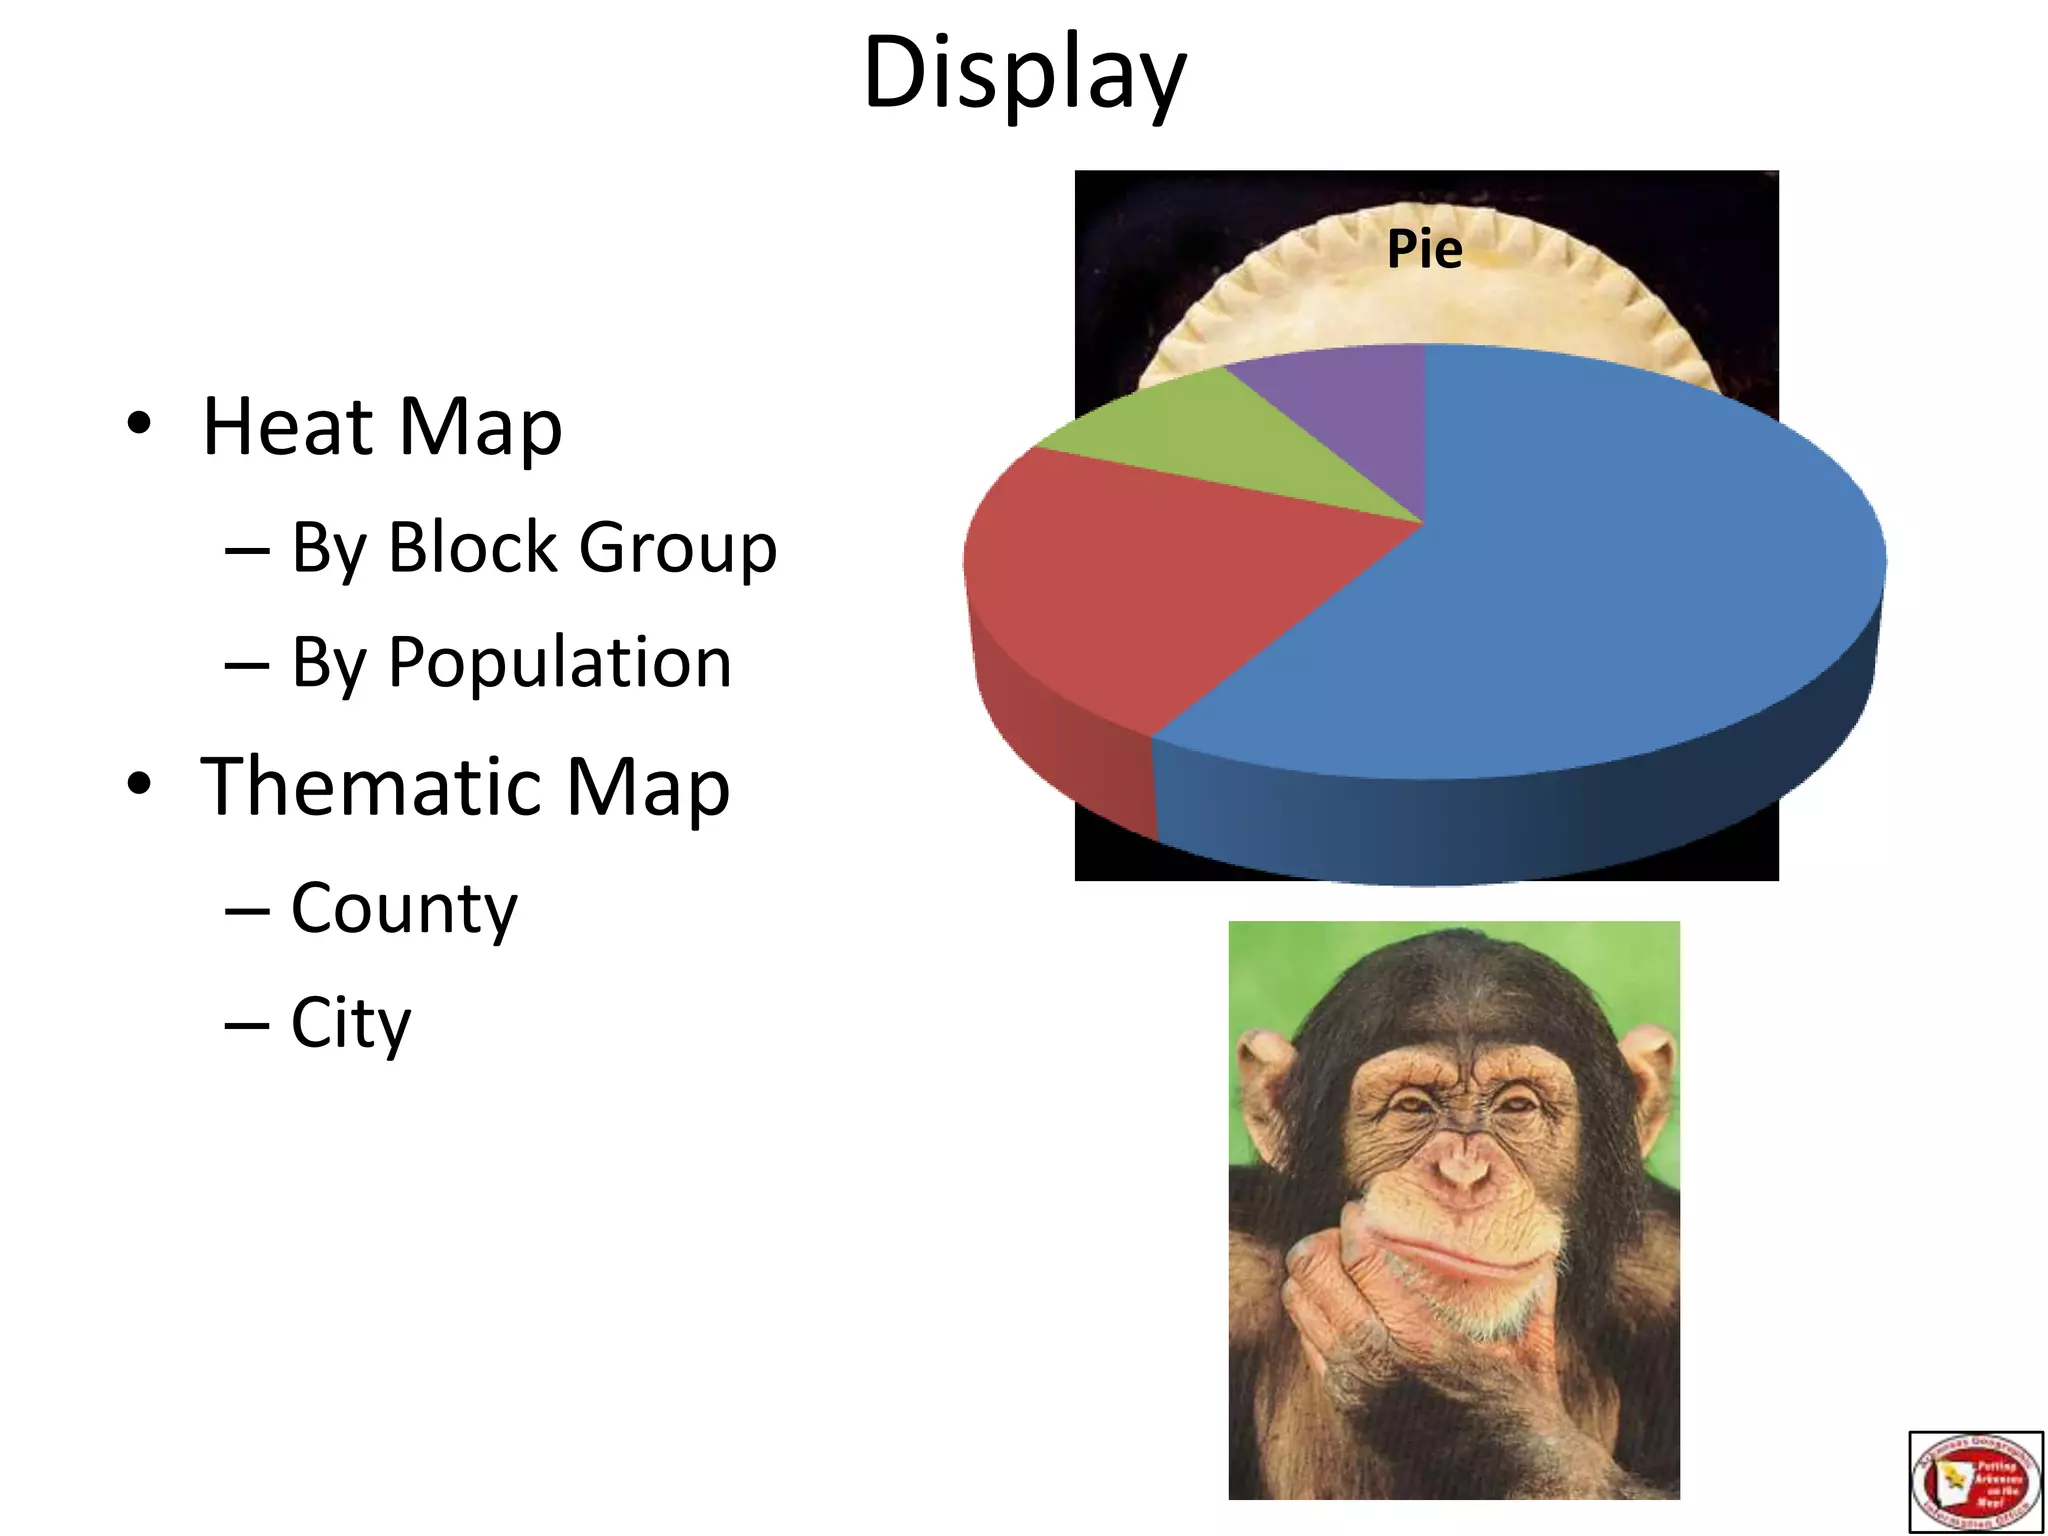
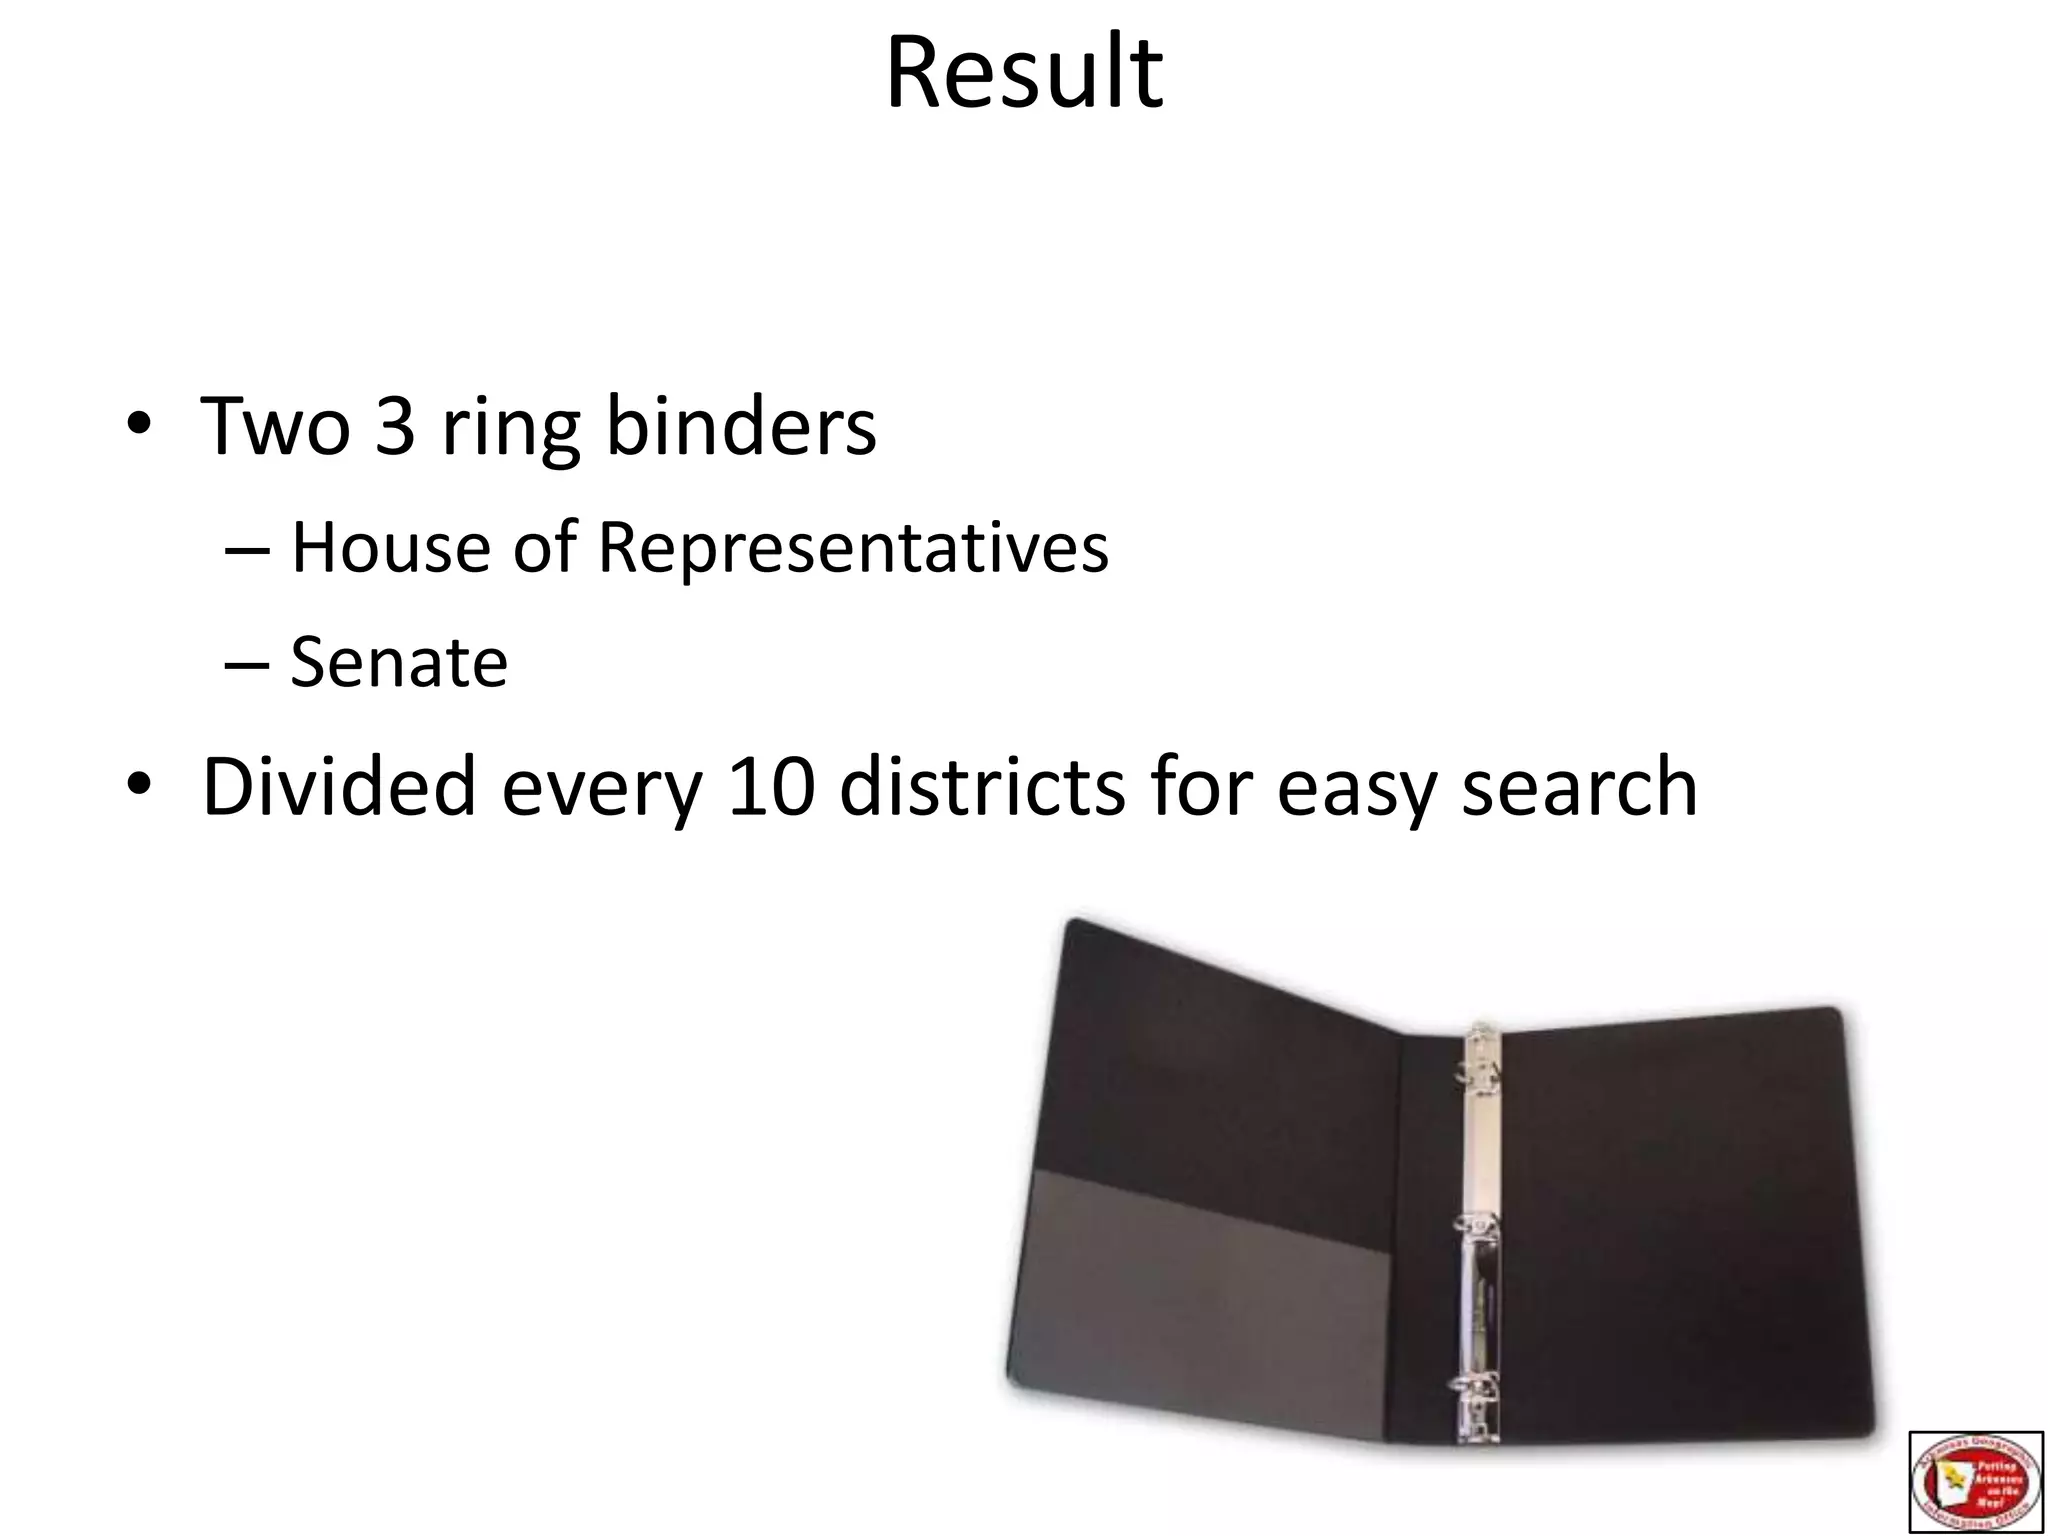
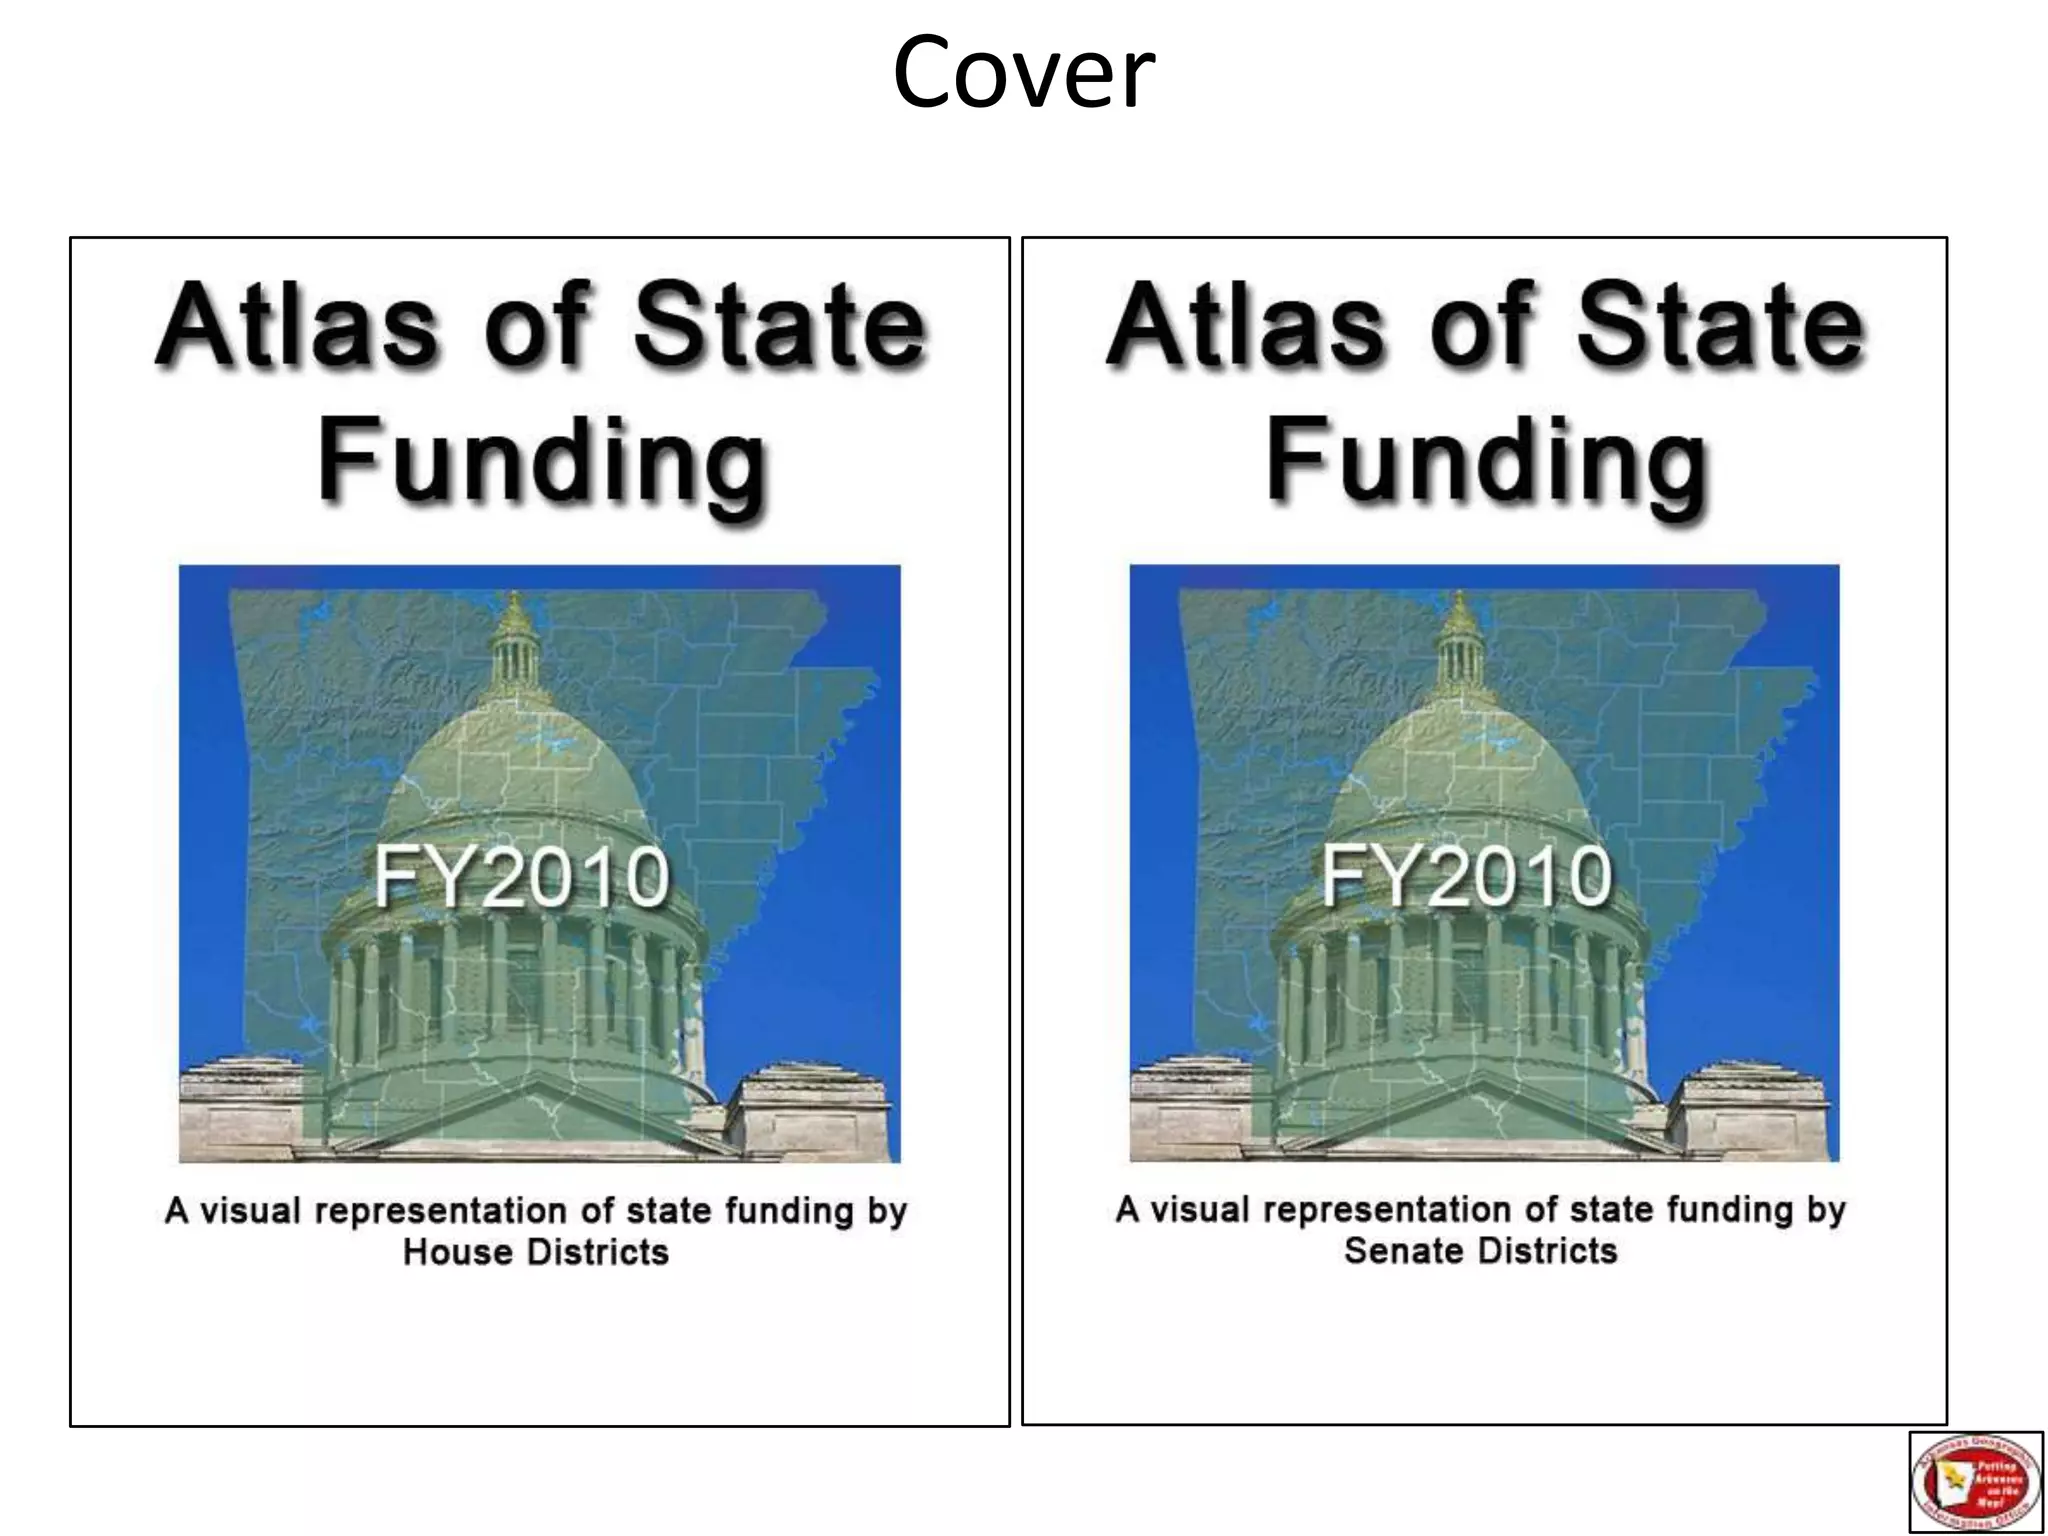
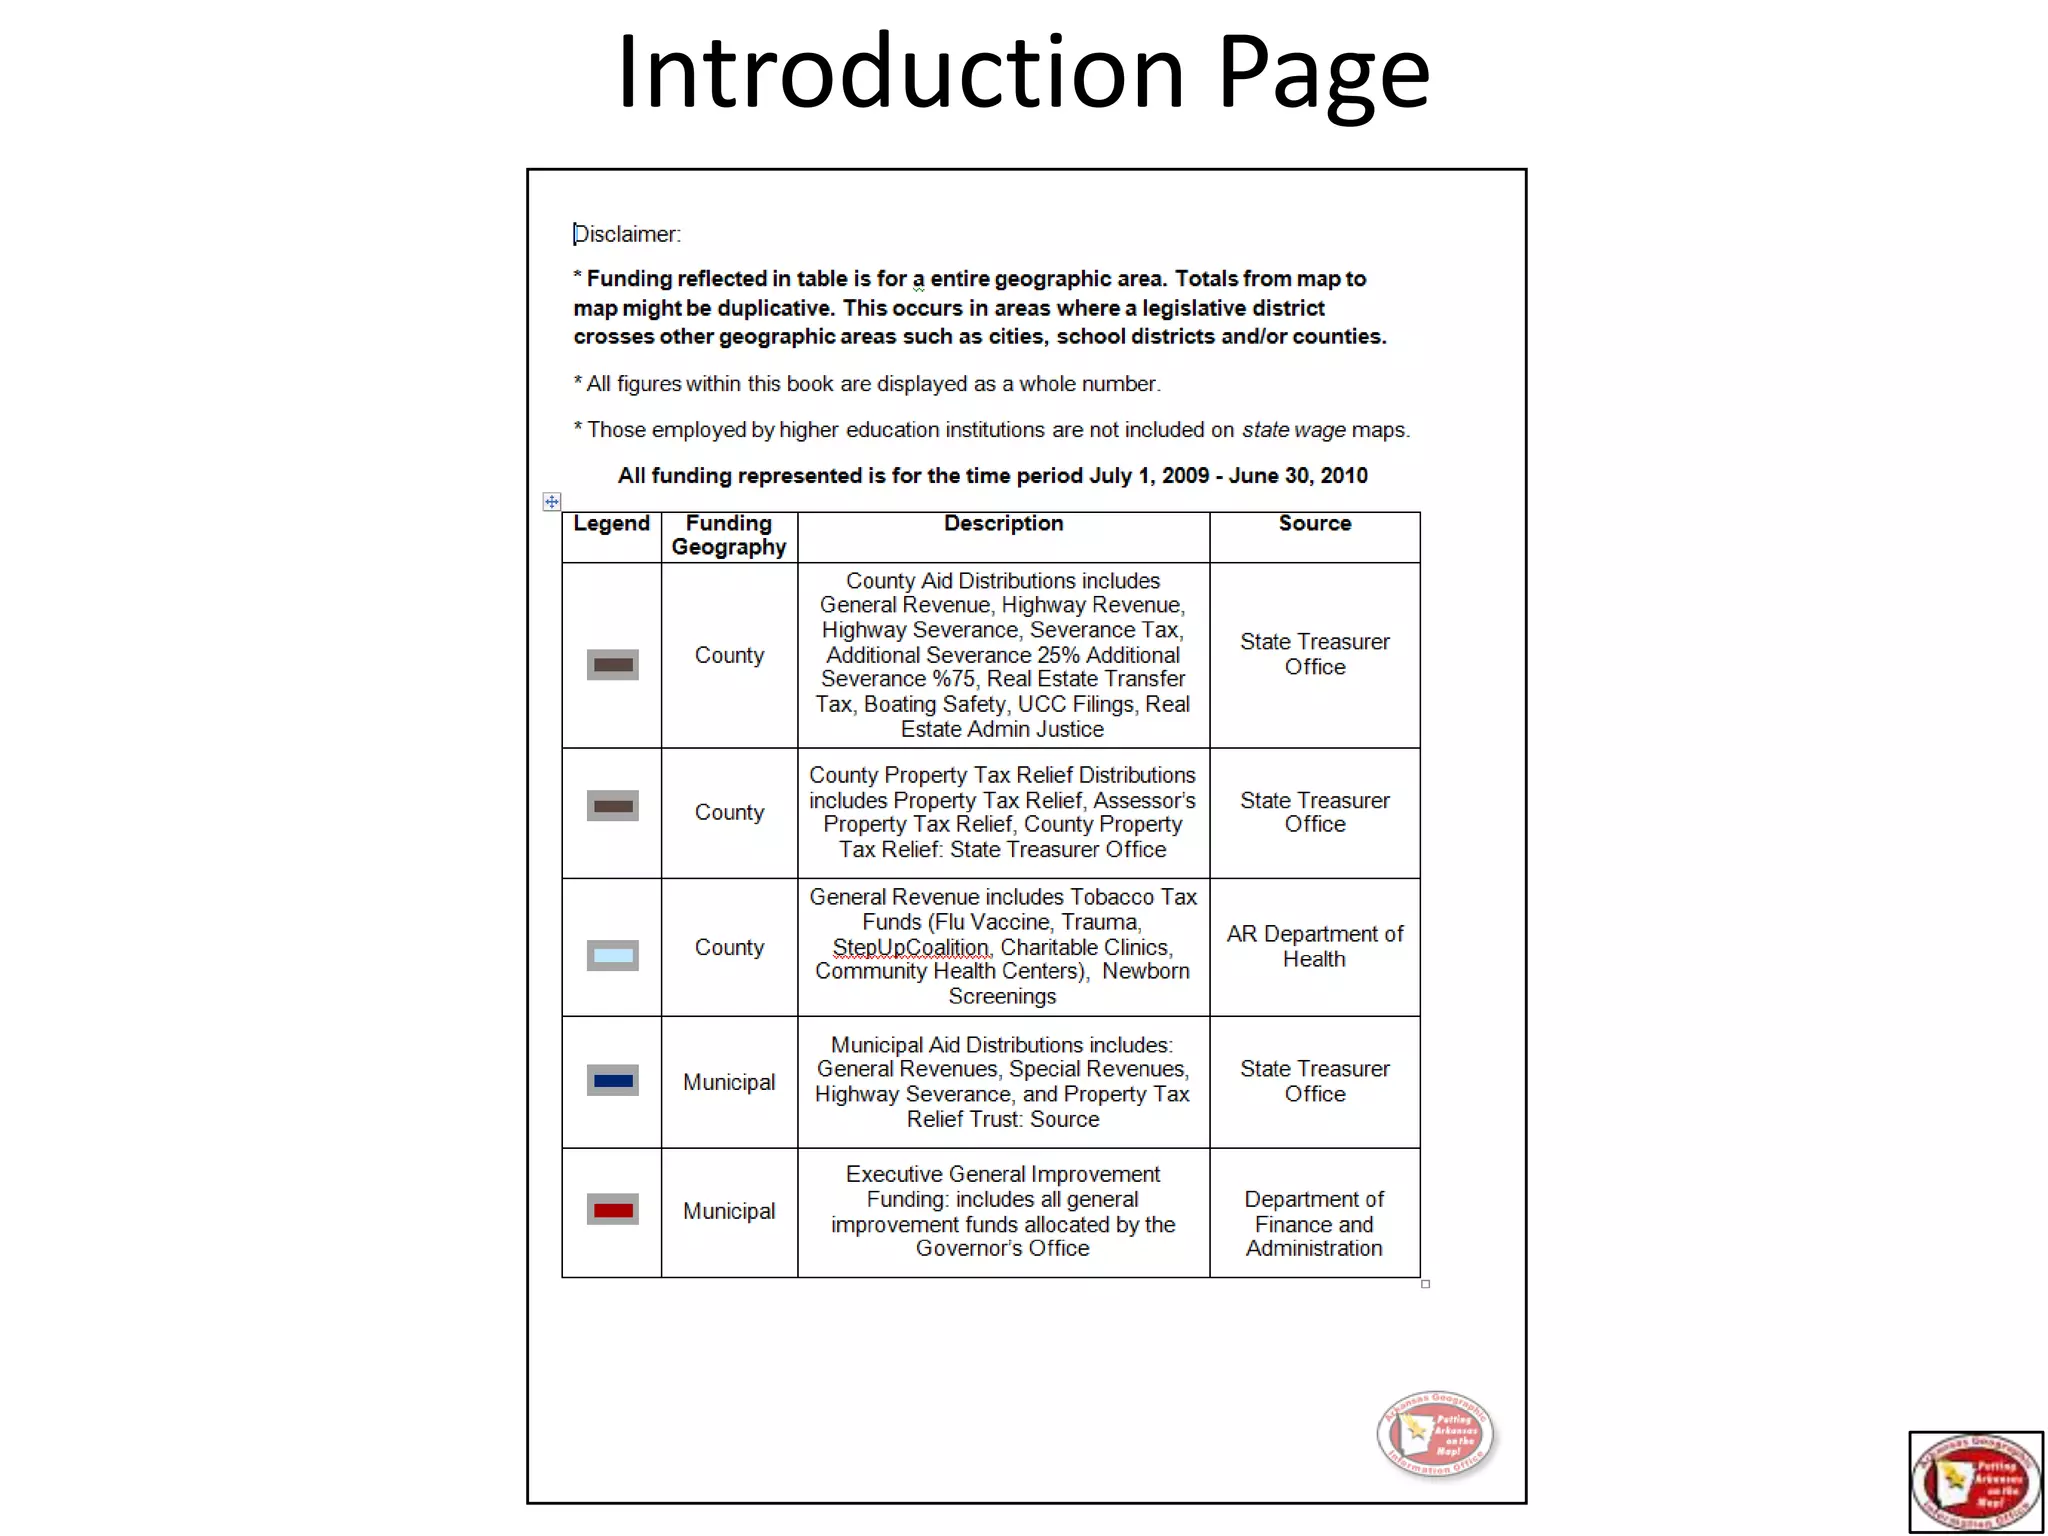
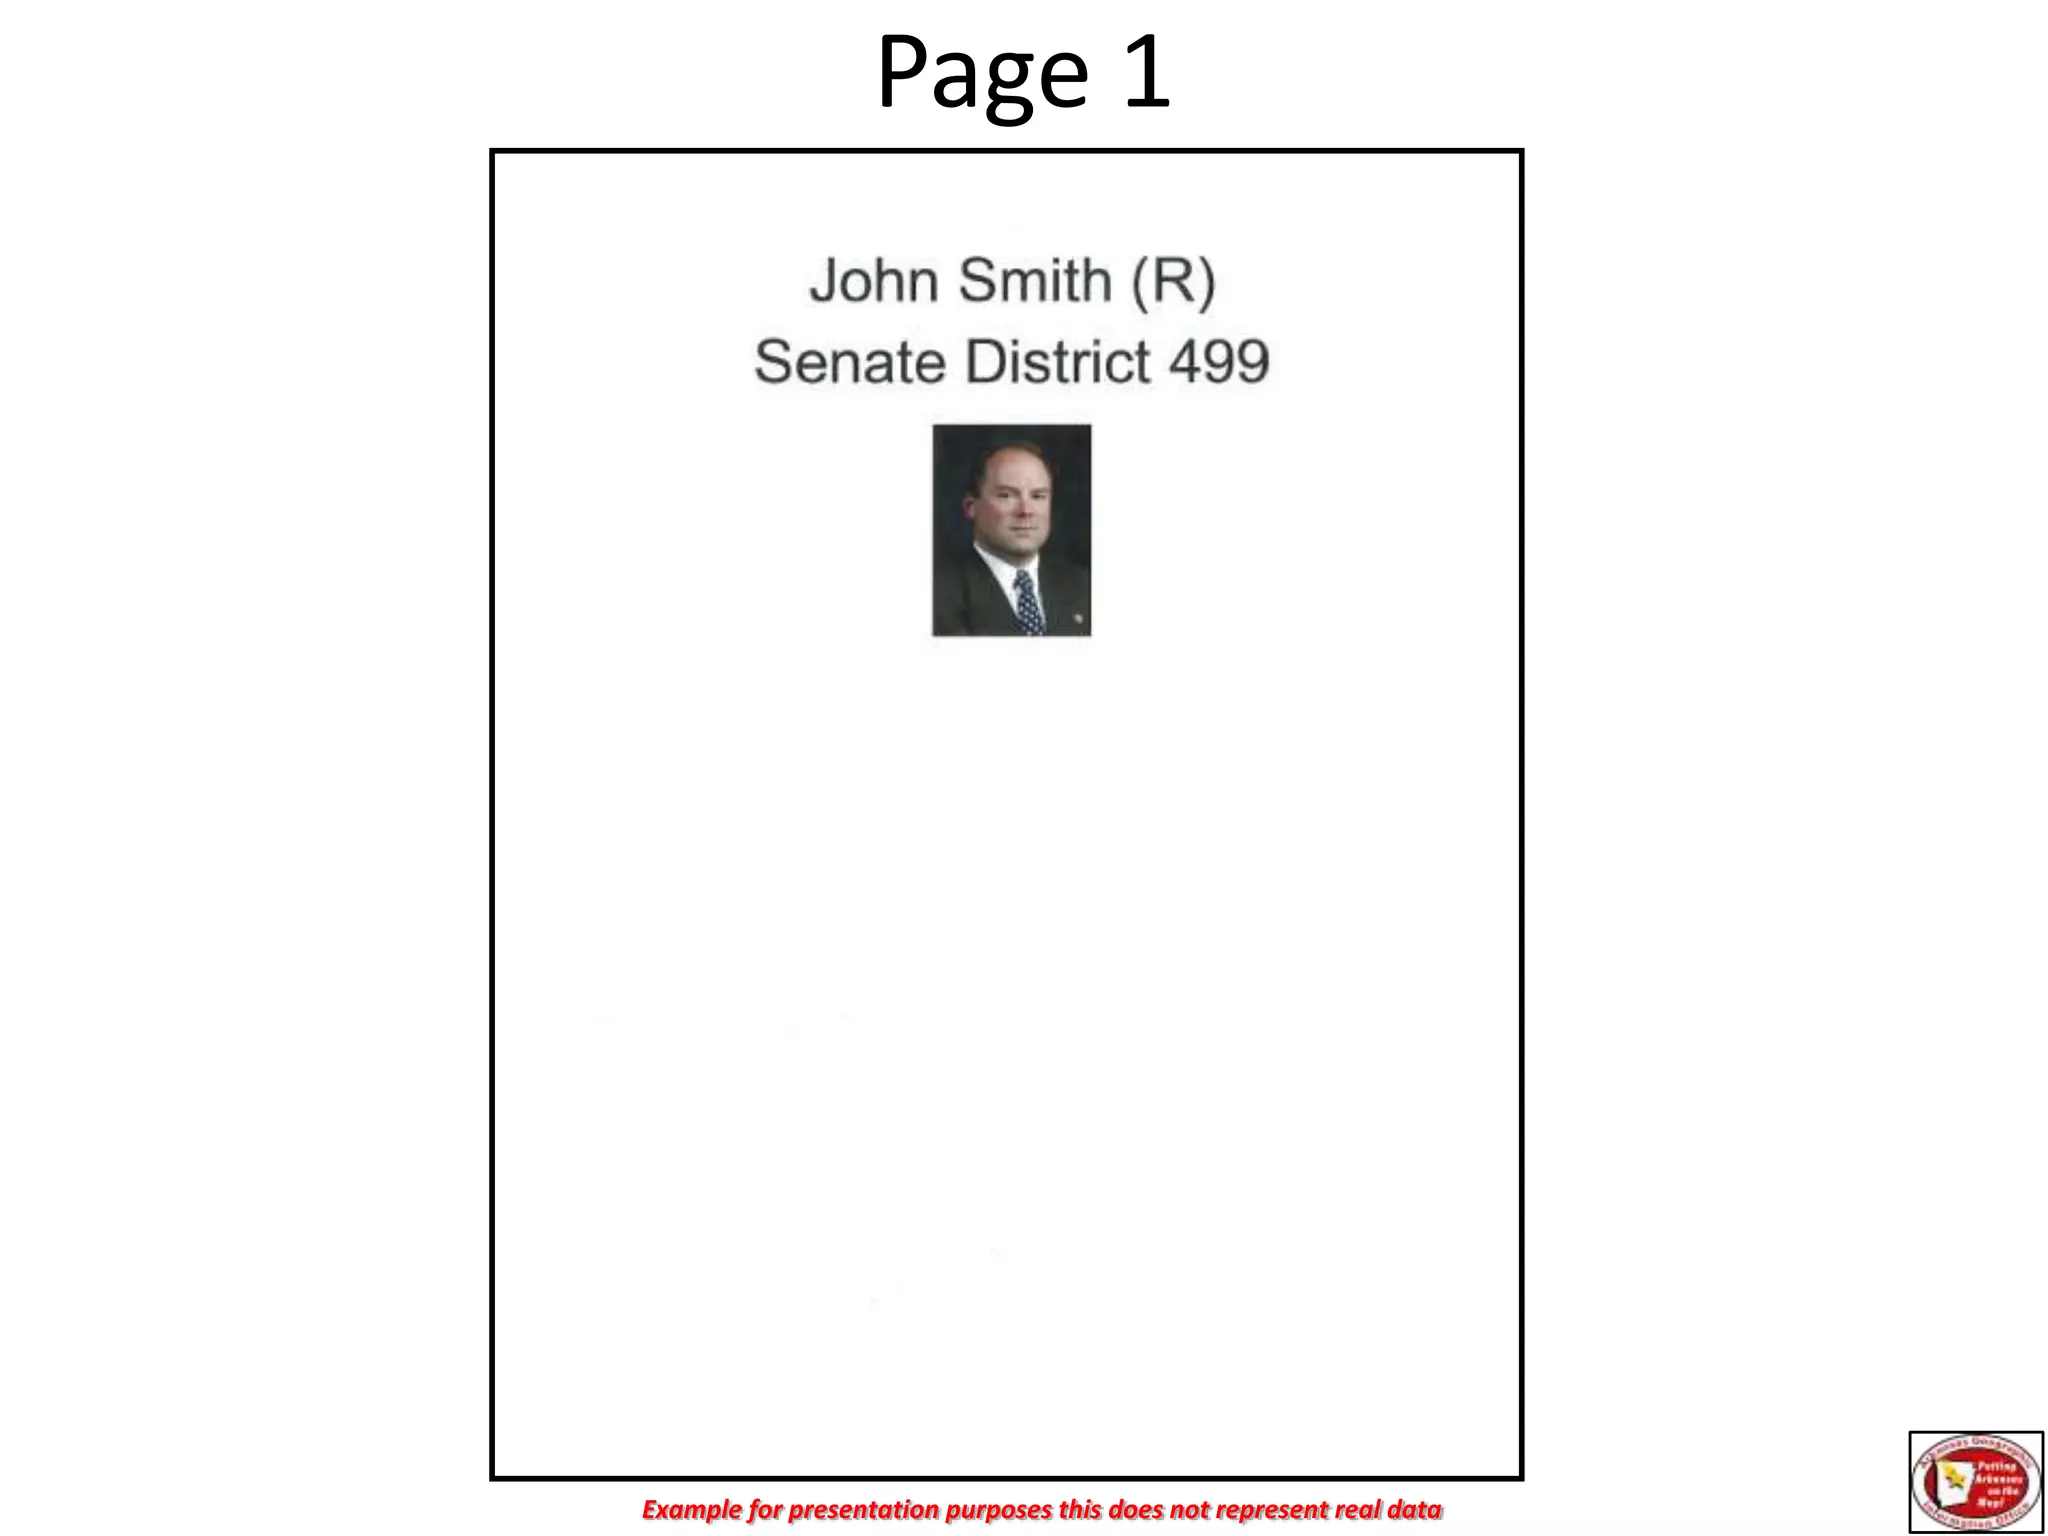
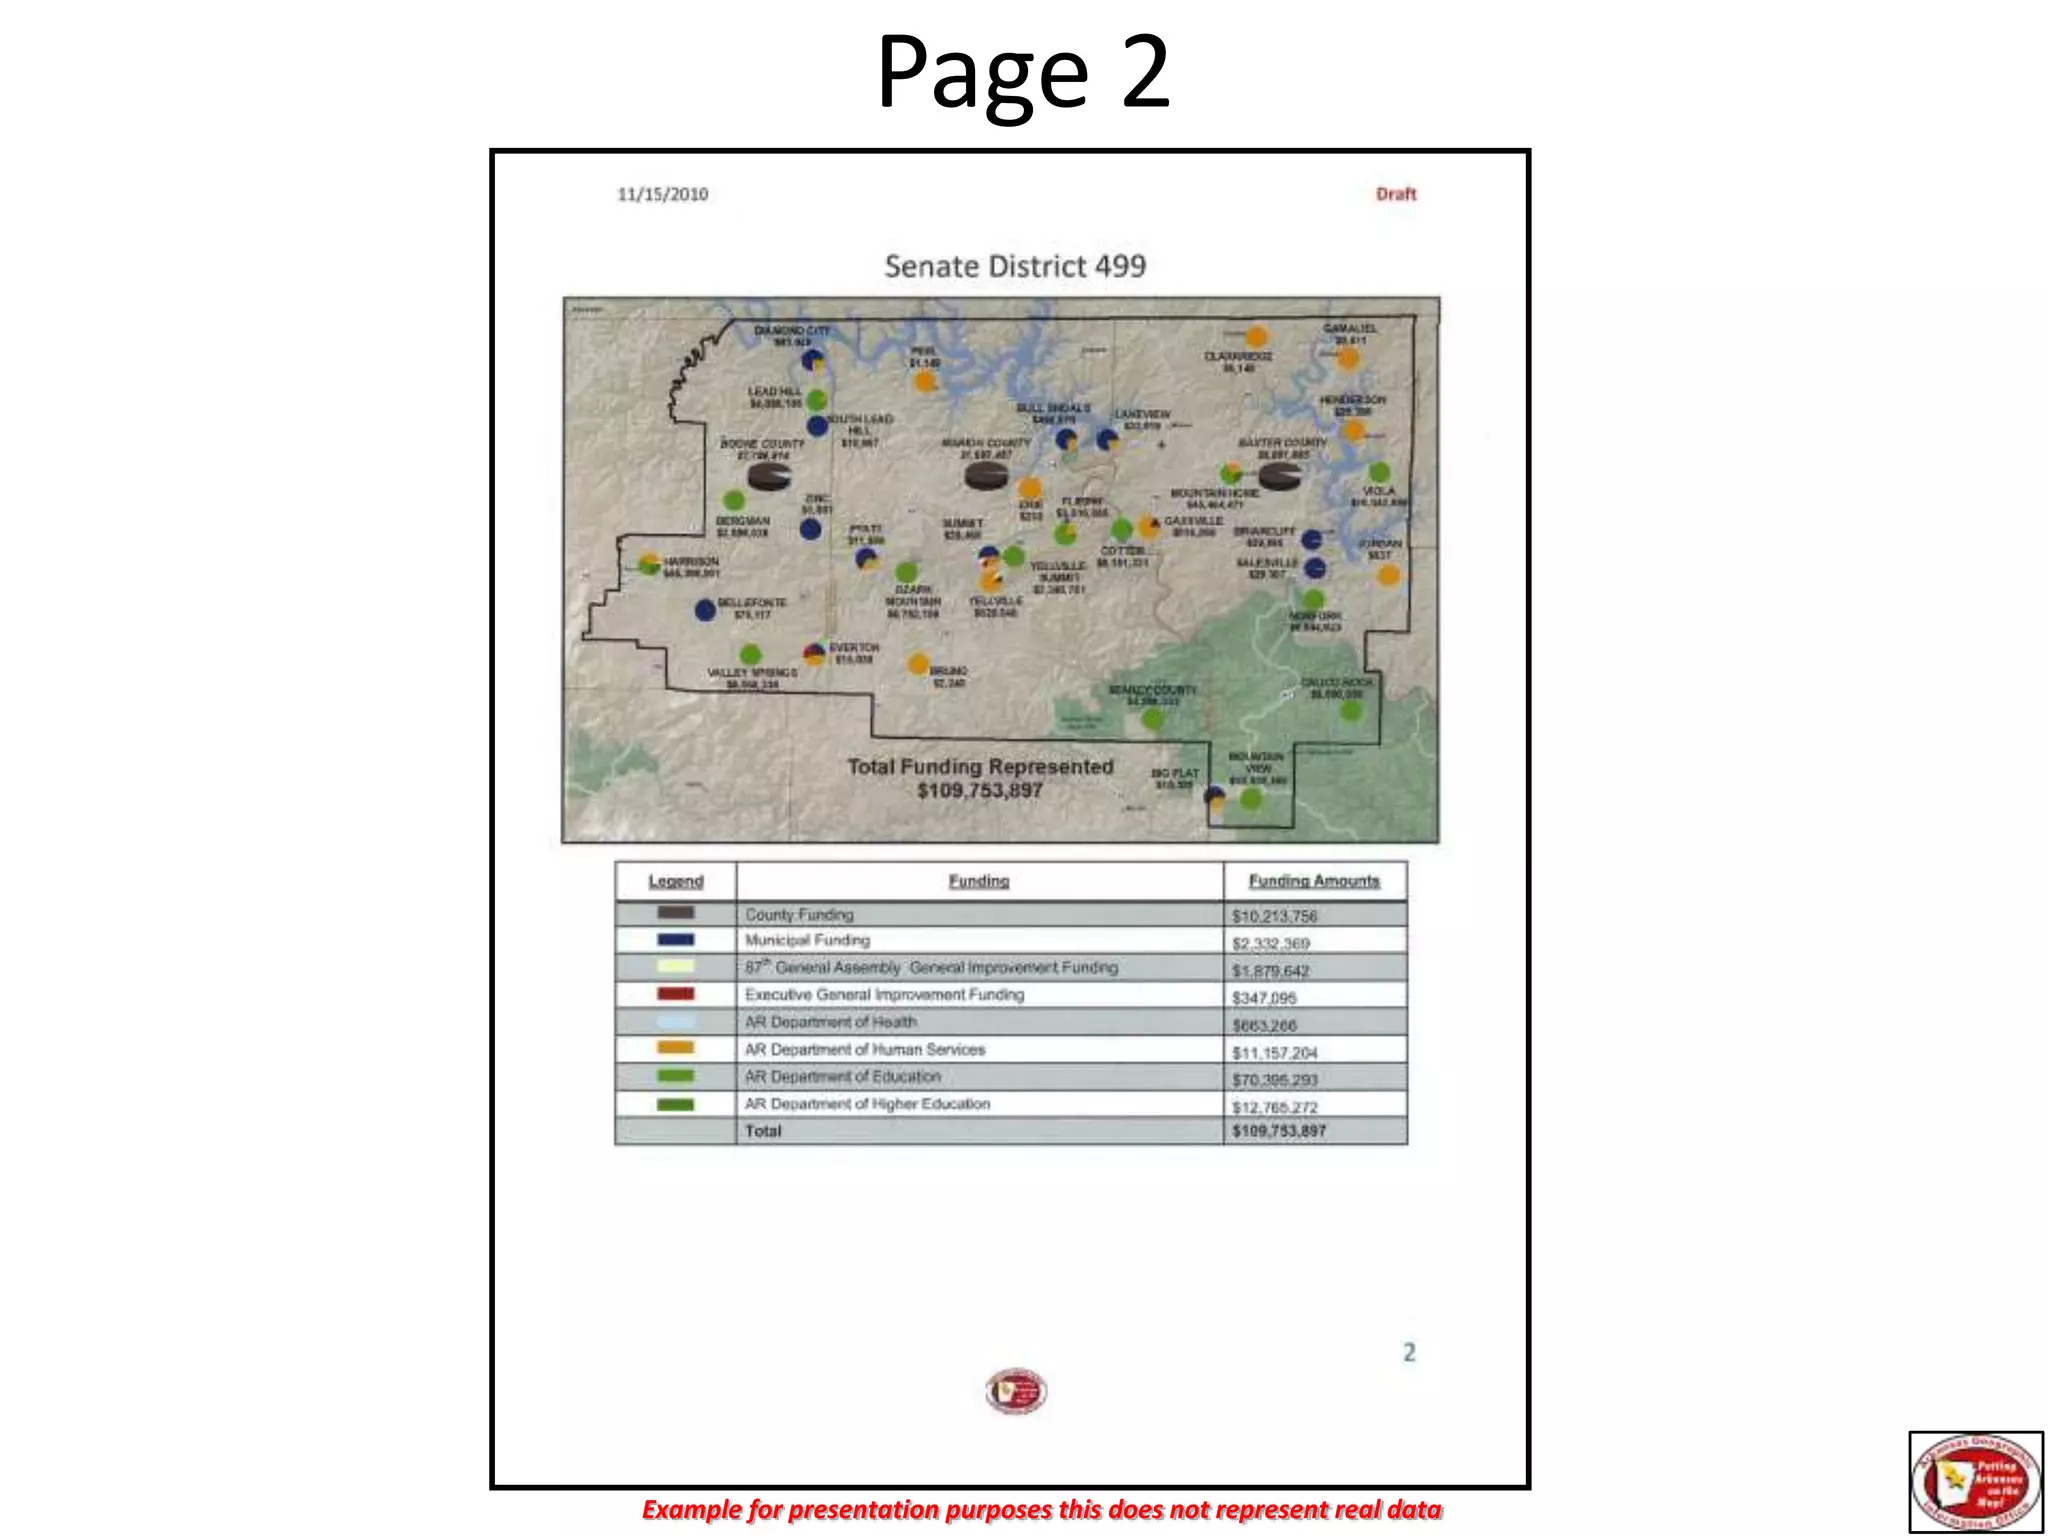
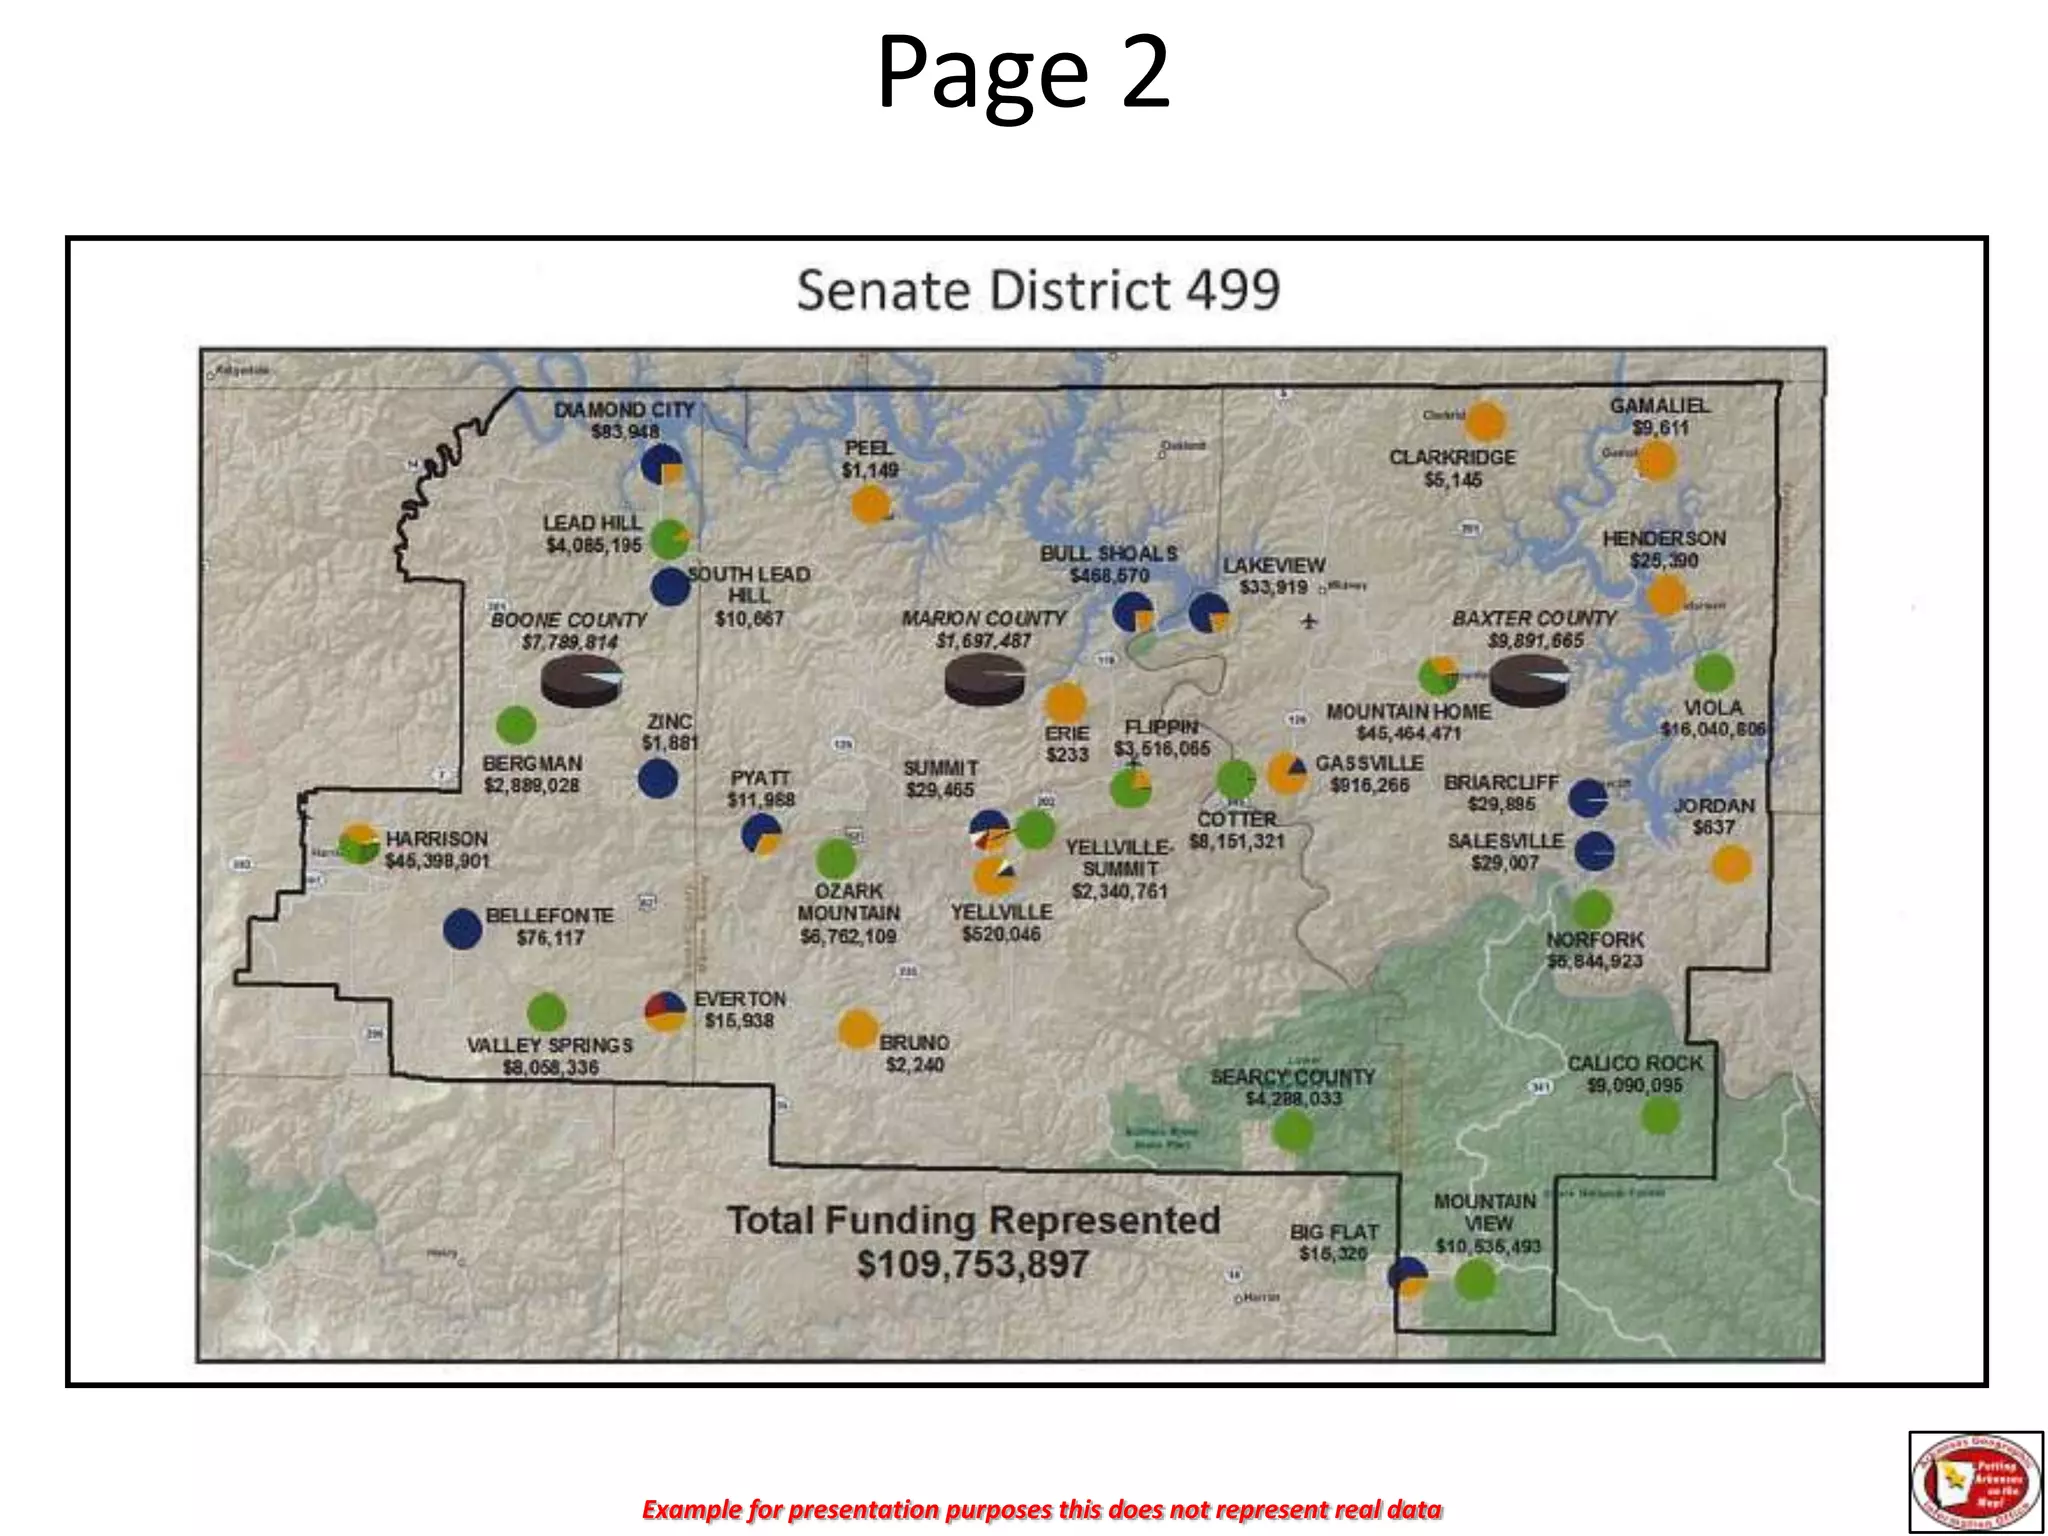
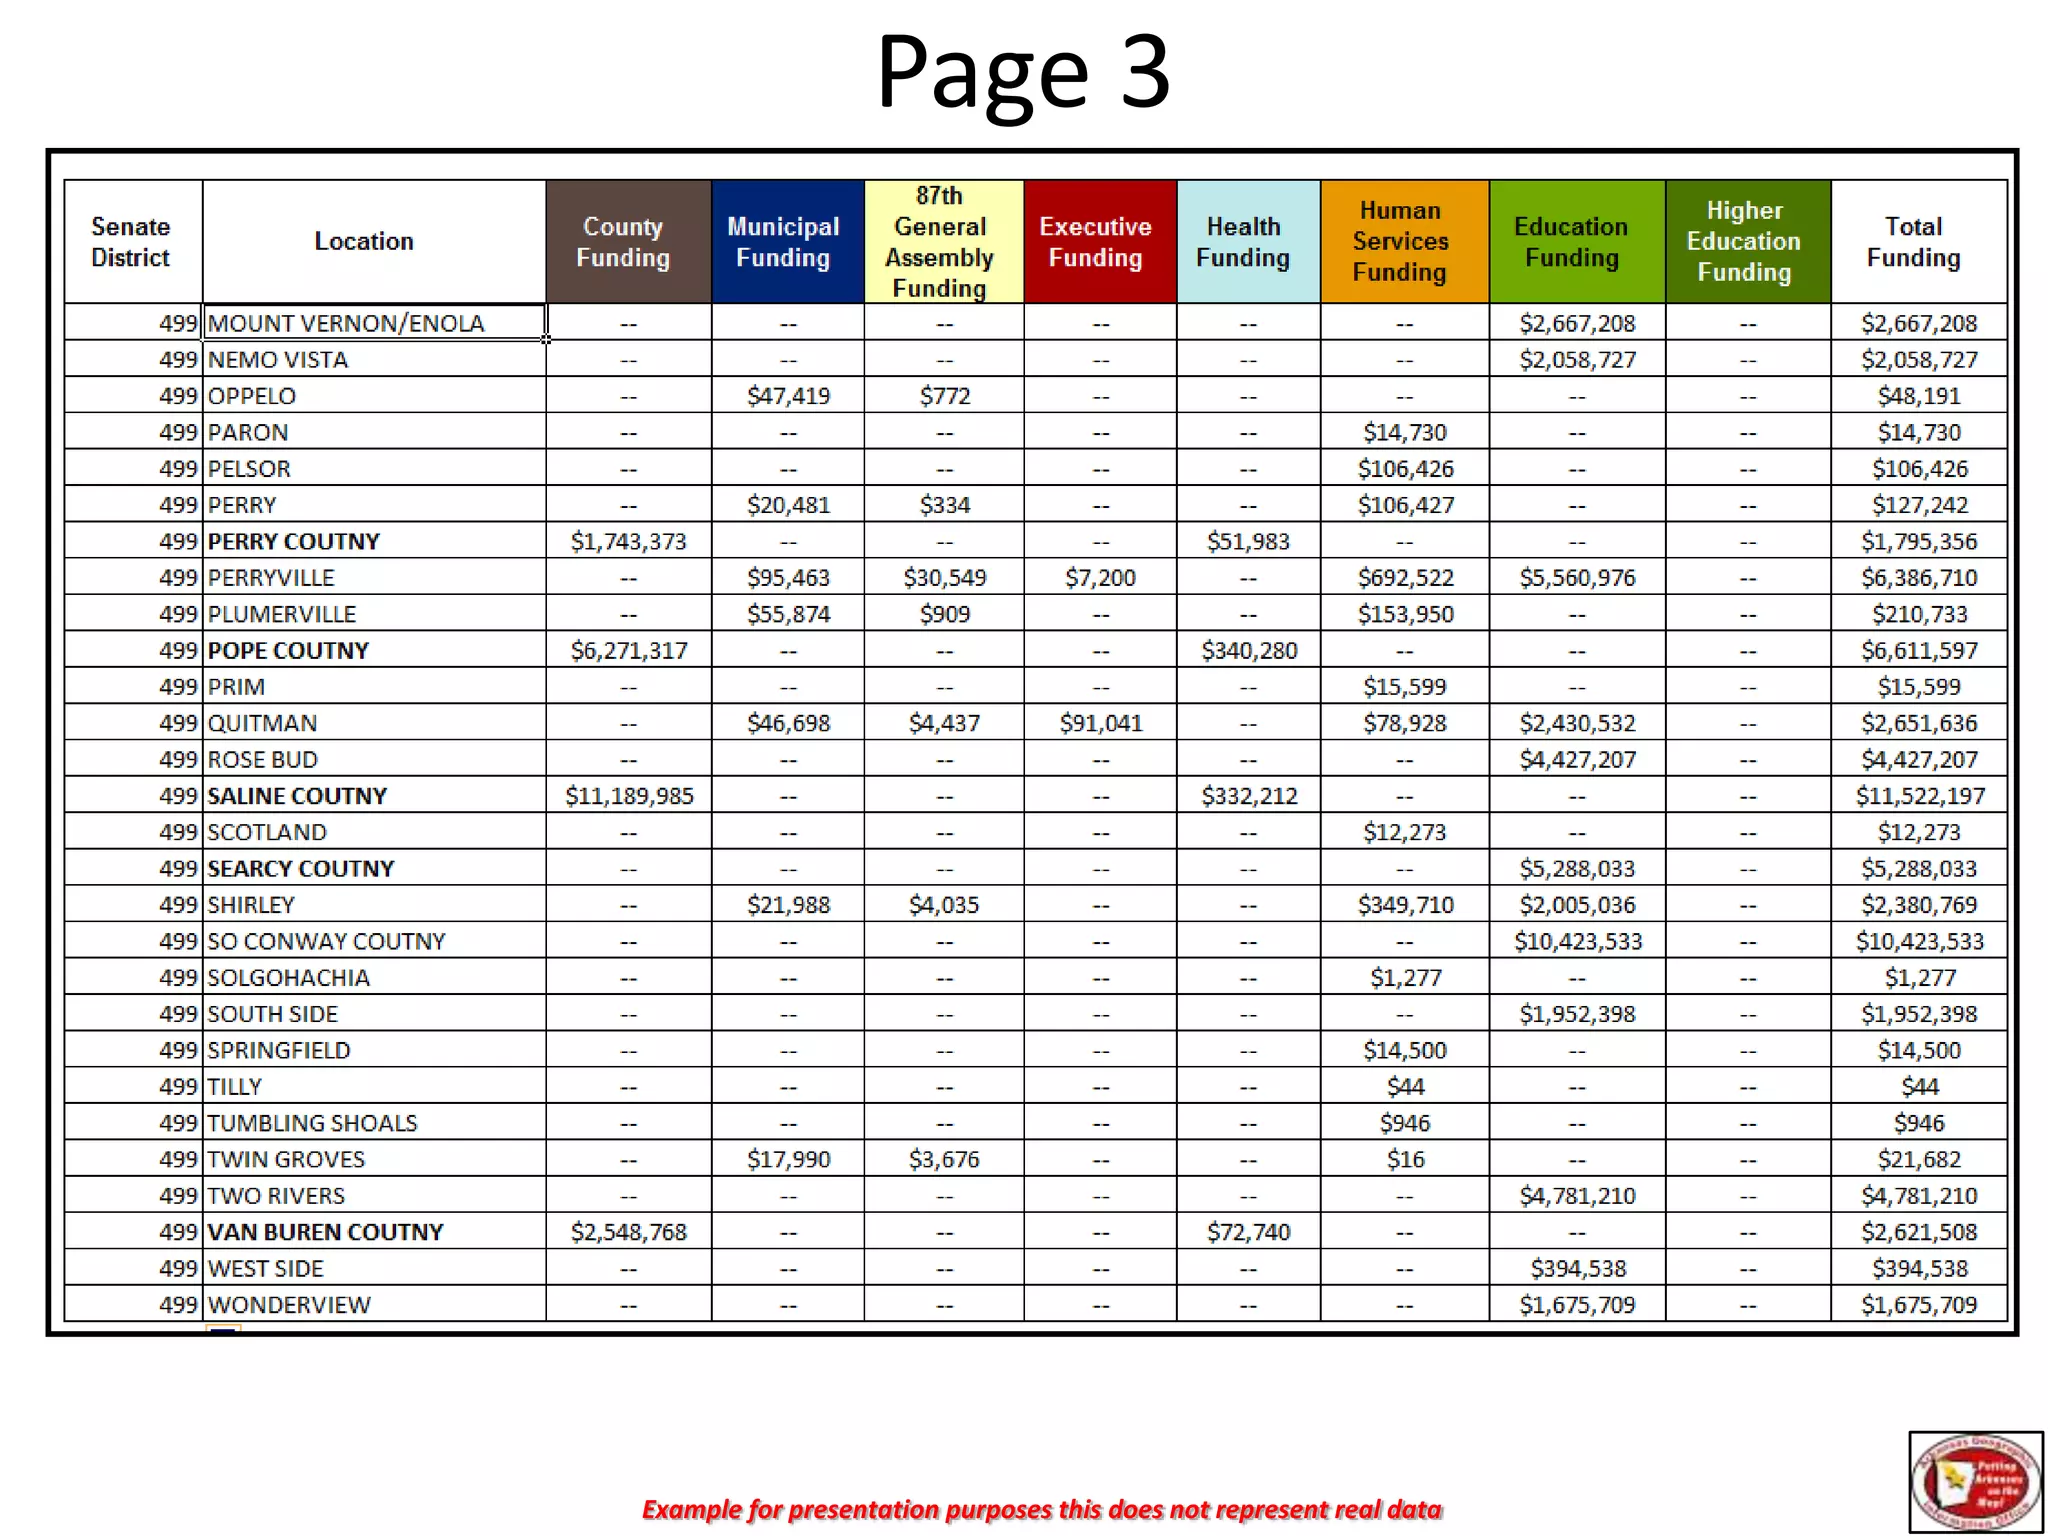
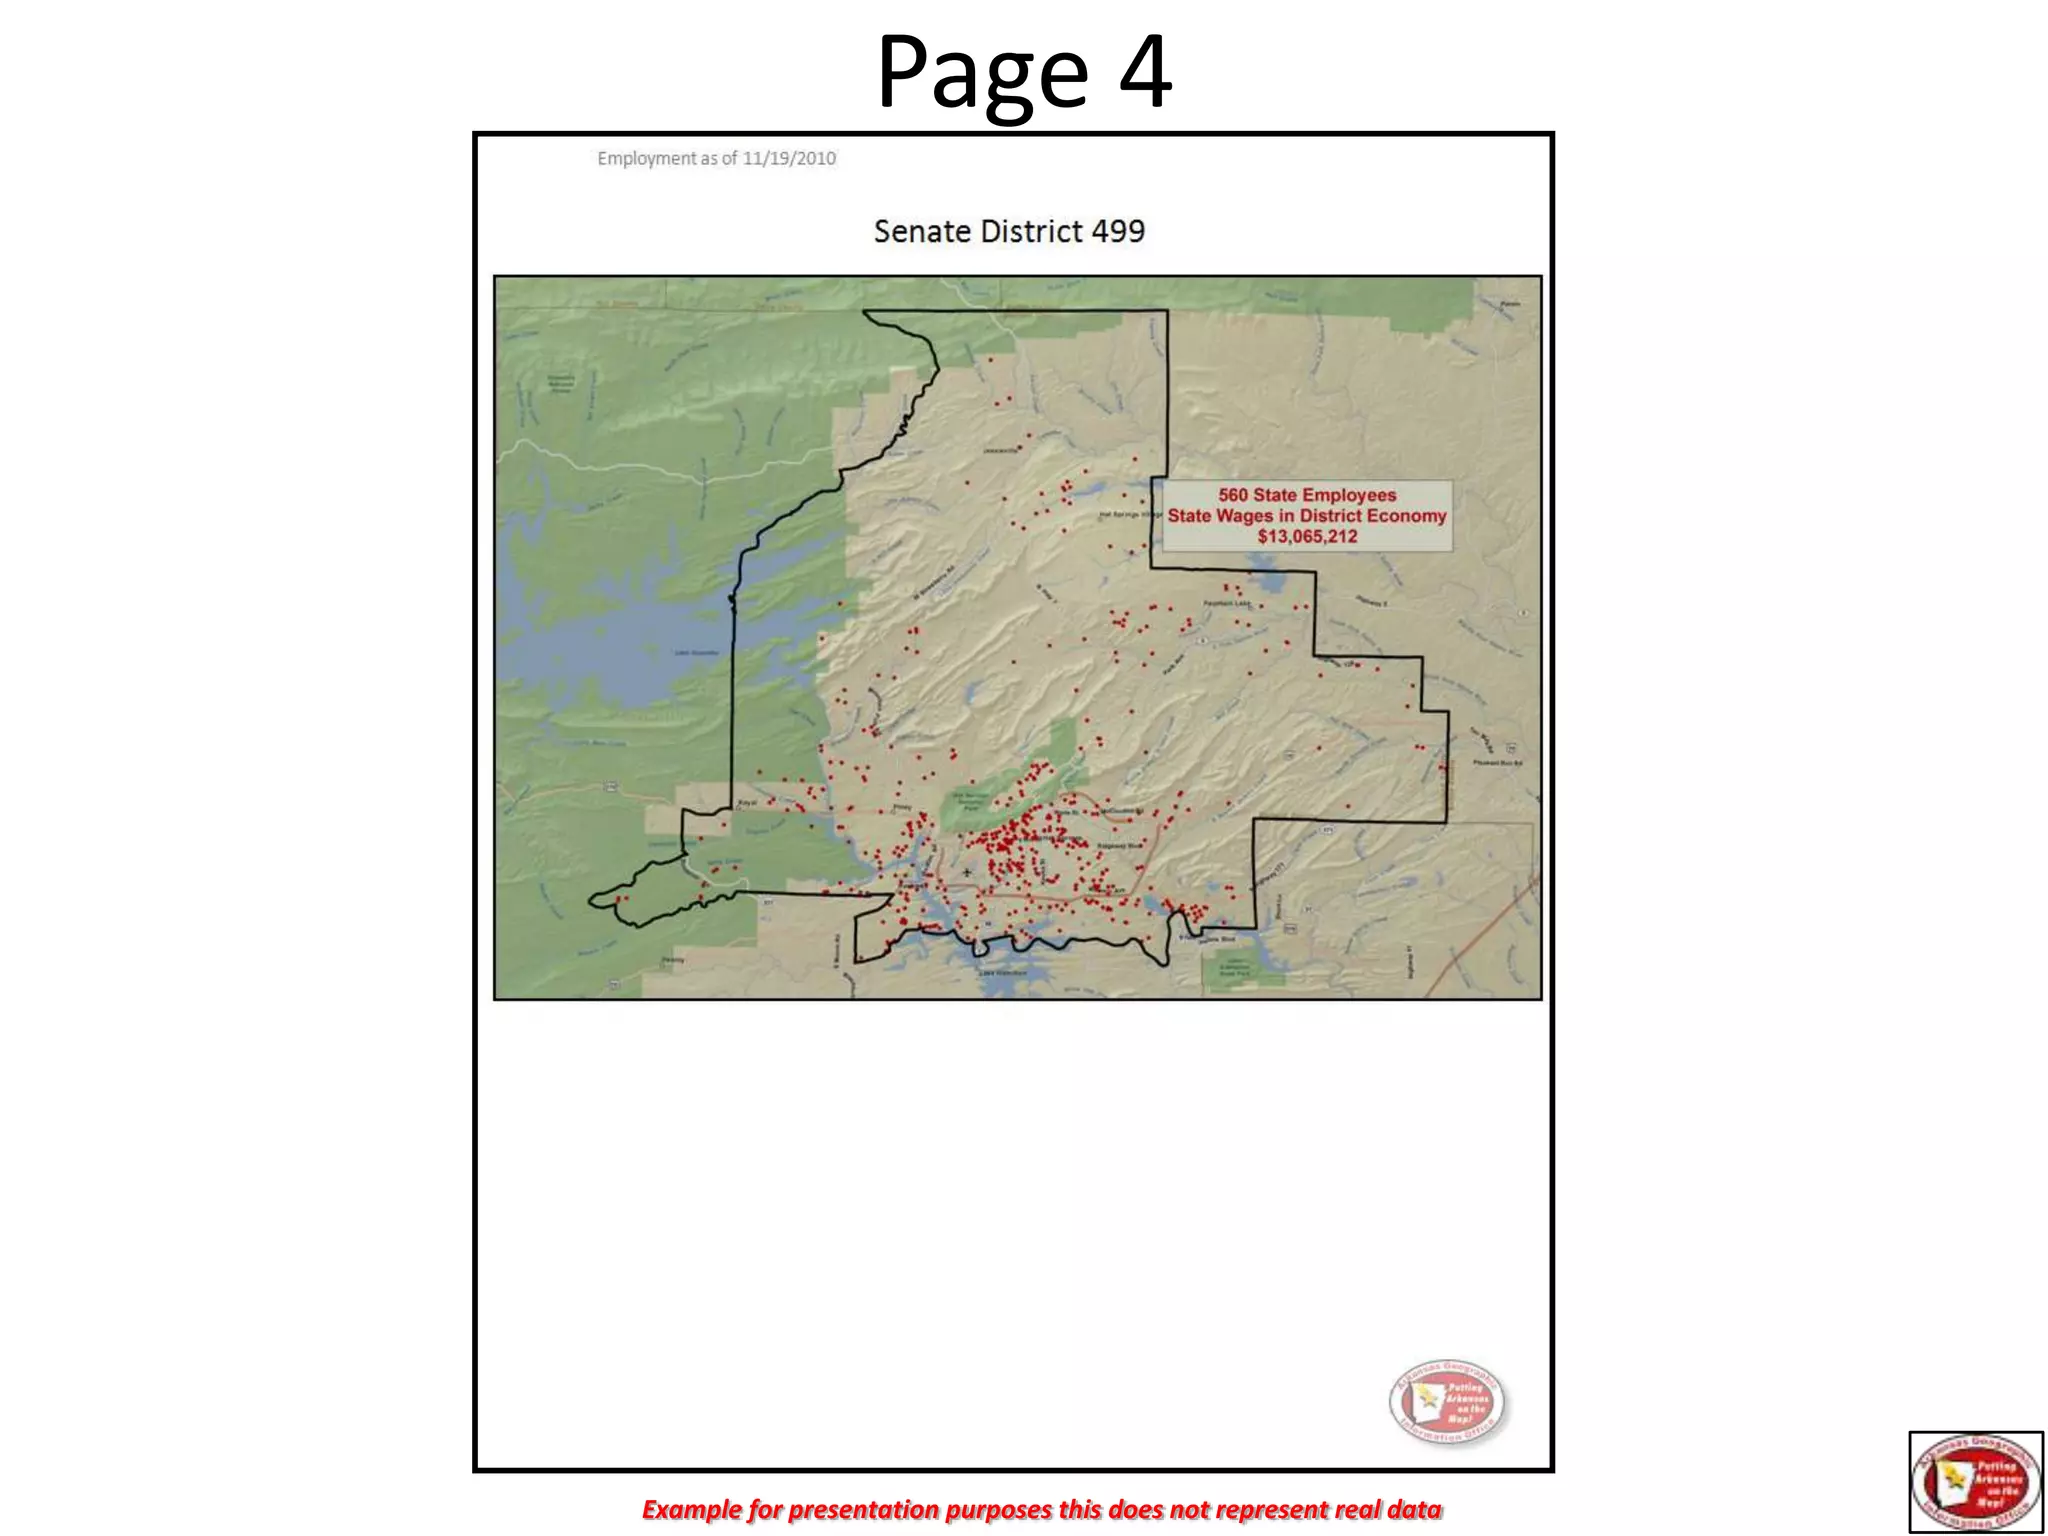
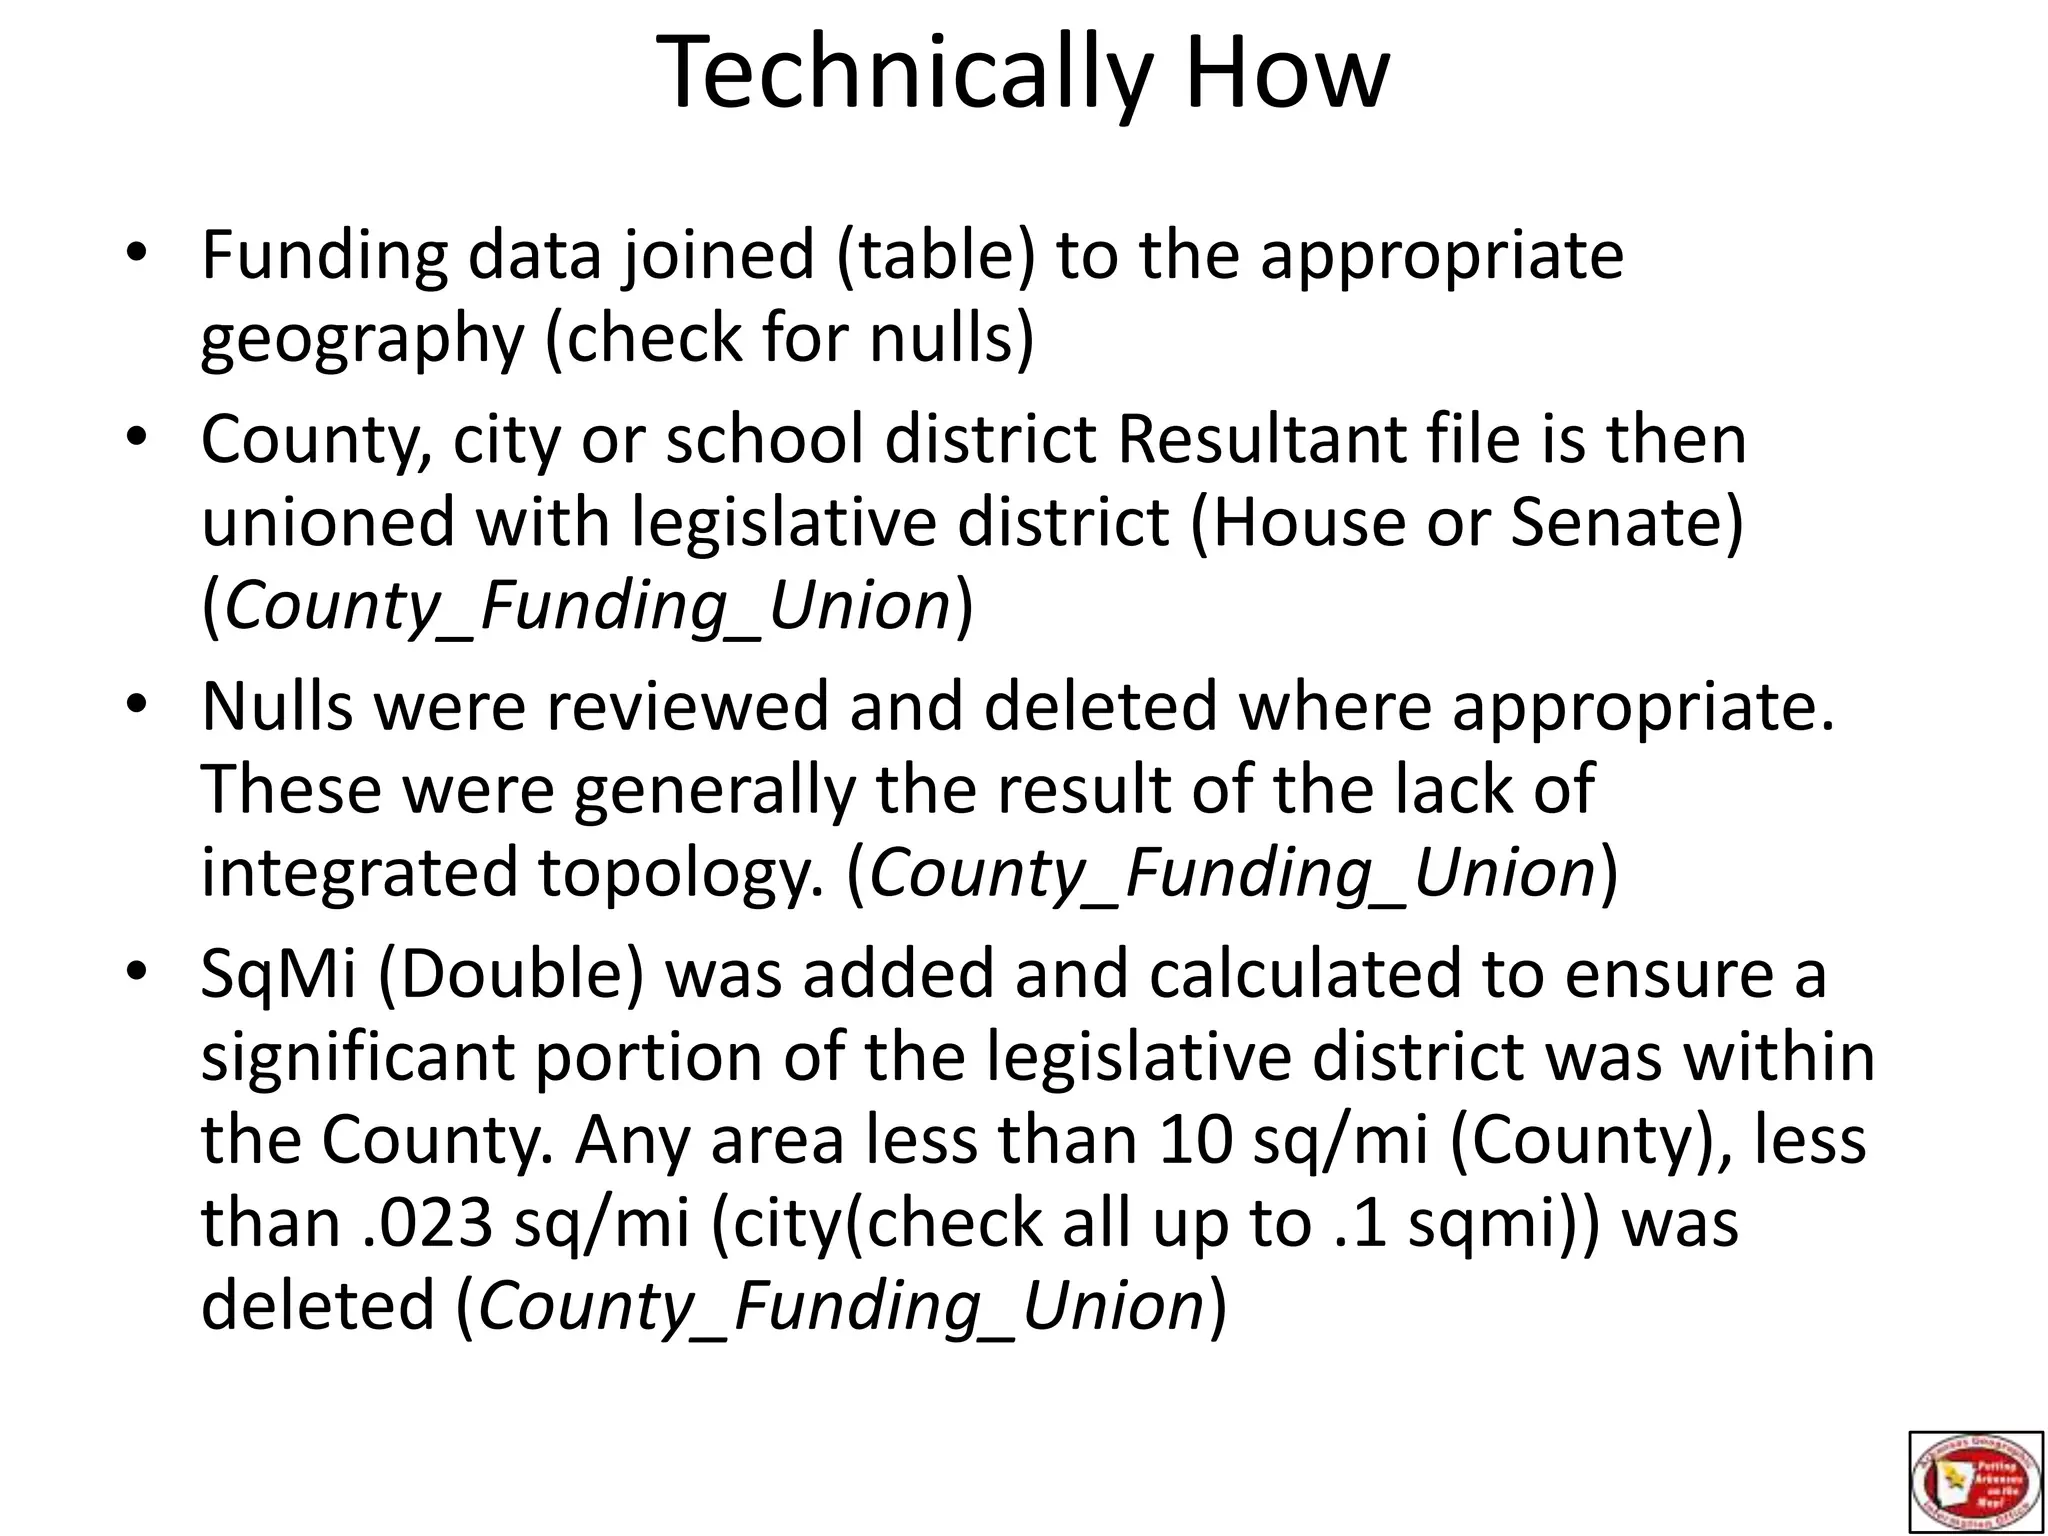
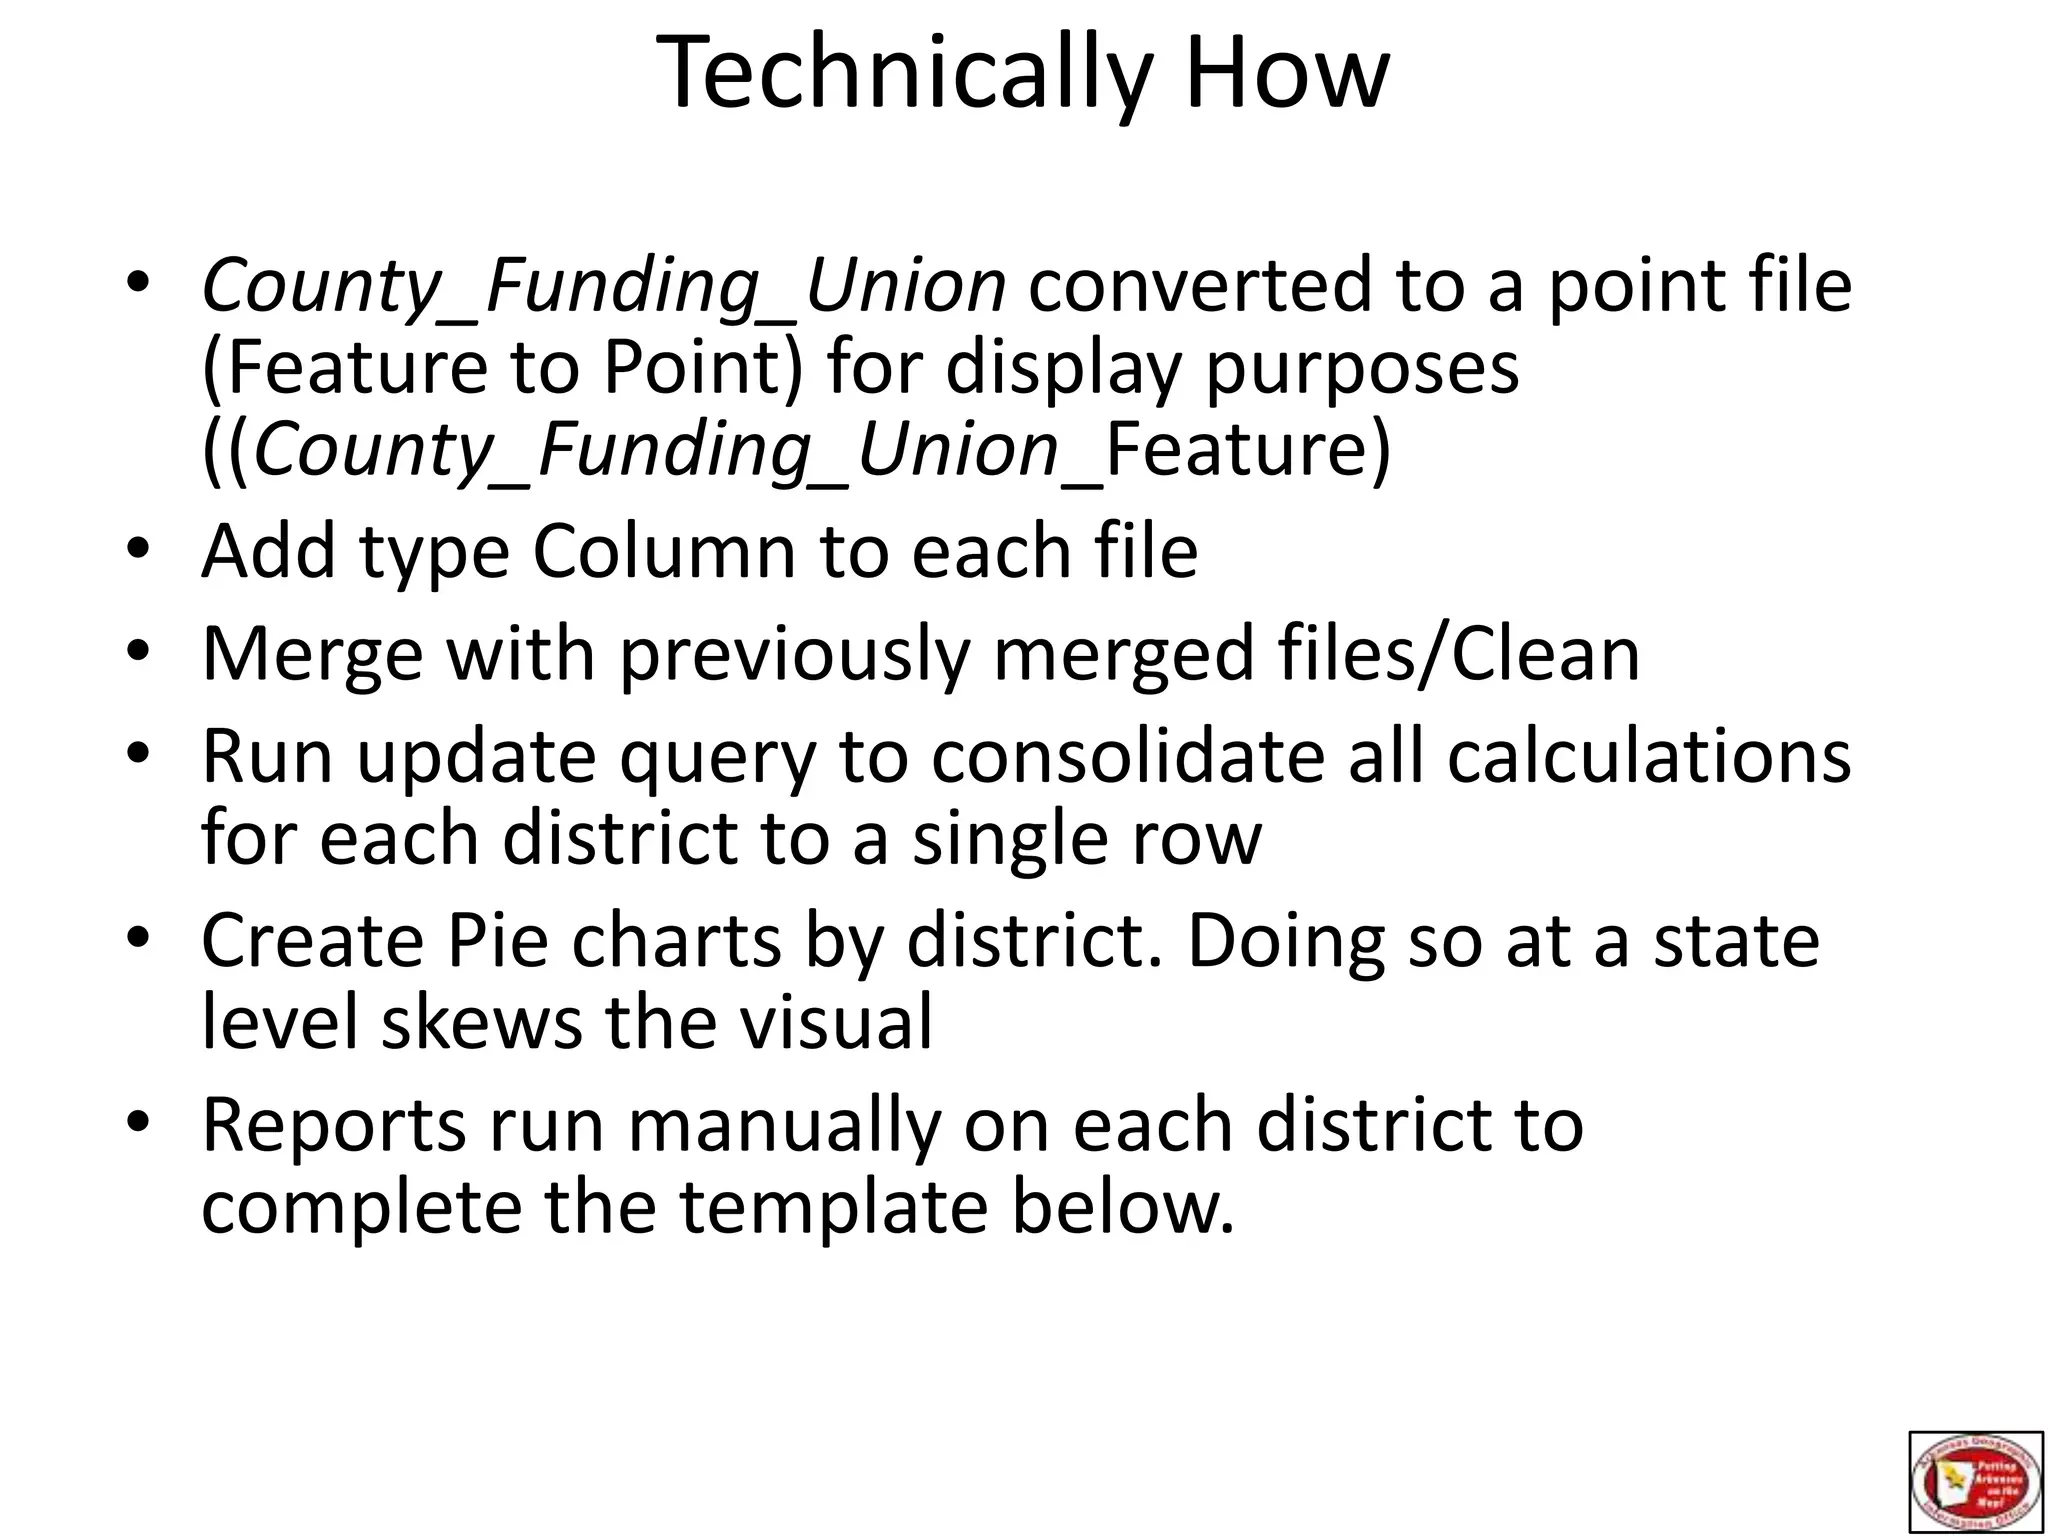
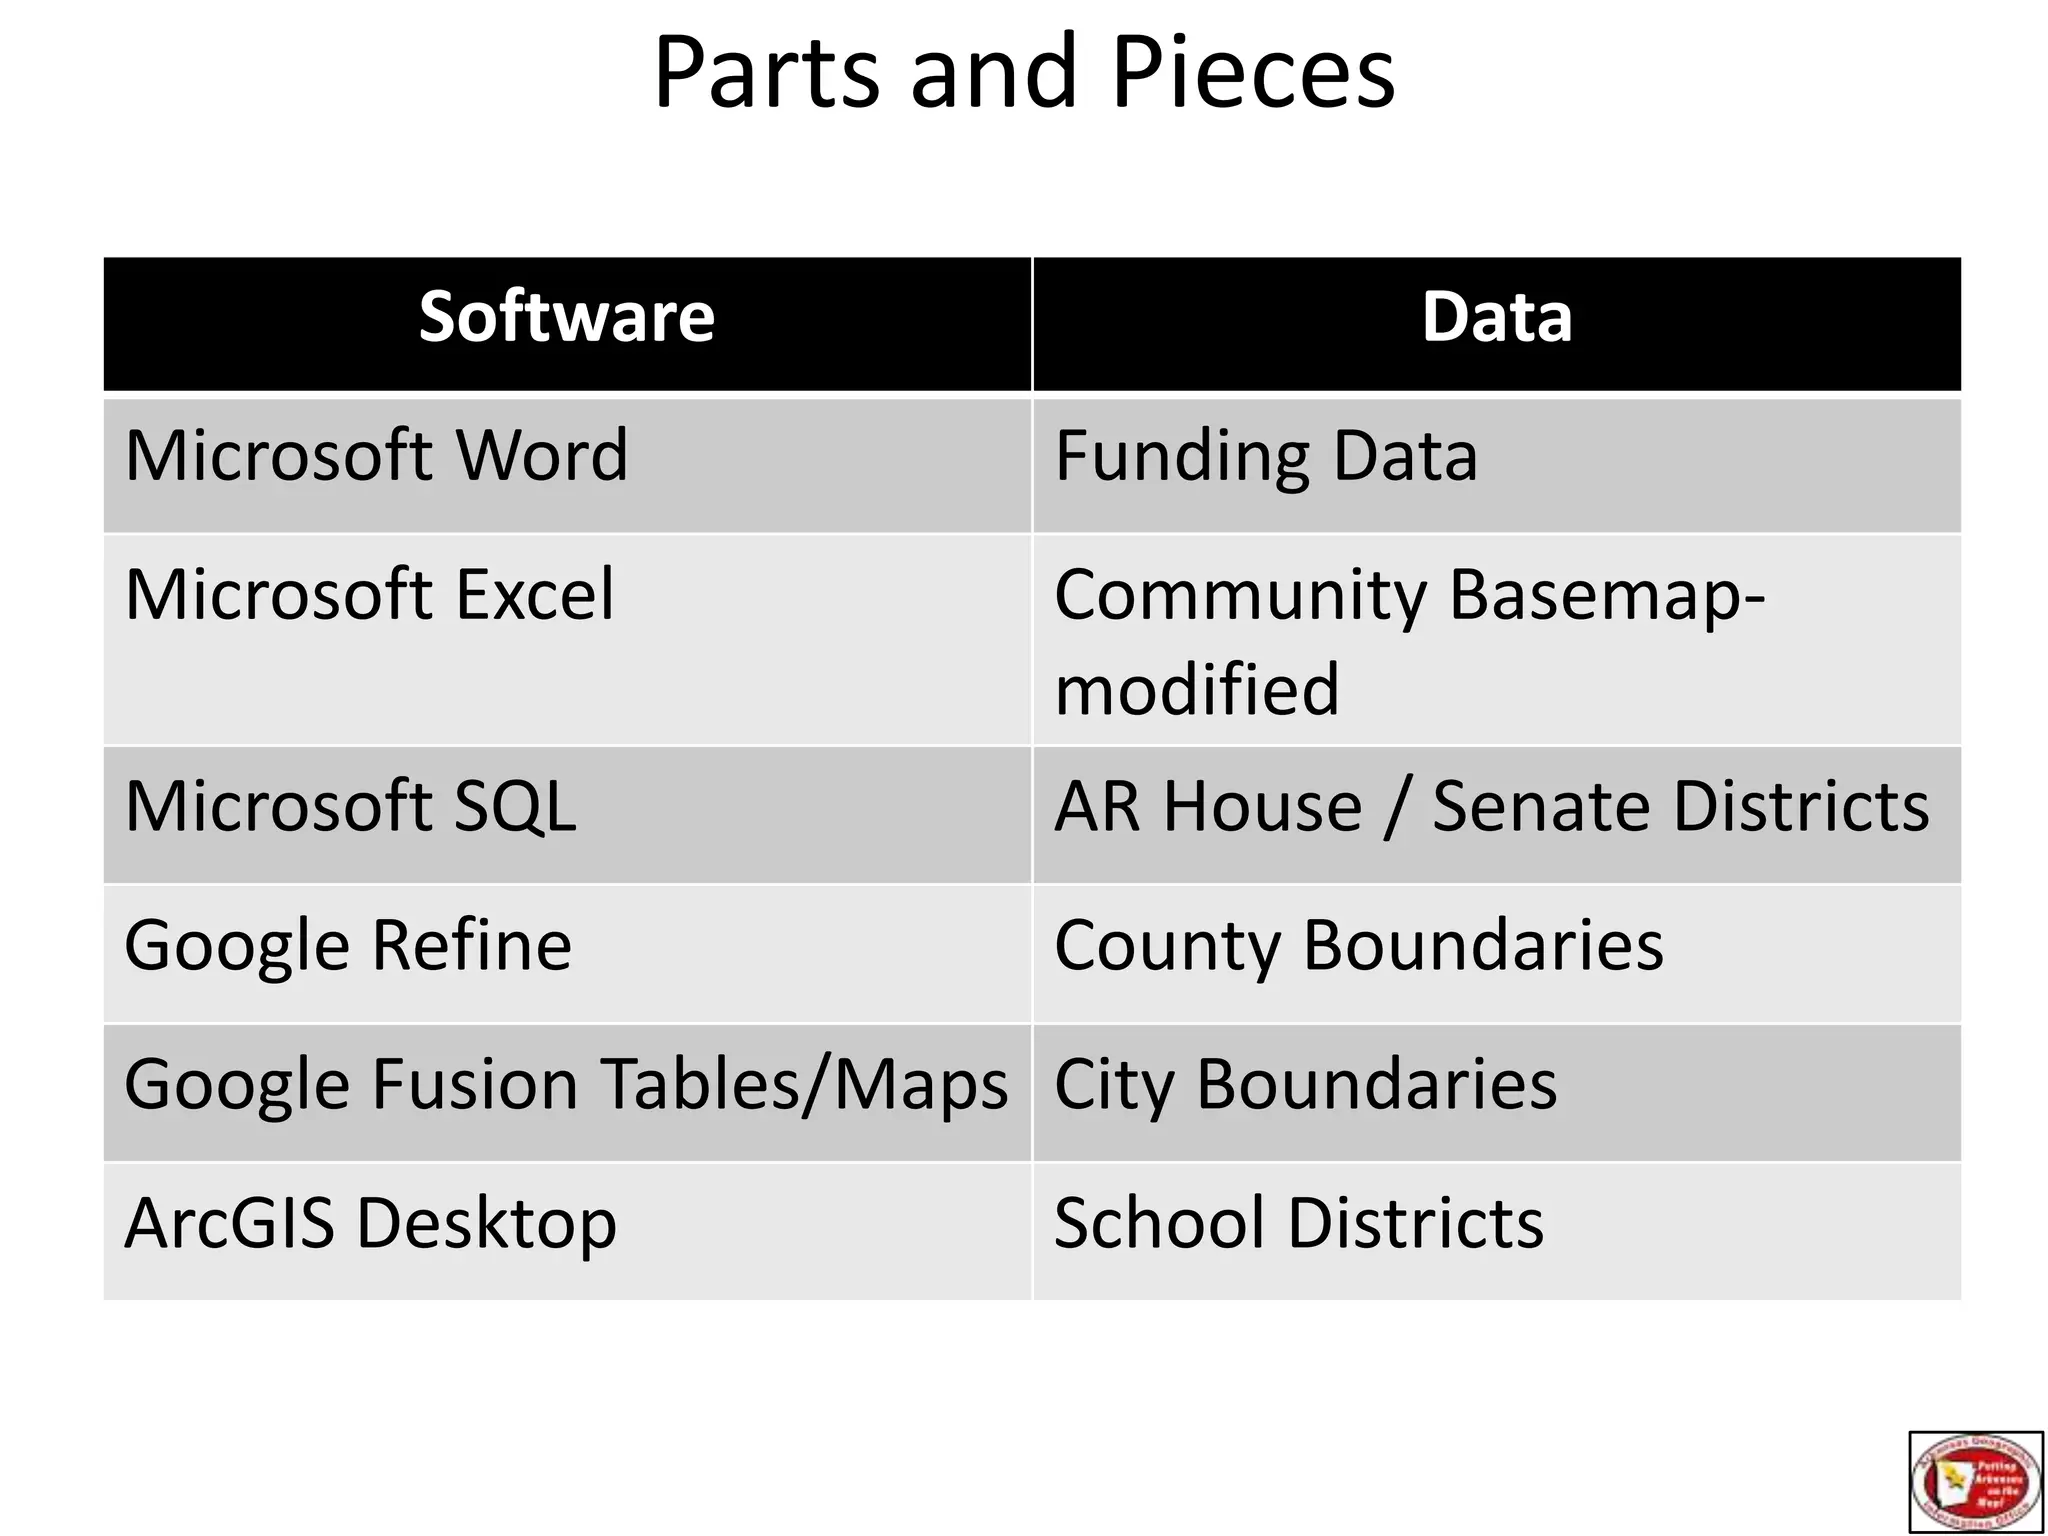
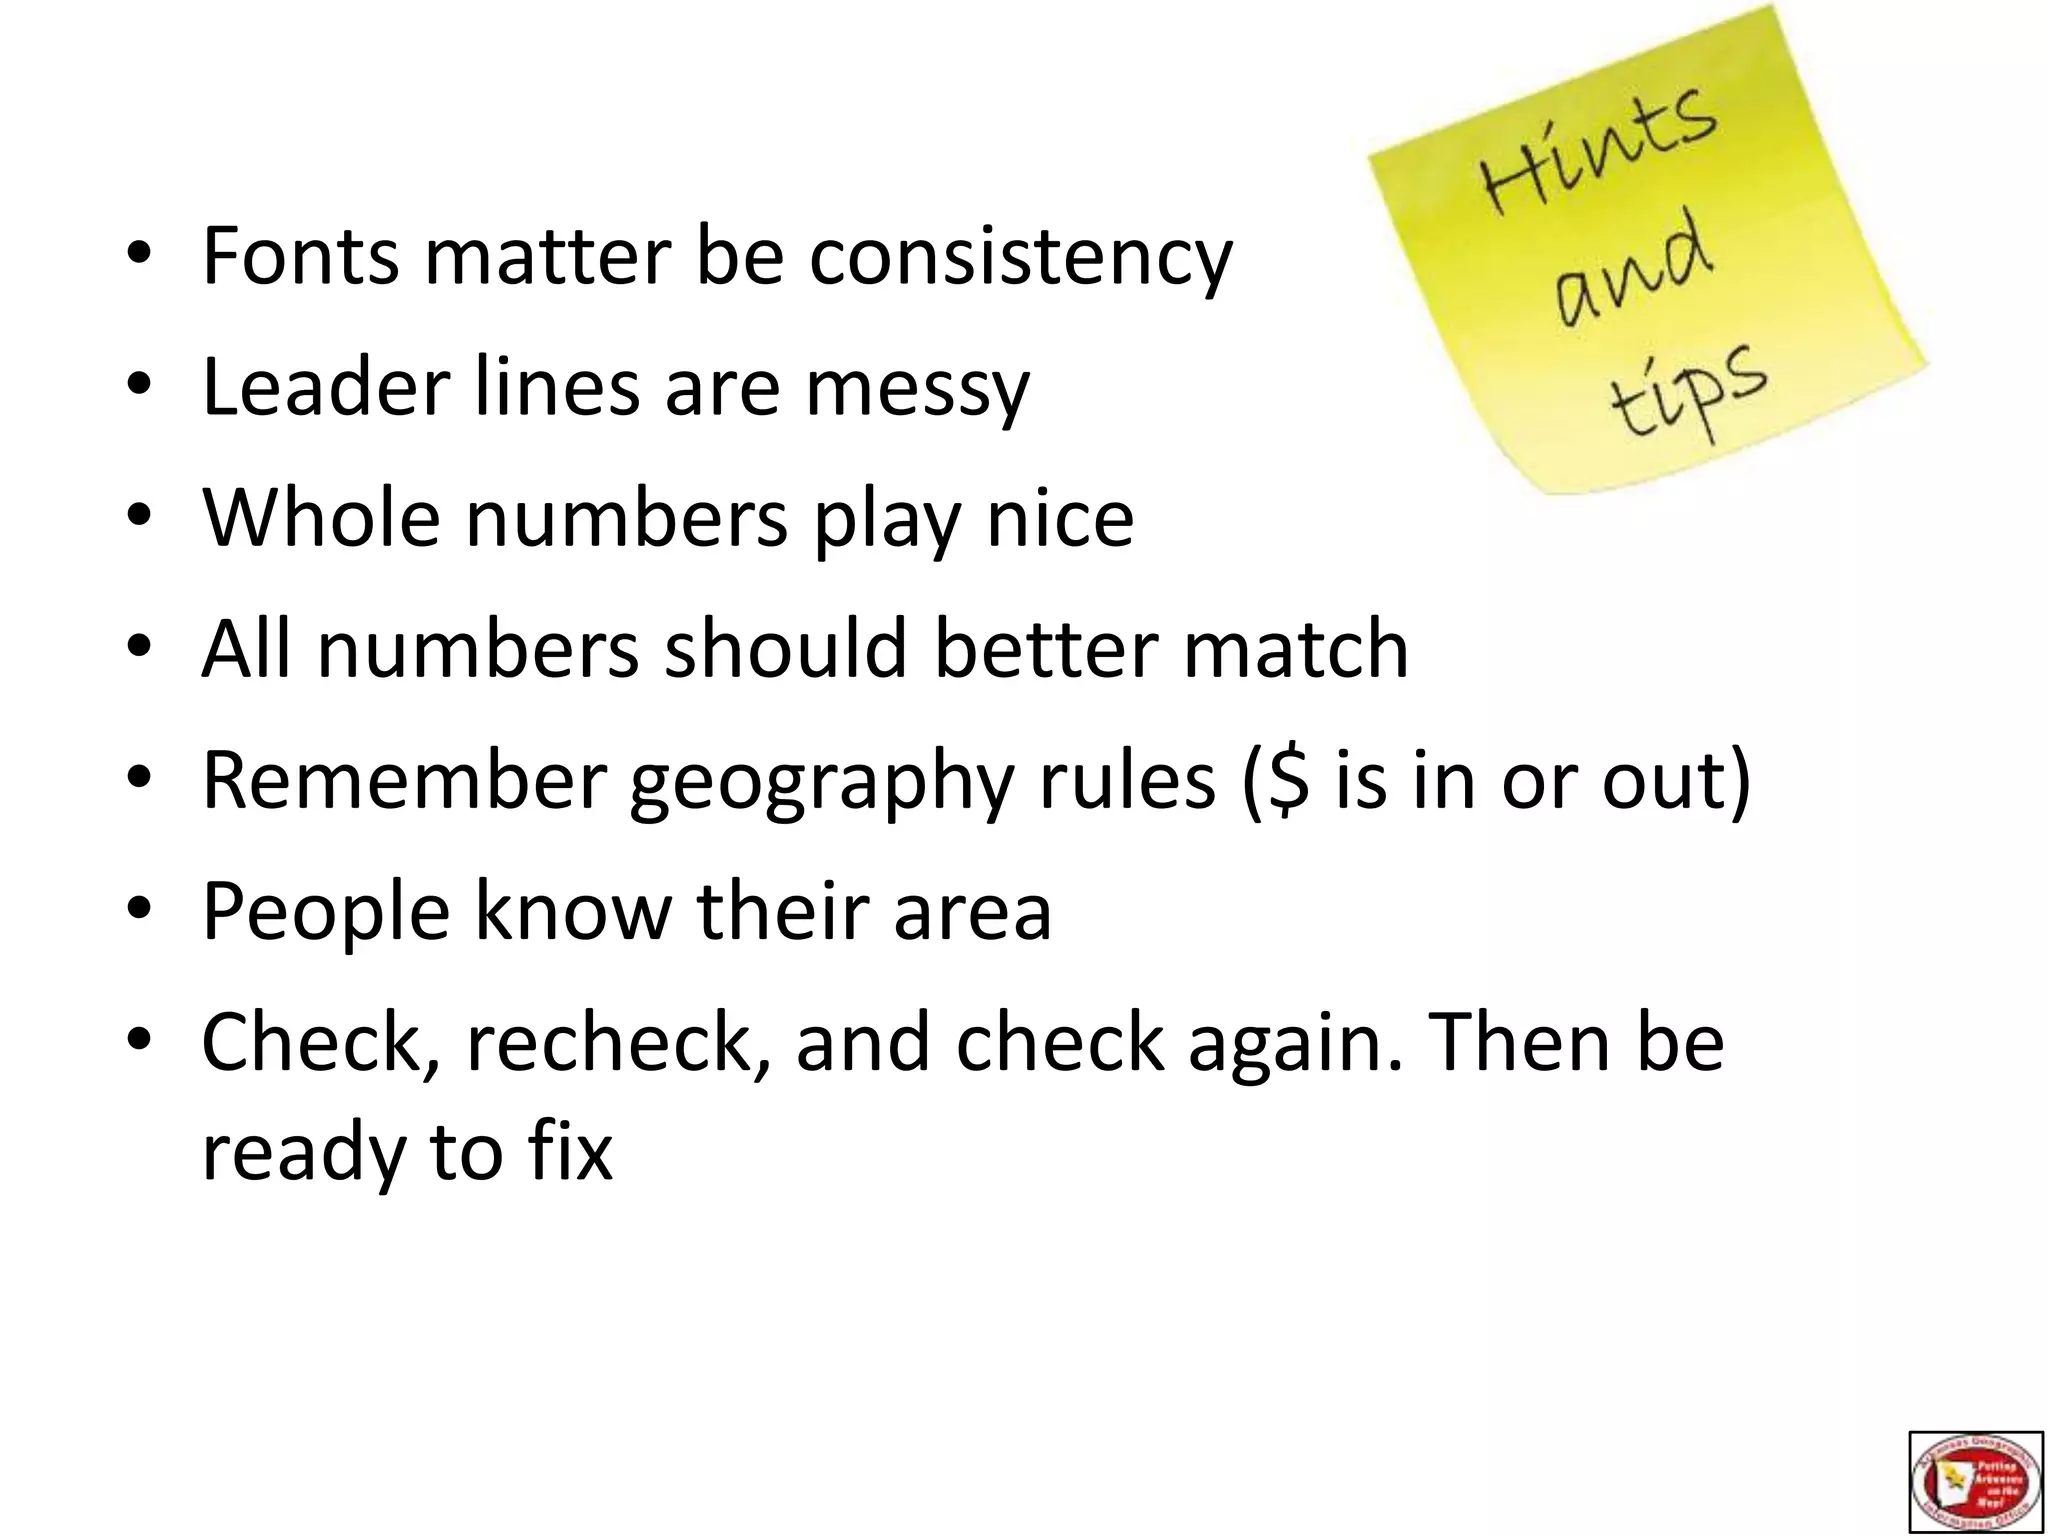
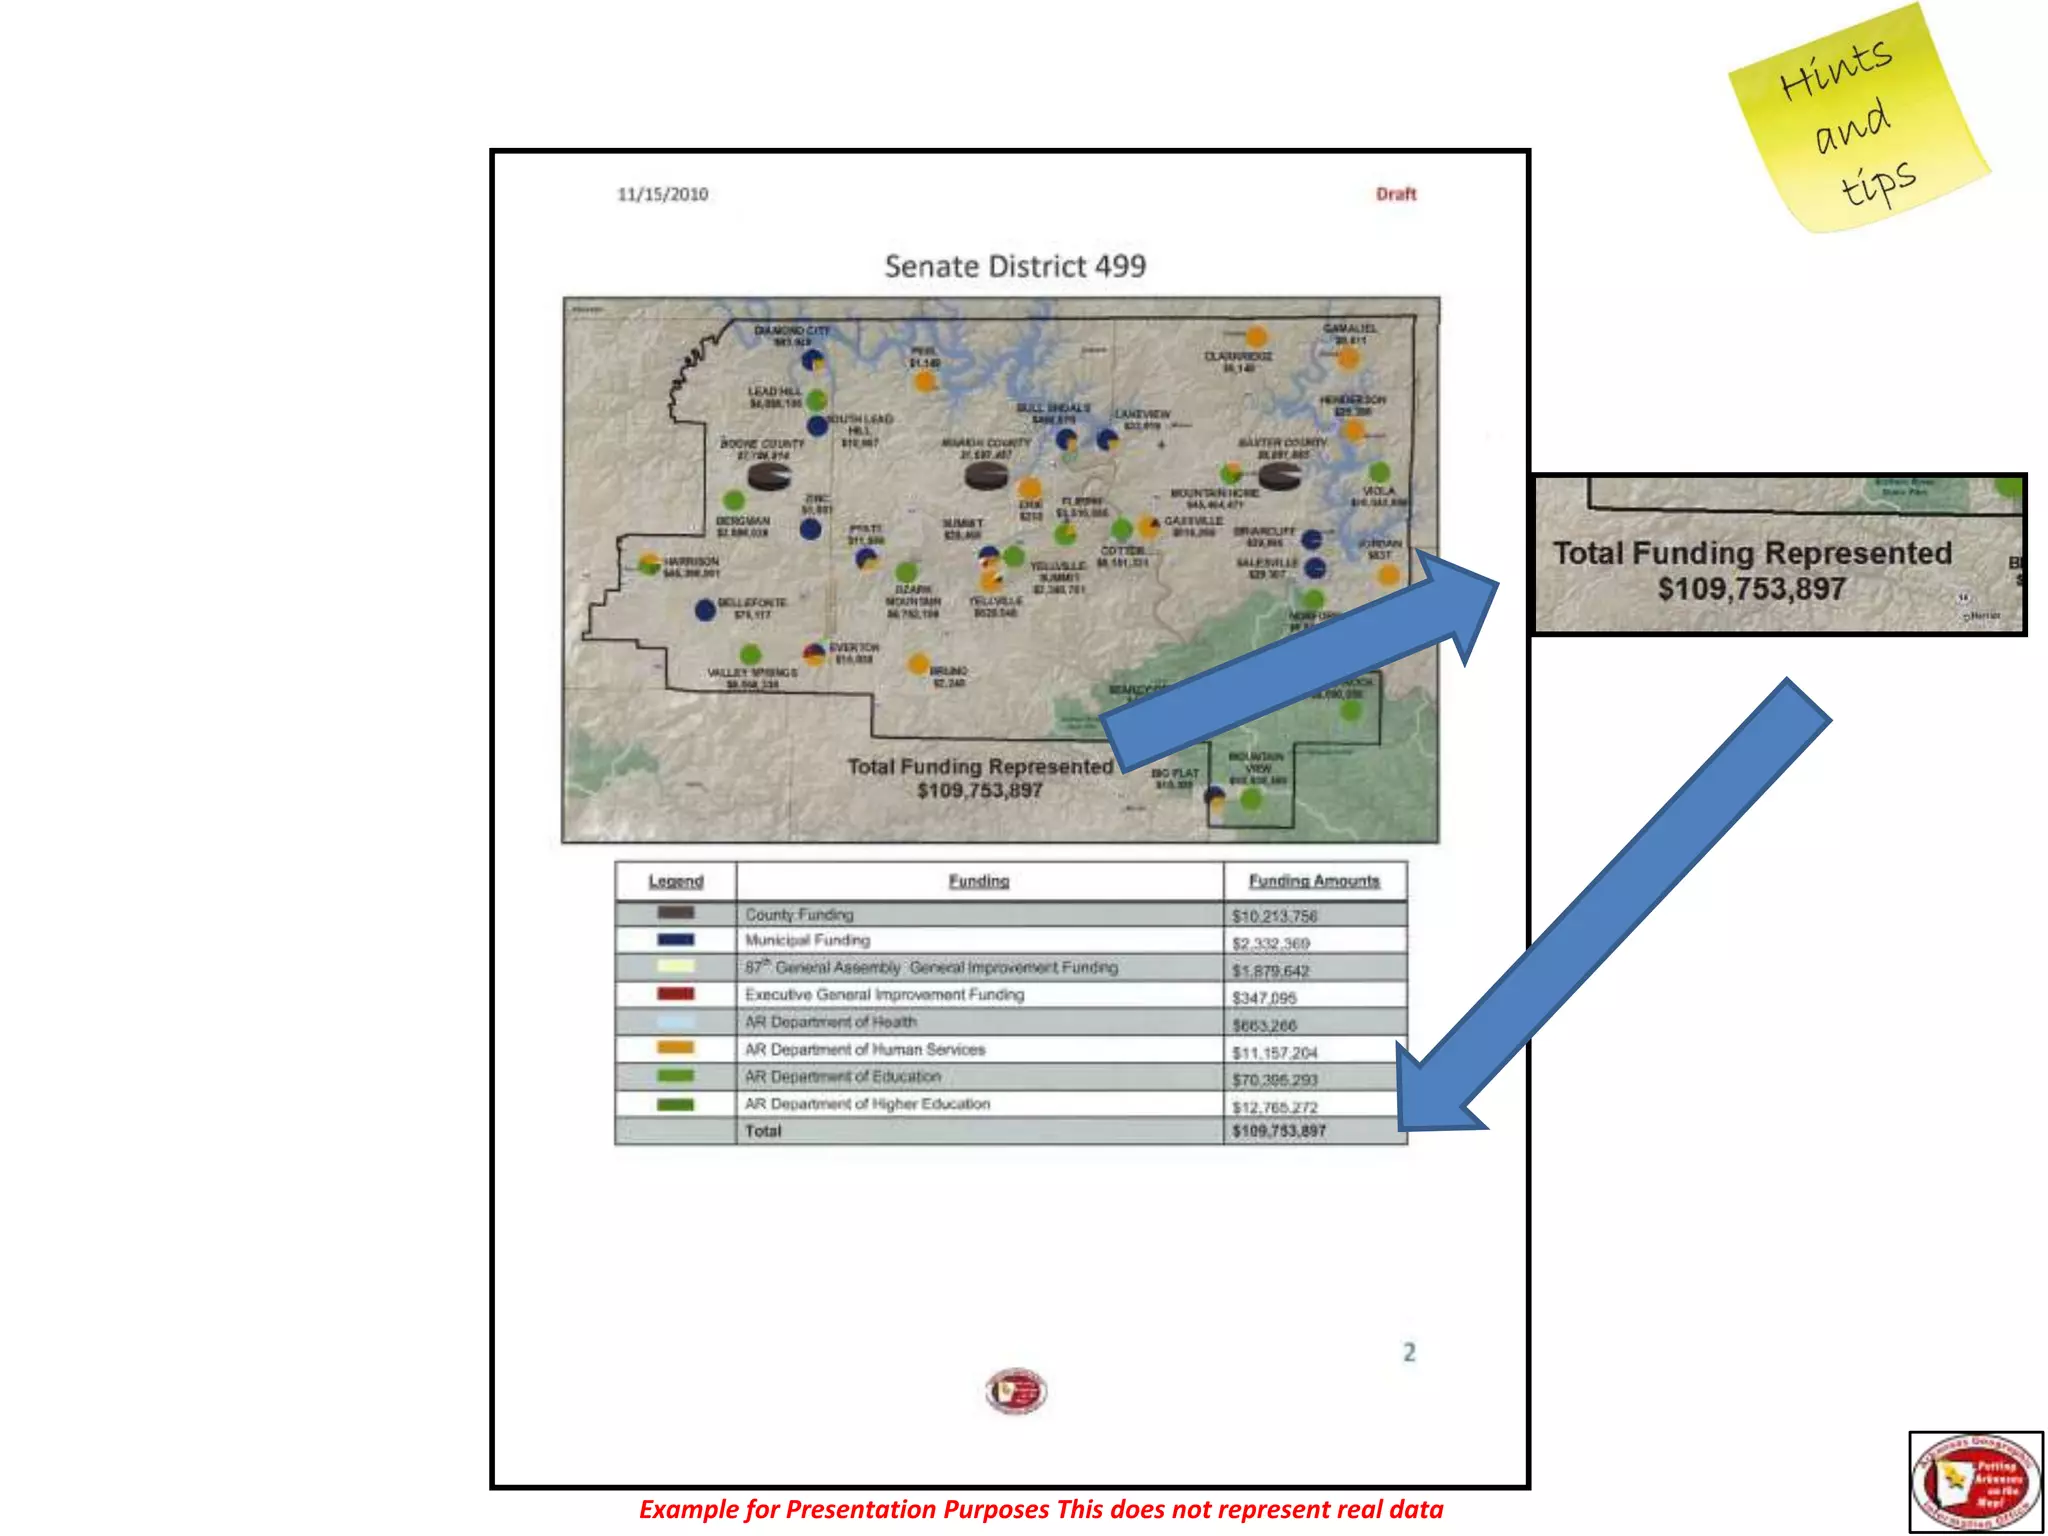
Putting a State Budget on the MapLearon DalbyArkansas Geographic Information Office2/28/2011
Tuesday- November 2, 2010Senate- 35 membersHouse- 100 membersFreshman Senate- 15Freshman House- 47
Issue is the Issue
Issue is the Issue
November 5, 2011
Mapping State BudgetHow?Where is the data?How do we get the data?How should we map it?Can we deliver on time?You asked to Dance so Dance!
DataFocus on State FundingGovernmentEducationPublic SafetyHealth & Human Services Executive General Improvement Funding- DFA
 Legislative General Improvement Funding- DFA
 County Funding- State Treasurer
 Municipal Funding- State TreasurerDisplayHeat MapBy Block GroupBy PopulationThematic MapCountyCity
Arrival of DataSet a cut off dateThe data spoke for itselfCountyCitySchool DistrictMake a decision and move on
How to ProvideWeb applicationWhich one How Failure is not an option
ResultTwo 3 ring bindersHouse of RepresentativesSenateDivided every 10 districts for easy search
Cover
Introduction Page
Page 1Example for presentation purposes this does not represent real data
Page 2Example for presentation purposes this does not represent real data
Page 3Example for presentation purposes this does not represent real data
Page 4Example for presentation purposes this does not represent real data
Technically HowFunding data joined (table) to the appropriate geography (check for nulls)County, city or school district Resultant file is then unioned with legislative district (House or Senate) (County_Funding_Union)Nulls were reviewed and deleted where appropriate. These were generally the result of the lack of integrated topology. (County_Funding_Union)SqMi (Double) was added and calculated to ensure a significant portion of the legislative district was within the County. Any area less than 10 sq/mi (County), less than .023 sq/mi (city(check all up to .1 sqmi)) was deleted (County_Funding_Union)
Technically HowCounty_Funding_Unionconverted to a point file (Feature to Point) for display purposes ((County_Funding_Union_Feature)Add type Column to each fileMerge with previously merged files/CleanRun update query to consolidate all calculations for each district to a single rowCreate Pie charts by district. Doing so at a state level skews the visualReports run manually on each district to complete the template below.
Parts and Pieces
Keep it simple stupidPresent the same way they are accustom to seeing reportsUse all the space available (2 pages front/back)Failure is not an option
Fonts matter be consistencyLeader lines are messyWhole numbers play niceAll numbers should better matchRemember geography rules ($ is in or out)People know their areaCheck, recheck, and check again. Then be ready to fix
Example for Presentation Purposes This does not represent real data
You have 3-5 seconds toCreate impact!
DO NOT create confusion!

Putting a State Budget on a Map

  • 1.
    Putting a StateBudget on the MapLearon DalbyArkansas Geographic Information Office2/28/2011
  • 2.
    Tuesday- November 2,2010Senate- 35 membersHouse- 100 membersFreshman Senate- 15Freshman House- 47
  • 3.
  • 4.
  • 5.
  • 6.
    Mapping State BudgetHow?Whereis the data?How do we get the data?How should we map it?Can we deliver on time?You asked to Dance so Dance!
  • 7.
    DataFocus on StateFundingGovernmentEducationPublic SafetyHealth & Human Services Executive General Improvement Funding- DFA
  • 8.
    Legislative GeneralImprovement Funding- DFA
  • 9.
    County Funding-State Treasurer
  • 10.
    Municipal Funding-State TreasurerDisplayHeat MapBy Block GroupBy PopulationThematic MapCountyCity
  • 11.
    Arrival of DataSeta cut off dateThe data spoke for itselfCountyCitySchool DistrictMake a decision and move on
  • 12.
    How to ProvideWebapplicationWhich one How Failure is not an option
  • 13.
    ResultTwo 3 ringbindersHouse of RepresentativesSenateDivided every 10 districts for easy search
  • 14.
  • 15.
  • 16.
    Page 1Example forpresentation purposes this does not represent real data
  • 17.
    Page 2Example forpresentation purposes this does not represent real data
  • 18.
    Page 2Example forpresentation purposes this does not represent real data
  • 19.
    Page 3Example forpresentation purposes this does not represent real data
  • 20.
    Page 4Example forpresentation purposes this does not represent real data
  • 21.
    Technically HowFunding datajoined (table) to the appropriate geography (check for nulls)County, city or school district Resultant file is then unioned with legislative district (House or Senate) (County_Funding_Union)Nulls were reviewed and deleted where appropriate. These were generally the result of the lack of integrated topology. (County_Funding_Union)SqMi (Double) was added and calculated to ensure a significant portion of the legislative district was within the County. Any area less than 10 sq/mi (County), less than .023 sq/mi (city(check all up to .1 sqmi)) was deleted (County_Funding_Union)
  • 22.
    Technically HowCounty_Funding_Unionconverted toa point file (Feature to Point) for display purposes ((County_Funding_Union_Feature)Add type Column to each fileMerge with previously merged files/CleanRun update query to consolidate all calculations for each district to a single rowCreate Pie charts by district. Doing so at a state level skews the visualReports run manually on each district to complete the template below.
  • 23.
  • 24.
    Keep it simplestupidPresent the same way they are accustom to seeing reportsUse all the space available (2 pages front/back)Failure is not an option
  • 25.
    Fonts matter beconsistencyLeader lines are messyWhole numbers play niceAll numbers should better matchRemember geography rules ($ is in or out)People know their areaCheck, recheck, and check again. Then be ready to fix
  • 26.
    Example for PresentationPurposes This does not represent real data
  • 27.
    You have 3-5seconds toCreate impact!
  • 28.
    DO NOT createconfusion!
  • 29.
    Colors really domatter http://bit.ly/Color4Maps
  • 30.