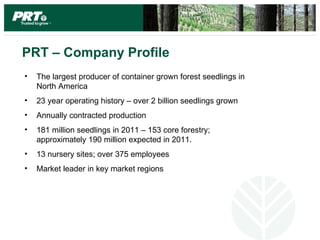
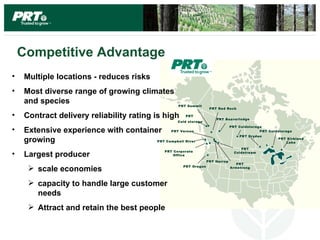
Business Update
Aug 2011
PRT Growing Services Ltd.
PRT – The Legal Stuff
Forward Looking Statements
This business update contains forward-looking statements that involve risks and uncertainties.
    These forward-looking statements relate to, among other things, expectations for customer
    orders; the outlook for the forest industry, US and Asian housing markets, and future
    reforestation programs; and other statements that are not historical fact. Risks and
    uncertainties include, but are not limited to, future commodity prices and exchange rates,
    agricultural risks, our ability to grow and supply products in accordance with defined
    specifications, customer credit risks, and other risks identified from time to time in the
    Fund’s annual report, and annual information return. These risks and uncertainties may
    cause actual results to differ materially from the expectations expressed herein. As such,
    readers are cautioned to not to place undue reliance on forward-looking statements.

Forward-looking statements are based on current expectations and neither the Fund nor PRT
   assumes any obligation to update such information to reflect later events or developments,
   except as required by law.
PRT – Company Profile
•   The largest producer of container grown forest seedlings in
    North America
•   23 year operating history – over 2 billion seedlings grown
•   Annually contracted production
•   181 million seedlings in 2011 – 153 core forestry;
    approximately 190 million expected in 2011.
•   13 nursery sites; over 375 employees
•   Market leader in key market regions
Competitive Advantage
•   Multiple locations - reduces risks
•   Most diverse range of growing climates
    and species                                    PRT Summit
                                                                   PRT Red Rock

•   Contract delivery reliability rating is high      PRT
                                                                      PRT Beaverlodge
                                                  Cold storage
                                                                               PRT Coldstorage
•   Extensive experience with container        PRT Vernon                                    PRT Coldst orage
                                                                                   PRT Dr yden
    growing                              PRT Campbell River
                                                                                                      PRT Kirkland
                                                                                                         Lake

                                                                                    PRT
                                            PRT Corporate
•   Largest producer                            Office
                                                                                 Coldstr eam

                                                                  PRT Harrop
                                                                                  PRT
      scale economies                               PRT Oregon                Armstrong


      capacity to handle large customer
       needs
      Attract and retain the best people
Contracted Revenue System
 Customers contract with PRT before sowing seedlings

 Annual take-or-pay service contracts, with progress payments

 Approximately one-third of seedling volume is from multi-year
  contracts

 Diverse customer base
Harvested Area  Seedling Demand
Typically 600 – 700* million seedlings planted per year in Canada


                                                          Source: National Forestry Database Program & Management Estimates

        * Note that national statistics are not available for 2010 which reflects further impact of the recession of
        the forest industry which began at the end of 2008. In 2009 the report indicates that planting fell by
        approximately 6% over 2007 in PRT’s core Canadian markets. The seedlings planted total shown
        above in 2008 includes a 26% increase in planting by the province of Quebec for that year.
Seedling Demand – lag between harvest and
replanting
  In PRT’s Canadian market region – there is typically a two year lag between
  harvest and replanting – this is demonstrated below


                                      Source: National Forestry Database Program &
                                      Management Estimates
Dominant Market Position in Key Forestry
Markets


                                     * Management Estimates
Geographically Diversified Markets
More Stable Pricing versus Forest Industry
Historically Increasing Volume as a Result of
           PRT Annual Contracted Seedling Blocks
Growth Strategies
           Volume (000’s)


                                                        US Housing
                                                          Market
PRT Annual
                                                         Collapse
Contracted Seedling
Blocks Volume (000’s)


                        - Excludes effect of mid period acquisitions
Financial Performance
Revenue and EBITDA History


                    Higher energy
                    prices and F/X                      US Housing
                                                          Market
                                                         Collapse


                              Operating Income Before Site
                                Consolidation Charges
Efficient Long-Term Assets
Low and predictable capital maintenance requirements
        Maintenance and Sustaining Capital Expenditures as a Percentage of
                           Revenue (10 year history)
Financial Position – PRT Inc.
Maintaining Low Leverage in Current Cycle - Capacity for Growth as
Markets Recover
     Millions of dollars
                                         Dec. 31, 2010   June 30, 2011

           Net working capital*              $6.9            $8.8

           Total assets                      $47.4          $50.3

           LTD & equivalent                $ 1.5            $ 1.3

           Equity                            $40.1          $41.8

           Term Debt: equity ratio          0.037:1        0.031:1


           *excludes current portion of term debt.
Key Risks

•   Forest Industry customers – financial (credit) risk

•   US housing market
      Are we starting to see a rebound?
      Timing/pace of recovery is uncertain

•   Asian markets – sustainability

•   Expansion into new markets – timing and
    profitability
Managing Financial (Credit) Risk
•   Credit risk management includes:
      credit policy
      progress payments
      contract language protection
      possession of trees
•   Layers of protection through government – unique aspects of
    protection arising from public land tenures in Canada
      forest company reforestation obligation with attachment
       to tenures
      Ontario trust funds
      PRT’s experience with past forest company bankruptcies
•   Historical losses are extremely low (0.05% of total revenue
    since 1997)
Key Growth Opportunities
 •   Market recovery from cyclical lows
 •   Entry into new market areas
      Exploit PRT’s reliability and technology advantages
 •   Backlog in reforestation exists
      Under-stocked plantations, pine beetle and fire
       damage
 •   Industry consolidation – industry currently fragmented
 •   Responses to climate change
       Biofuels
       Carbon sequestration
       Green up projects
Increasing demand from Pacific Rim offsets
lower US Seedling Demand
             PRT Seedling Order Forecast vs. Housing Starts Equiv.
                           (US+Cda+China Equiv.)
       300                                                           3

                                                                     2.5
       250
                                                                     2
       200
                                                                     1.5
       150
                                                                     1


                                                                           m
                                                                           S
                                                                           n
                                                                           o
                                                                           s
                                                                           a
                                                                           r
                                                                           )
                                                                           (
                                                                           t
                                                                           l
                                                                           i
   m


       100                                                           0.5
   S
   o
   g
   n
   d
   s
   e
   )
   (
   i
   l


                             PRT Orders         Starts
A US Housing Recovery Will Drive Later
 Seedling Demand
 Updated May 2010                                   APA U.S. Housing Forecast
  APA Forecast          2009      2010      2011    Single Family & Multifamily Only*
  Single Family       445,100   525,000   800,000
  Multifamily         108,900    90,000   135,000   Forecasts (000)       2010      2011
    Total             554,000   615,000   935,000
                                                    RISI (4/26/’10)        720     1,040
Million U.S. Starts                                 FEA* (4/8/’10)         702     1,029
                                                    Freddie Mac (5/11/’10) 680     1,100
                                                    RBC* (4/17/’10)        661       884
                                                    NAR* (5/10/‘10)        659       980
                                                    Wells Fargo (4/24/’10) 650       760
                                                    NAHB (4/23/’10)        646       991
                                                    WWPA (3/8/’10)         618       719
                                                    APA (4/1/‘10)          615       935
                                                    Average                660       940

                                                    *FEA: Forest Economic Advisors.
                                                    *NAR: National Assoc. of Realtors.
                                                    *RBC: Royal Bank of Canada
Market Expansion Opportunities
Increasing Reforestation Backlog in
BC              • The MPB has destroyed 692 million
                  cubic meters of merchantable Pine
                           (51%) to date.
                       •    56% is expected to be destroyed by
                           2016


     1980


     1985
Increasing Concerns over Climate Change
• Diversify markets to
  take advantage of
  emerging opportunities

   PRT Promotional
    Products initiative

   PRT Energy Crops:
    carbon
    sequestration and
    offset projects
Compelling Valuation
• Undervalued Assets - Trading at a significant discount to fair value
• Earnings are cyclically depressed
• Positive free cash flow through cycle
• Restructuring and cost reduction efforts mostly complete
• Strong financial & operational risk management strategies in place
      Diversified production locations
      Reduced US currency exposure
      Forward natural gas buying program
      Term debt reduced to extremely low levels
      Interest rates fixed on term debt
Summary
•   Solid competitive position – industry leader

•   Experienced management team

•   Proven track record in business – 23years and over 2 billion trees

•   Contracted cash flow with low maintenance and capital expenditures

•   Managing balance sheet – very low leverage

•   Results impacted by the unprecedented cyclical downturn in the forest
    industry

•   Poised for significant growth opportunities as markets recover

PRT Business Update 2011

  • 1.
    Business Update Aug 2011 PRTGrowing Services Ltd.
  • 2.
    PRT – TheLegal Stuff Forward Looking Statements This business update contains forward-looking statements that involve risks and uncertainties. These forward-looking statements relate to, among other things, expectations for customer orders; the outlook for the forest industry, US and Asian housing markets, and future reforestation programs; and other statements that are not historical fact. Risks and uncertainties include, but are not limited to, future commodity prices and exchange rates, agricultural risks, our ability to grow and supply products in accordance with defined specifications, customer credit risks, and other risks identified from time to time in the Fund’s annual report, and annual information return. These risks and uncertainties may cause actual results to differ materially from the expectations expressed herein. As such, readers are cautioned to not to place undue reliance on forward-looking statements. Forward-looking statements are based on current expectations and neither the Fund nor PRT assumes any obligation to update such information to reflect later events or developments, except as required by law.
  • 3.
    PRT – CompanyProfile • The largest producer of container grown forest seedlings in North America • 23 year operating history – over 2 billion seedlings grown • Annually contracted production • 181 million seedlings in 2011 – 153 core forestry; approximately 190 million expected in 2011. • 13 nursery sites; over 375 employees • Market leader in key market regions
  • 4.
    Competitive Advantage • Multiple locations - reduces risks • Most diverse range of growing climates and species PRT Summit PRT Red Rock • Contract delivery reliability rating is high PRT PRT Beaverlodge Cold storage PRT Coldstorage • Extensive experience with container PRT Vernon PRT Coldst orage PRT Dr yden growing PRT Campbell River PRT Kirkland Lake PRT PRT Corporate • Largest producer Office Coldstr eam PRT Harrop PRT  scale economies PRT Oregon Armstrong  capacity to handle large customer needs  Attract and retain the best people
  • 5.
    Contracted Revenue System Customers contract with PRT before sowing seedlings  Annual take-or-pay service contracts, with progress payments  Approximately one-third of seedling volume is from multi-year contracts  Diverse customer base
  • 6.
    Harvested Area Seedling Demand Typically 600 – 700* million seedlings planted per year in Canada Source: National Forestry Database Program & Management Estimates * Note that national statistics are not available for 2010 which reflects further impact of the recession of the forest industry which began at the end of 2008. In 2009 the report indicates that planting fell by approximately 6% over 2007 in PRT’s core Canadian markets. The seedlings planted total shown above in 2008 includes a 26% increase in planting by the province of Quebec for that year.
  • 7.
    Seedling Demand –lag between harvest and replanting In PRT’s Canadian market region – there is typically a two year lag between harvest and replanting – this is demonstrated below Source: National Forestry Database Program & Management Estimates
  • 8.
    Dominant Market Positionin Key Forestry Markets * Management Estimates
  • 9.
  • 10.
    More Stable Pricingversus Forest Industry
  • 11.
    Historically Increasing Volumeas a Result of PRT Annual Contracted Seedling Blocks Growth Strategies Volume (000’s) US Housing Market PRT Annual Collapse Contracted Seedling Blocks Volume (000’s) - Excludes effect of mid period acquisitions
  • 12.
    Financial Performance Revenue andEBITDA History Higher energy prices and F/X US Housing Market Collapse Operating Income Before Site Consolidation Charges
  • 13.
    Efficient Long-Term Assets Lowand predictable capital maintenance requirements Maintenance and Sustaining Capital Expenditures as a Percentage of Revenue (10 year history)
  • 14.
    Financial Position –PRT Inc. Maintaining Low Leverage in Current Cycle - Capacity for Growth as Markets Recover Millions of dollars Dec. 31, 2010 June 30, 2011 Net working capital* $6.9 $8.8 Total assets $47.4 $50.3 LTD & equivalent $ 1.5 $ 1.3 Equity $40.1 $41.8 Term Debt: equity ratio 0.037:1 0.031:1 *excludes current portion of term debt.
  • 15.
    Key Risks • Forest Industry customers – financial (credit) risk • US housing market  Are we starting to see a rebound?  Timing/pace of recovery is uncertain • Asian markets – sustainability • Expansion into new markets – timing and profitability
  • 16.
    Managing Financial (Credit)Risk • Credit risk management includes:  credit policy  progress payments  contract language protection  possession of trees • Layers of protection through government – unique aspects of protection arising from public land tenures in Canada  forest company reforestation obligation with attachment to tenures  Ontario trust funds  PRT’s experience with past forest company bankruptcies • Historical losses are extremely low (0.05% of total revenue since 1997)
  • 17.
    Key Growth Opportunities • Market recovery from cyclical lows • Entry into new market areas  Exploit PRT’s reliability and technology advantages • Backlog in reforestation exists  Under-stocked plantations, pine beetle and fire damage • Industry consolidation – industry currently fragmented • Responses to climate change  Biofuels  Carbon sequestration  Green up projects
  • 18.
    Increasing demand fromPacific Rim offsets lower US Seedling Demand PRT Seedling Order Forecast vs. Housing Starts Equiv. (US+Cda+China Equiv.) 300 3 2.5 250 2 200 1.5 150 1 m S n o s a r ) ( t l i m 100 0.5 S o g n d s e ) ( i l PRT Orders Starts
  • 19.
    A US HousingRecovery Will Drive Later Seedling Demand Updated May 2010 APA U.S. Housing Forecast APA Forecast 2009 2010 2011 Single Family & Multifamily Only* Single Family 445,100 525,000 800,000 Multifamily 108,900 90,000 135,000 Forecasts (000) 2010 2011 Total 554,000 615,000 935,000 RISI (4/26/’10) 720 1,040 Million U.S. Starts FEA* (4/8/’10) 702 1,029 Freddie Mac (5/11/’10) 680 1,100 RBC* (4/17/’10) 661 884 NAR* (5/10/‘10) 659 980 Wells Fargo (4/24/’10) 650 760 NAHB (4/23/’10) 646 991 WWPA (3/8/’10) 618 719 APA (4/1/‘10) 615 935 Average 660 940 *FEA: Forest Economic Advisors. *NAR: National Assoc. of Realtors. *RBC: Royal Bank of Canada
  • 20.
  • 21.
    Increasing Reforestation Backlogin BC • The MPB has destroyed 692 million cubic meters of merchantable Pine (51%) to date. • 56% is expected to be destroyed by 2016 1980 1985
  • 22.
    Increasing Concerns overClimate Change • Diversify markets to take advantage of emerging opportunities  PRT Promotional Products initiative  PRT Energy Crops: carbon sequestration and offset projects
  • 24.
    Compelling Valuation • UndervaluedAssets - Trading at a significant discount to fair value • Earnings are cyclically depressed • Positive free cash flow through cycle • Restructuring and cost reduction efforts mostly complete • Strong financial & operational risk management strategies in place  Diversified production locations  Reduced US currency exposure  Forward natural gas buying program  Term debt reduced to extremely low levels  Interest rates fixed on term debt
  • 25.
    Summary • Solid competitive position – industry leader • Experienced management team • Proven track record in business – 23years and over 2 billion trees • Contracted cash flow with low maintenance and capital expenditures • Managing balance sheet – very low leverage • Results impacted by the unprecedented cyclical downturn in the forest industry • Poised for significant growth opportunities as markets recover