
Recommended
Recommended
More Related Content
Viewers also liked
Viewers also liked (6)
Similar to Property Service Report
Similar to Property Service Report (20)
Property Service Report
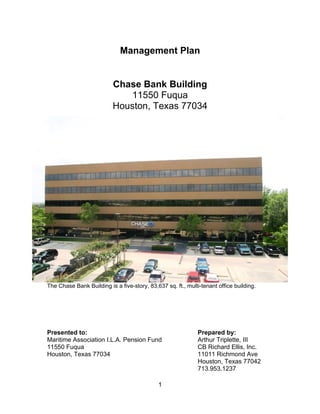
- 1. Management Plan Chase Bank Building 11550 Fuqua Houston, Texas 77034 The Chase Bank Building is a five-story, 83,637 sq. ft., multi-tenant office building. Presented to: Prepared by: Maritime Association I.L.A. Pension Fund Arthur Triplette, III 11550 Fuqua CB Richard Ellis, Inc. Houston, Texas 77034 11011 Richmond Ave Houston, Texas 77042 713.953.1237 1
- 2. Table of Contents I. Introduction to the Management Plan A. Title Page……………………………………………….1 B. Table of Contents………………………………………2 C. Executive Summary……………………………………3 D. Purpose of Study and Client Objectives……………..8 II. Property Analysis A. Property Description…………………………………...9 B. Financial Analysis…………………………………….23 C. Summary and Conclusions………………………….30 III. Market Analysis A. Regional and Neighborhood Analysis………………33 B. Competitive Rent Analysis…………………………...43 C. Summary and Conclusions…………………………..47 IV. Analysis of Alternatives A. Issues and Concerns………………………………...50 B. Alternative Courses of Action……………………….53 C. Evaluation of Alternatives…………………………...58 V. Recommended Course of Action………………… 66 VI. Appendix A. Maps, Charts, Etc…………………………………….1 B. Certification and Disclosures……………………..102 C. Qualifications of Analyst…………………………..103 2
- 3. Purpose of the Study and Client Objectives The purpose of this study is to outline various recommendations for Maritime Association I.L.A. Pension Fund, the client and owner, to implement the proposed courses of action at the property relating to functional obsolescence, utility costs reduction and physical obsolescence. The owner’s objectives are: • Retaining ownership of the property for a minimum of five years • Achieving an enhancement in value of no less than $125,000 in year 1 with a maximum capital investment of $15,000 • Attain a ROI of no less than 75% and/or a operating expense reduction of $0.11 per SF thru the implementation of a capital improvement With these objectives in sight, the alternatives addressed in this management plan will suggest to ownership various paths of realizing the rate of return they desire as well as enhance the value and look of the property, while retaining ownership to the building over the holding period. Upon reviewing the operations of the building, it was apparent that the current appearance of the lobby was not aesthetically pleasing. In addition, the antiquated and inefficiency of the restroom fixtures, urinals and toilets possess the capability to significantly reduce the utility costs and give the restrooms a more modern appearance. Recommendations regarding the concerns referenced above will be further addressed in this plan. 3
- 4. Executive Summary The following management plan ventures to analyze the current condition of the Chase Bank Building and to introduce an alternative course of action consistent with the owner’s goals and objectives, which are retaining ownership of the property for at least another five years, achieving an enhancement in value of no less than $125,000 in year 1 with a maximum capital investment of $15,000 and attain a ROI of no less than 75% and/or operating expense reduction of $0.11 per SF or more through the implementation of a capital improvement. With long-term cash flow in mind, a practical alternative has been recommended along with an anticipated date of completion that will afford the owners the opportunity to achieve their goals and objectives. The Chase Bank Building, an 83,637 square foot office building, is located in Houston, Texas, the fourth largest city in the nation located along the Gulf of Mexico in the southeast corner of the state. There are no zoning requirements or restrictions in the city of Houston, which offer residents and visitors an extensive selection of personal and business developments. Office product under construction totals right at 7.7 million square feet and 36 buildings. Out of the 17 buildings scheduled for delivery in 2008 only 9 buildings or 1.25 million square feet actually were completed with 238,000 square feet pre-leased. This is a sign of the times and confirmation of the overall weak global economy particularly in the energy sector. It appears that office-leasing activity has slowed similar to the rate of the global economy. A large presence of upscale affordable housing, good schools, perceived better quality of life, high end retail and restaurants all in 4
- 5. close proximity to each other make Houston one of the most attractive cities in the country. The property’s submarket has almost a quarter of a percentage point lower vacancy rate, of 12.59%, than the entire suburban office market. The average asking rental rate in the East sub-market has moderately increased in the past year with rents ranging from $12.97 to $21.20 per square foot annually. A reduction in positive absorption of more than 45,000 square feet through the second quarter of 2008 compared with 55,099 square feet of total absorption at this same time last year can be primarily attributed to tenant downsizing and consolidation. Occupancy has averaged 85% - 90% at the Chase Bank Building in the past year. As of June 2008, the vacancy rate increased to 15% due to Norrell Services, Inc. vacating 3,427 square feet of office space the previous month. Other comparable properties in the East sub-market area are 83% to 96% leased. Taking the actual YTD NOI, $237,308.10 and forecasting for the remainder of the year, the end of year NOI equals $569,539.44. When capitalizing the end of year NOI of $569,539.44 at the 7.64% capitalization rate developed in the plan, the value of the property equates to $7,454,705.00. Less the 6% cost of sale the owner’s equity as of June 2008 is estimated to be $7,007,423.00. If we meet the budgeted end of year NOI, $664,826.00, using the same cap rate of 7.64% the property would have a market value of $8,701,911.00 with the owner’s equity totaling $8,179,796.00 after the 6% cost of sale is deducted. 5
- 6. Two matters key to the operation of the property will be addressed in this plan. The first is the inefficient and outdated restroom fixtures and the other matter is the inferior aesthetic appearance of the main lobby. Both of these issues can be easily resolved with modest capital costs. Upon implementing the recommended course of action, the owners will benefit from a significant reduction in utility costs while simultaneously realizing an increase in the value of the property. Utility costs are repeatedly the cause of high or increased operating expenses and the current configuration of the restrooms do not possess the ability to reduce overall water usage. Through the use of water-reducing systems a utility cost savings of 100% of the total building water usage or more than the $8,921.00 in annual water costs is possible. Presently the main lobby area is being utilized as a non-descript open “common area”. The comparable properties all have superior main lobbies in terms of size, interior landscaping, flooring, and furniture. Now there is nothing that can be done in reference to the size of the lobby but the other issues can surely be addressed for an estimated cost of no more than $10,000. This can be packaged as additional amenities to the tenants and their clients and add to the overall appearance, specifically the initial appeal as well as the marketability of the property. The increase in revenue would be realized when the property secures higher rental rates in new, renewal and expansion leases. 6
- 7. Two alternative courses of action have been evaluated and tested to determine which one best meets the goals and objectives of the owners. 1. Do nothing and continue to operate “as is” 2. Install water saving faucets, urinals and toilets with automated capabilities Each alternative was tested for cash-on-cash rate of return ($/$%), value enhancement, net present value (NPV) and initial rate of return (IRR). The test results prove, Alternative #2 meets the owner’s goals and objectives best with a $/$% of 7.63%, value enhancement of $131,819.30 in year 1 and $118,762 over the holding period, an NPV of ($897,110.00) and an IRR of 5.27%. Consequently this is the recommended course of action. The replacement of the old and antiquated restroom fixtures, urinals and toilets should be fully implemented over the course of a typical 2-day weekend in the fall with the owner’s providing $11,195.02 in capital dollars. Within 12 months of the owners taking advantage of the recommended solution they will realize annual savings in utility operating costs of approximately $10,071.64. With more than 100% of the capital improvement costs being realized in terms of cost/savings payback in just over 12 months the annual revenue will proportionately increase by this same amount. With the imposed limitation of $15,000 on the dollar total in capital expenditures Alternative #2 suggests that the owners invest $11,195.02, which 7
- 8. would increase NOI in 2008 by $10,071.00 to $598,487.00. The suggested recommendation yields a value enhancement of $131,819.30 in Year 1 (2008) on a capital outlay of $11,195.02 and produces a ROI of 90% in addition to a $0.12 per square foot reduction in operating expenses with the implementation of this proposed capital improvement. 8
- 9. Alternative Courses of Action An array of potential alternatives will be considered and recommended to the owners of the property which would put them in a position to meet and hopefully exceed their stated goals and objectives of: • Retaining ownership of the property for at least another five years • Achieving an enhancement in value of no less than $125,000 in year 1 with a maximum capital investment of $15,000 • Attain a ROI of no less than 75% and/or operating expense reduction of $0.11 per SF or more thru the implementation of a capital improvement Two alternative courses of action have been analyzed in response to the issues, which have been identified in this management plan and are as follows: 1. Do nothing and continue to operate the property “as is” 2. Install water saving faucets, urinals and toilets with automated capabilities 9
- 10. Alternative #1: Do nothing and continue to operate “as-is” To carry on operating the Chase Bank Building “as is” will certainly be considered by the property owners since the expenditure of capital dollars are tentatively set to be spent on tenant improvements and lease commissions as these expenses can easily be amortized over the length of lease to produce a substantial profit while not physically encountering out of pocket expenses but simultaneously increasing revenue as well as net operating income. Conversely, this alternative does not allow the owners to meet any of their goals or objectives that they have established for the forthcoming year. After conducting a property analysis and reviewing the current property operations, there are clear signs of functional and physical obsolescences including the condition of the original roof, deferred maintenance of the elevators and outdated/inefficient restroom fixtures and toilets. In lieu of reaching their stated goals and objectives it is in the best interest of the property owners to research and evaluate potential utility savings through the very latest in low cost water savings technologies. Refusal to retrofit the restrooms at the property with these efficient devices could result in increased utility expenses, loss of current market position in terms of marketability, increased operating expense to revenue ratio and tenant dissatisfaction which could lead to loss of rent revenue. Based on the projected end of year NOI for 2008 of $588,416.00 and a cap rate of 7.64% (from comparable sales within the last 12 months – see pages 61 - 66 of the appendix), the value today would be $7,701,780.10. The current 10
- 11. appraised value according to the Harris County Appraisal District is $6,000,000. The value in Year 5 (2012) is projected to be $6,748,335.48 based on the projected NOI of $522,996.00 and an expected cap rate of 7.75%, based heavily on the impending recession and forecasted decline in property values due to the current state of the capital markets, overall economy and upcoming presidential election (the capitalization rate is forecasted to increase at most 86 basis points above the current cap rate at different times throughout the holding period). This represents a reduction in value of $953,444.62. This unavoidable diminishing of property values commands property owners to implement a meaningful capital improvement program that will provide a substantial ROI, IRR and enhancement in value with a short payback in tandem with an acceptable cost for the capital improvement(s). Alternative #2: Install water saving faucets, urinals and toilets with automated capabilities The installation of these water-reducing systems illustrates an annual savings of over 100% of the total building water usage or more than the $8,921.00 in annual water costs. The cost to purchase and install water efficient faucets with aerators, water efficient toilets with auto flush units and waterless urinals is $11,195.02 (refer to the water savings calculations and inventory list on pages 90 - 93 of the appendix). There are no rebates offered by the local utility company to install 11
- 12. water saving equipment at this time. The fixtures, toilets and urinals with auto flush units can be installed over a weekend resulting in no down time. After reviewing the various options available to implement in the restrooms at the property to achieve the desired goals and objectives it is clear that there are a few strategic combinations, all of which will significantly increase utility savings, tenant satisfaction and improve systems operations. Implementing the following can recognize considerable utility savings and provide the best cost to savings ratio: - 20 ULF 2.2 gpm faucets with aerators that reduce water flow to 0.5 gpm - 17 ULF 1.6 gpf toilets with auto flush units - 9 waterless urinals Upon the installation of these water saving systems total operating expenses are expected to decrease by approximately $10,071.64 annually. Taking into account that these improvements will be made the projected end of year NOI for 2008 is $598,487.00, which equates to a current valuation of $7,833,599.48 with a cap rate of 7.64%. The end result is a value enhancement of $131,819.30. The forecasted NOI for year 5 (2013) of $533,068.00 at a cap rate of 7.75%, based heavily on the impending recession and forecasted decline 12
- 13. in property values due to the current state of the capital markets, overall economy and upcoming presidential election, produces a value at the end of the 5-year holding period of $6,878,296.77 (the capitalization rate is forecasted to increase at most 86 basis points above the current cap rate at different times throughout the holding period). The projected increase in value enhancement in Year 5 of $108,886.40 is much more favorable than if the property is left “as is”. The key factor in the negative value enhancement and decline in property value is solely the state of the economy and the capital markets. There is nothing that can be done to deter this and increase the property value via the cap rate fluctuations other than significantly reducing the operating expenses or increasing the rental rates (i.e. prudent management). Implementing a capital improvement with a very favorable cost/savings ratio has the ability to result in both of the aforementioned options. Had the economy continue to flourish and capital markets gradually improve as in past years not only would the value of the property increase but the value enhancement would also be positive instead of merely lessening the plunge in value enhancement. 13
- 14. Appendix Exhibits I. Floor Plans for floors 1 – 5…………………………………….1 II. Flood Map……………………………………………………….6 III. Overhead Aerial View………………………………………….7 IV. Plat Map…………………………………………………………8 V. Overhead Aerial View………………………………………….9 VI. Management Agreement…………………………………….10 VII. Sample Certificate of Insurance…………………………….32 VIII. Details of Insurance Coverage……………………………. .34 IX. 2008 Budget – “As Is”………………………………………..37 X. 2008 Budget – Alternative #1…………………………….…49 XI. Comparable Sales (3).………..……………………………..50 XII. Income & Expense Statements – 2005 thru 2007………..67 XIII. Inventory List – Alternative #1……………………………...90 XIV. Water Savings Calculations………………………………...91 XV. Building Upgrade Value Calculator………………………..93 XVI. 2Q 2008 Korpacz Real Estate Investor Survey………….94 XVII. Additional Photos of Comparable Properties…………….96 XVIII. Certification and Disclosures……………………………..102 XIX. Qualifications of the Analyst……………………………...103 14