Download to read offline
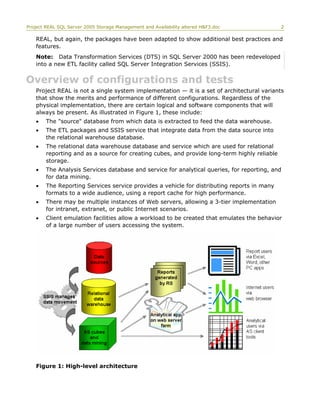
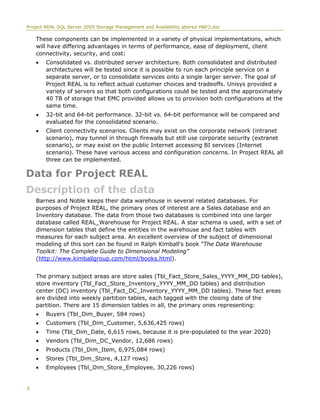
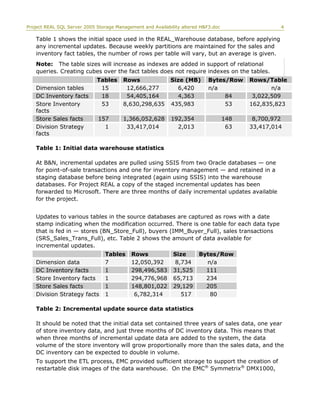
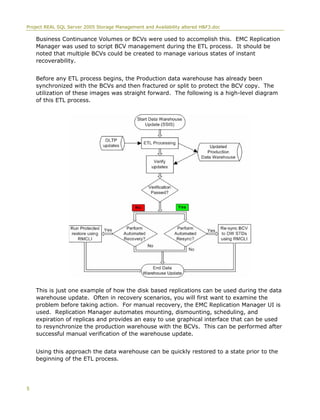


This document discusses Project REAL, a joint effort between Microsoft and its partners to discover best practices for implementing business intelligence applications using SQL Server 2005. It used real customer data and scenarios to address issues in data warehouse design, ETL processes, reporting, sizing systems, and ongoing management. The project tested different storage configurations and hardware to determine optimal solutions. Topics covered include data partitioning, cube partitioning, data migration strategies, backup methodologies, and the storage hardware used.