Download to read offline


![2 | P a g e M o d u l e III
S6 ME MBITS Project Management
Importance of Corporate Risk
Undiversified investors (promoters) are more concerned about Corporate Risk than Market Risk.
Even Diversified investors (Retail investors) are interested in this Risk because it has a bearing on the
earnings and obviously the required returns.
The stability of the firms cash flows are valued by managers, suppliers, creditors, customers and the
community in which the firm operates and they take this measure as a criterion for joining hands with the
firm.
Importance of Market Risk
The ultimate aim of the project and the company is to maximize the shareholders wealth and therefore
this measure of Risk is very important.
Measurement of Risk
Sensitivity Analysis, Simulation, Standard deviation and Hillier Model are absolute measures of Risk,
whereas the coefficient of variation is a relative measure.
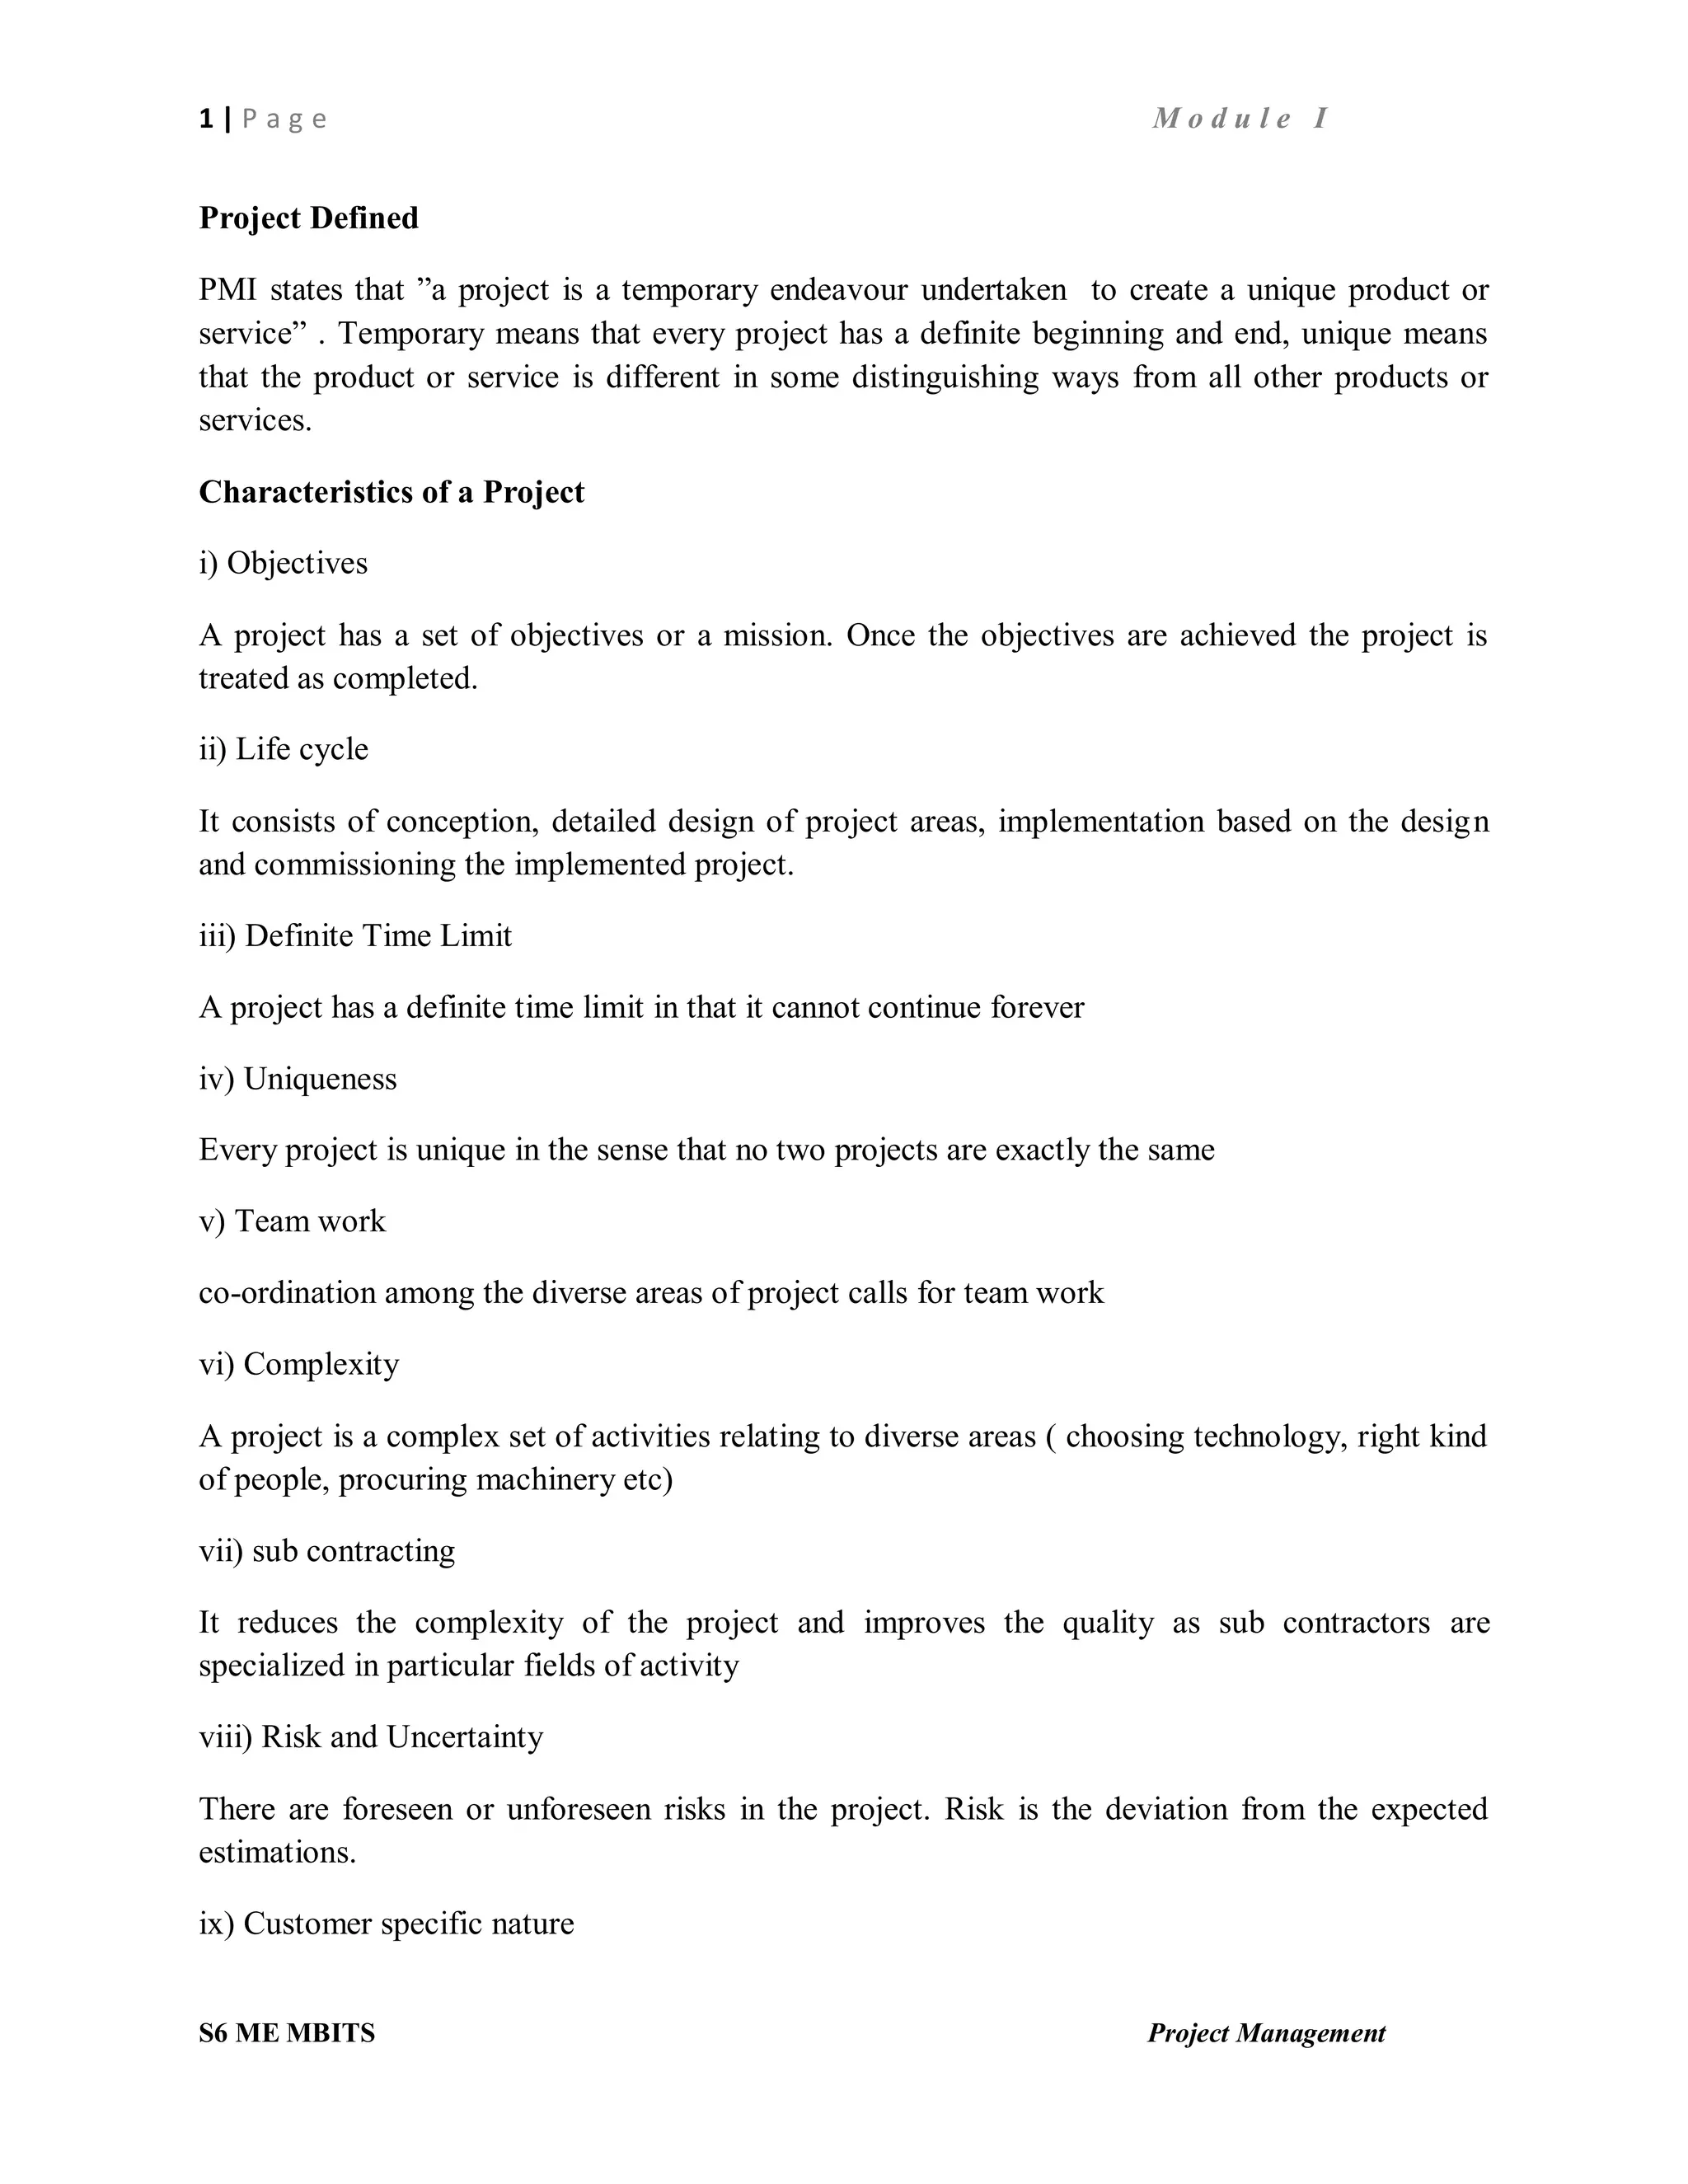
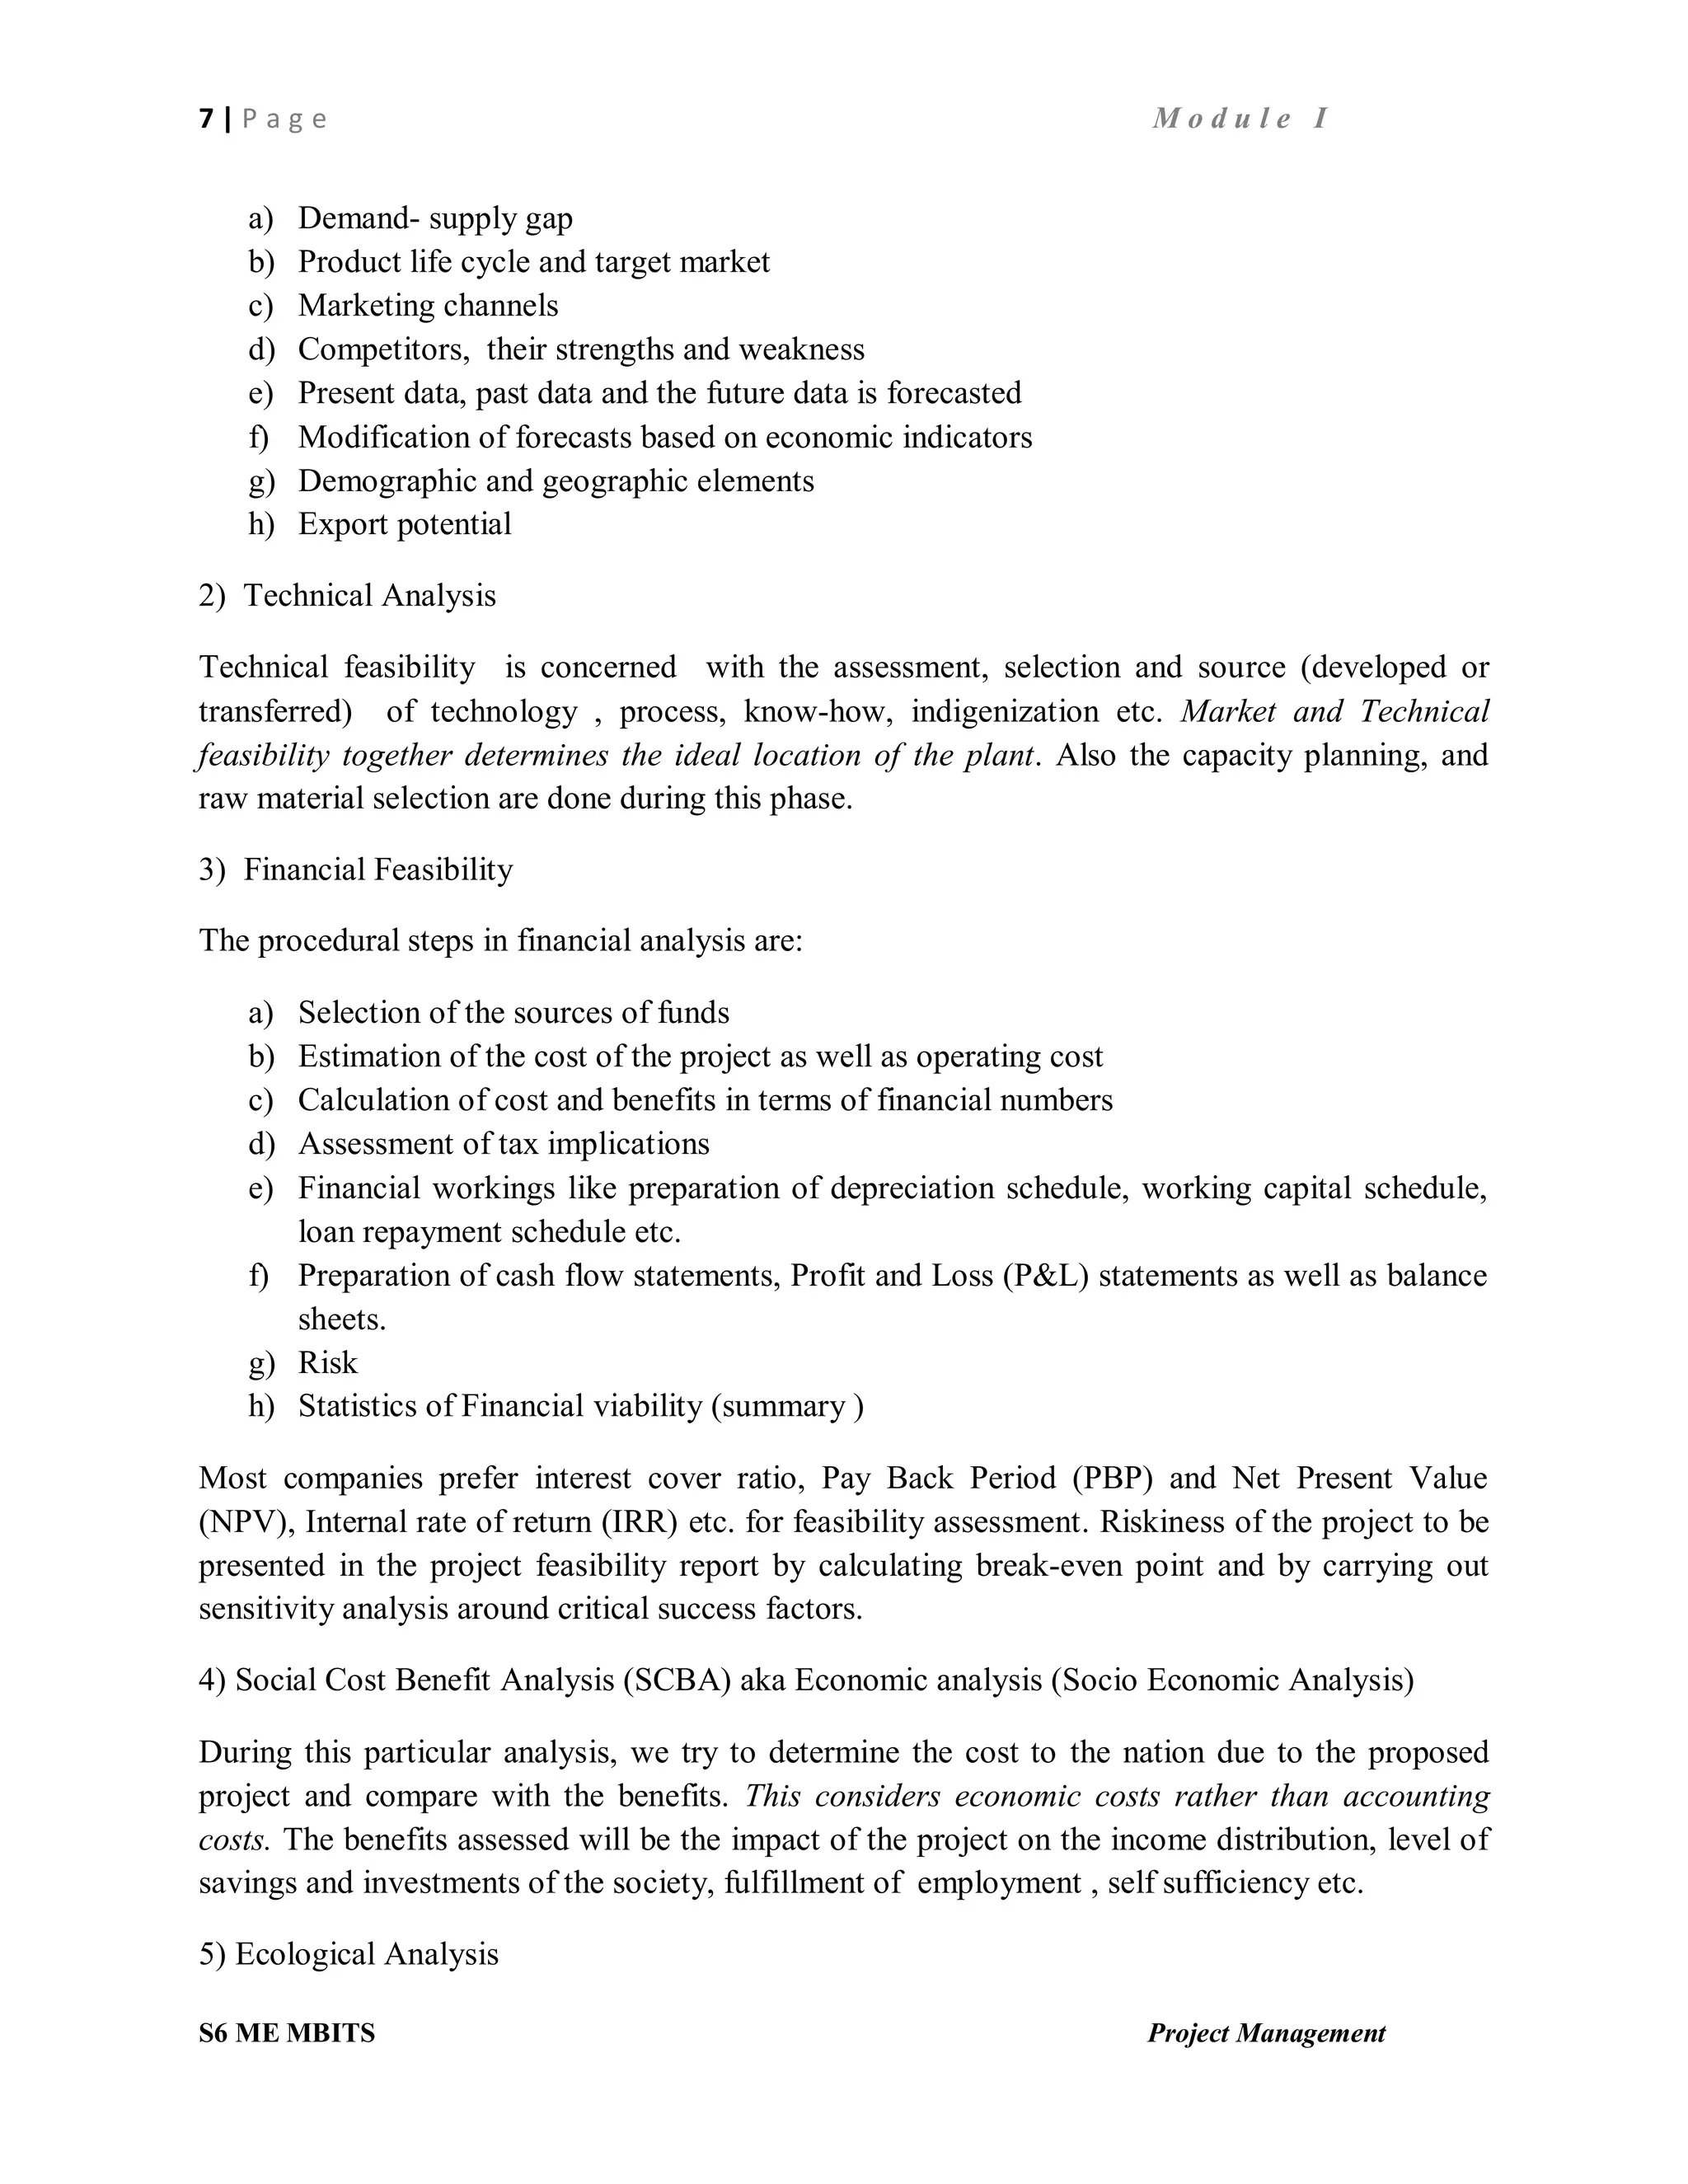
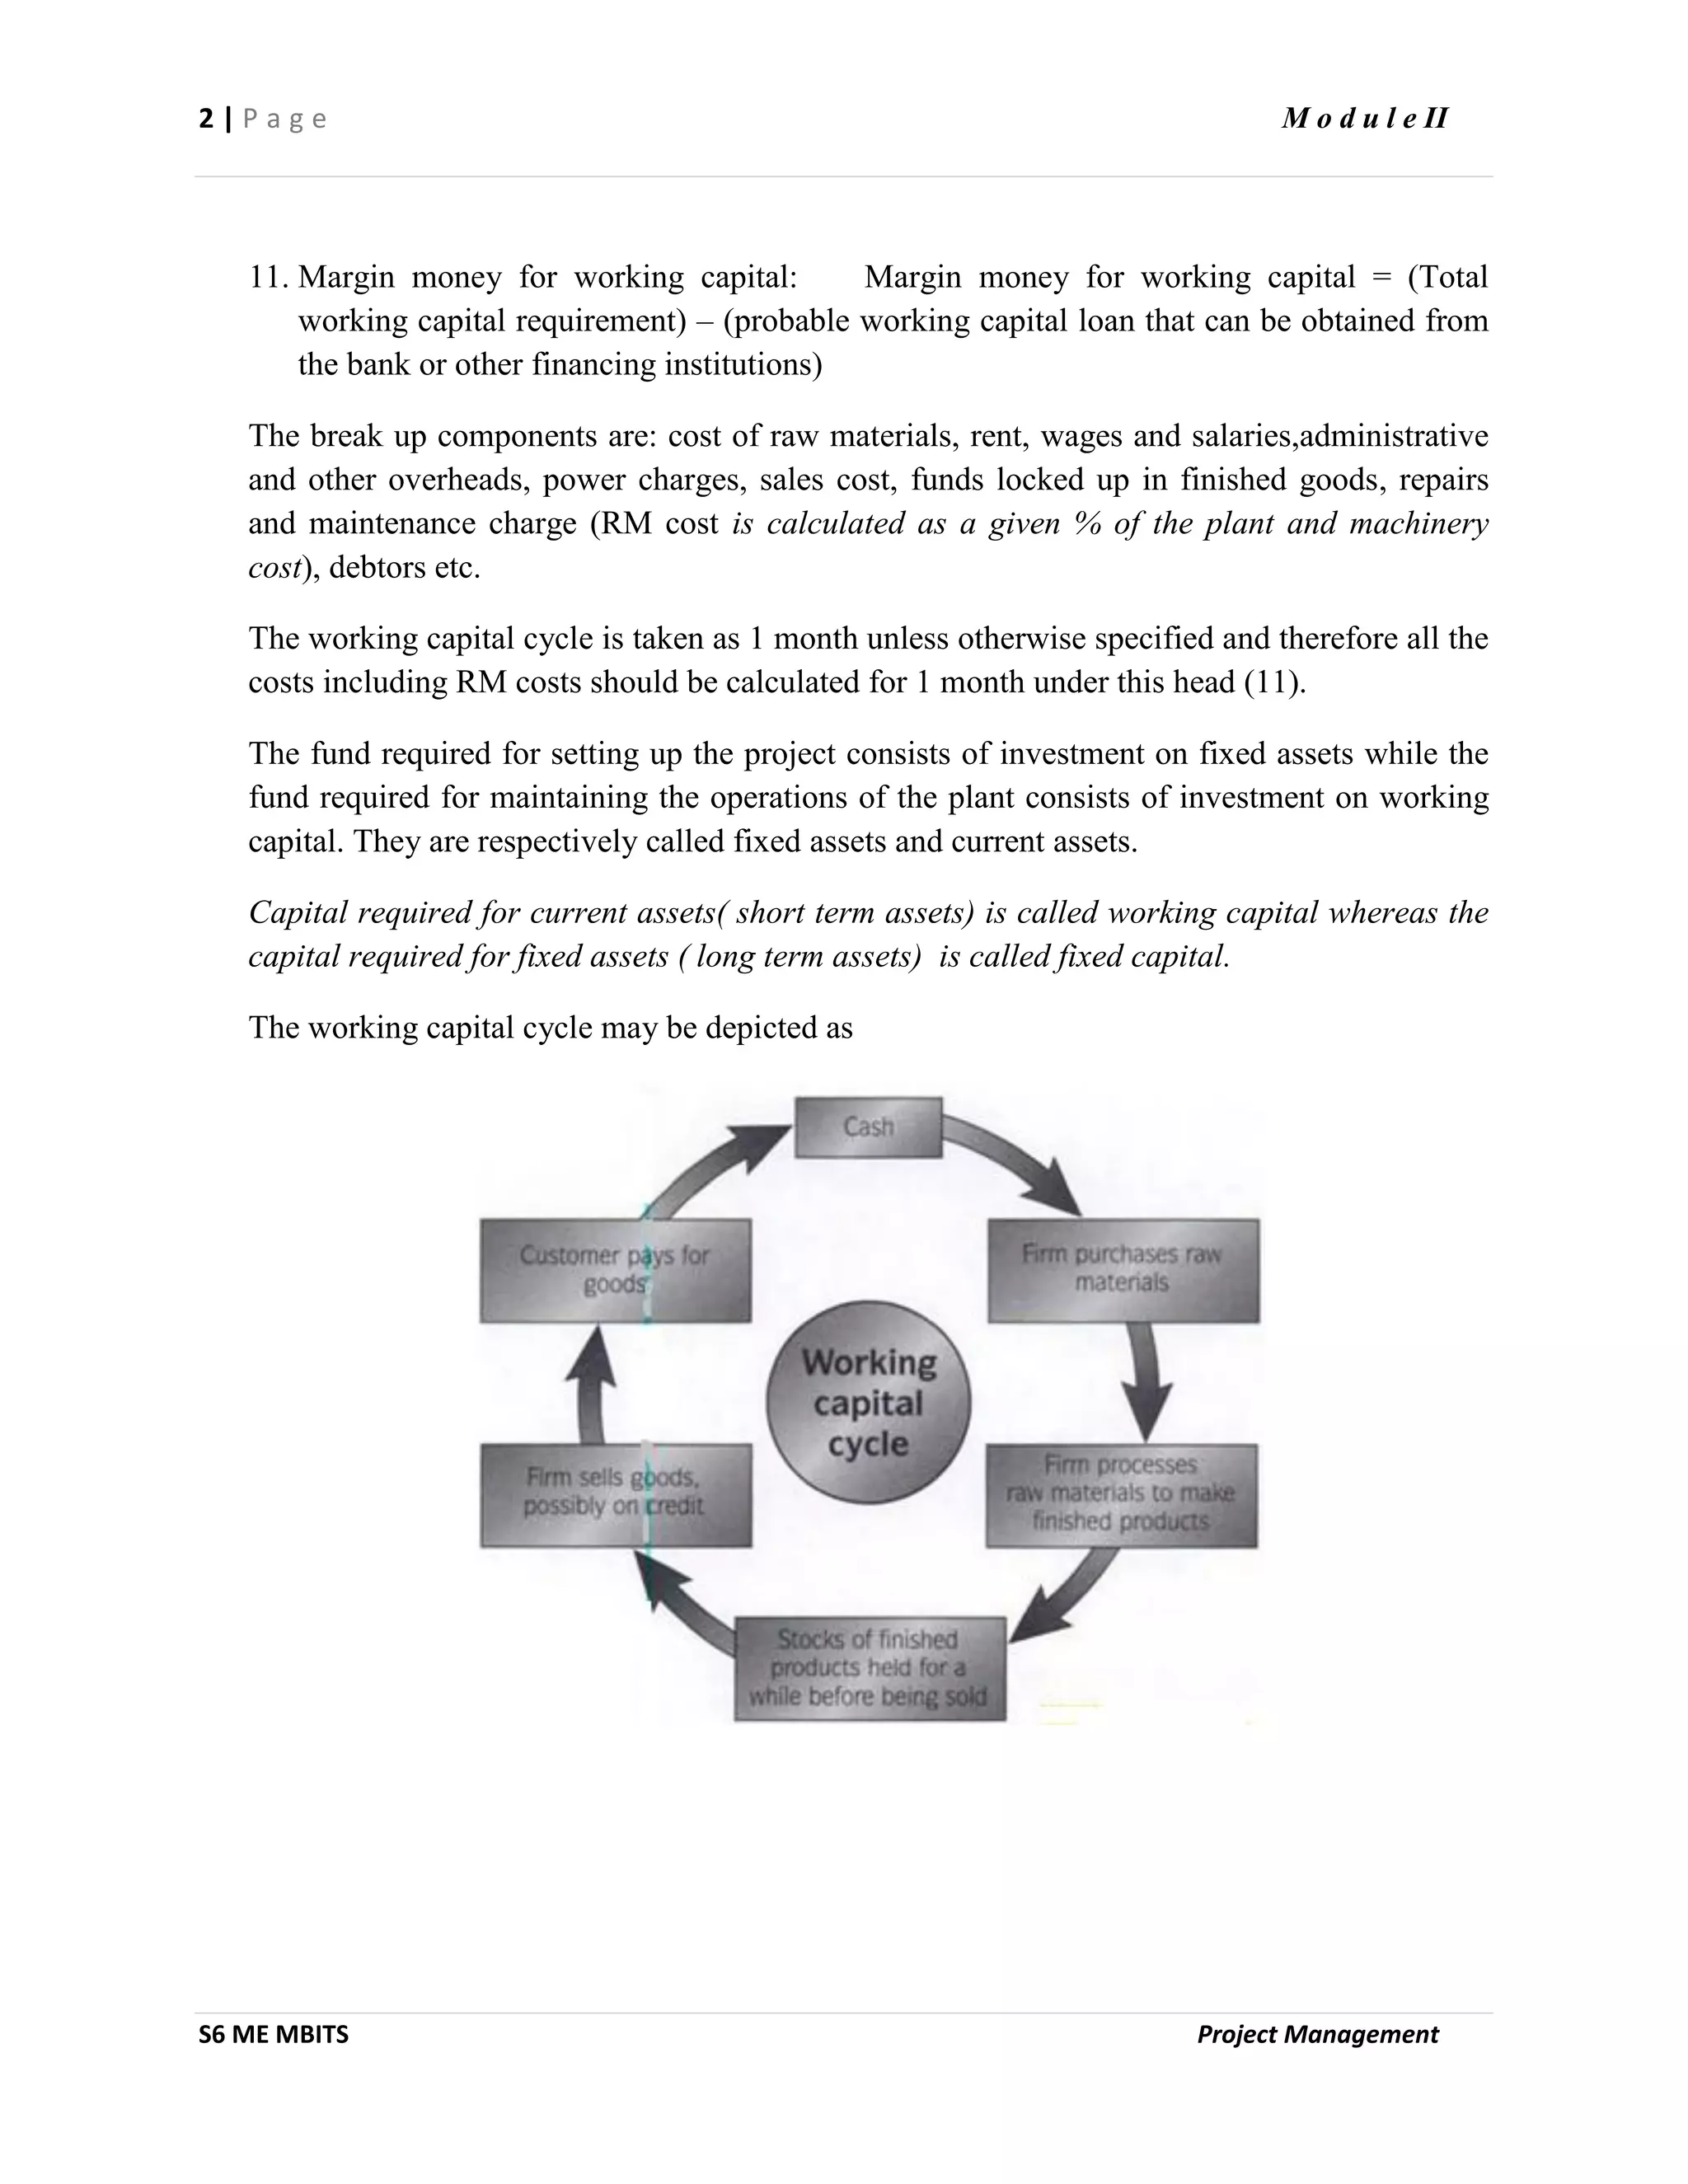
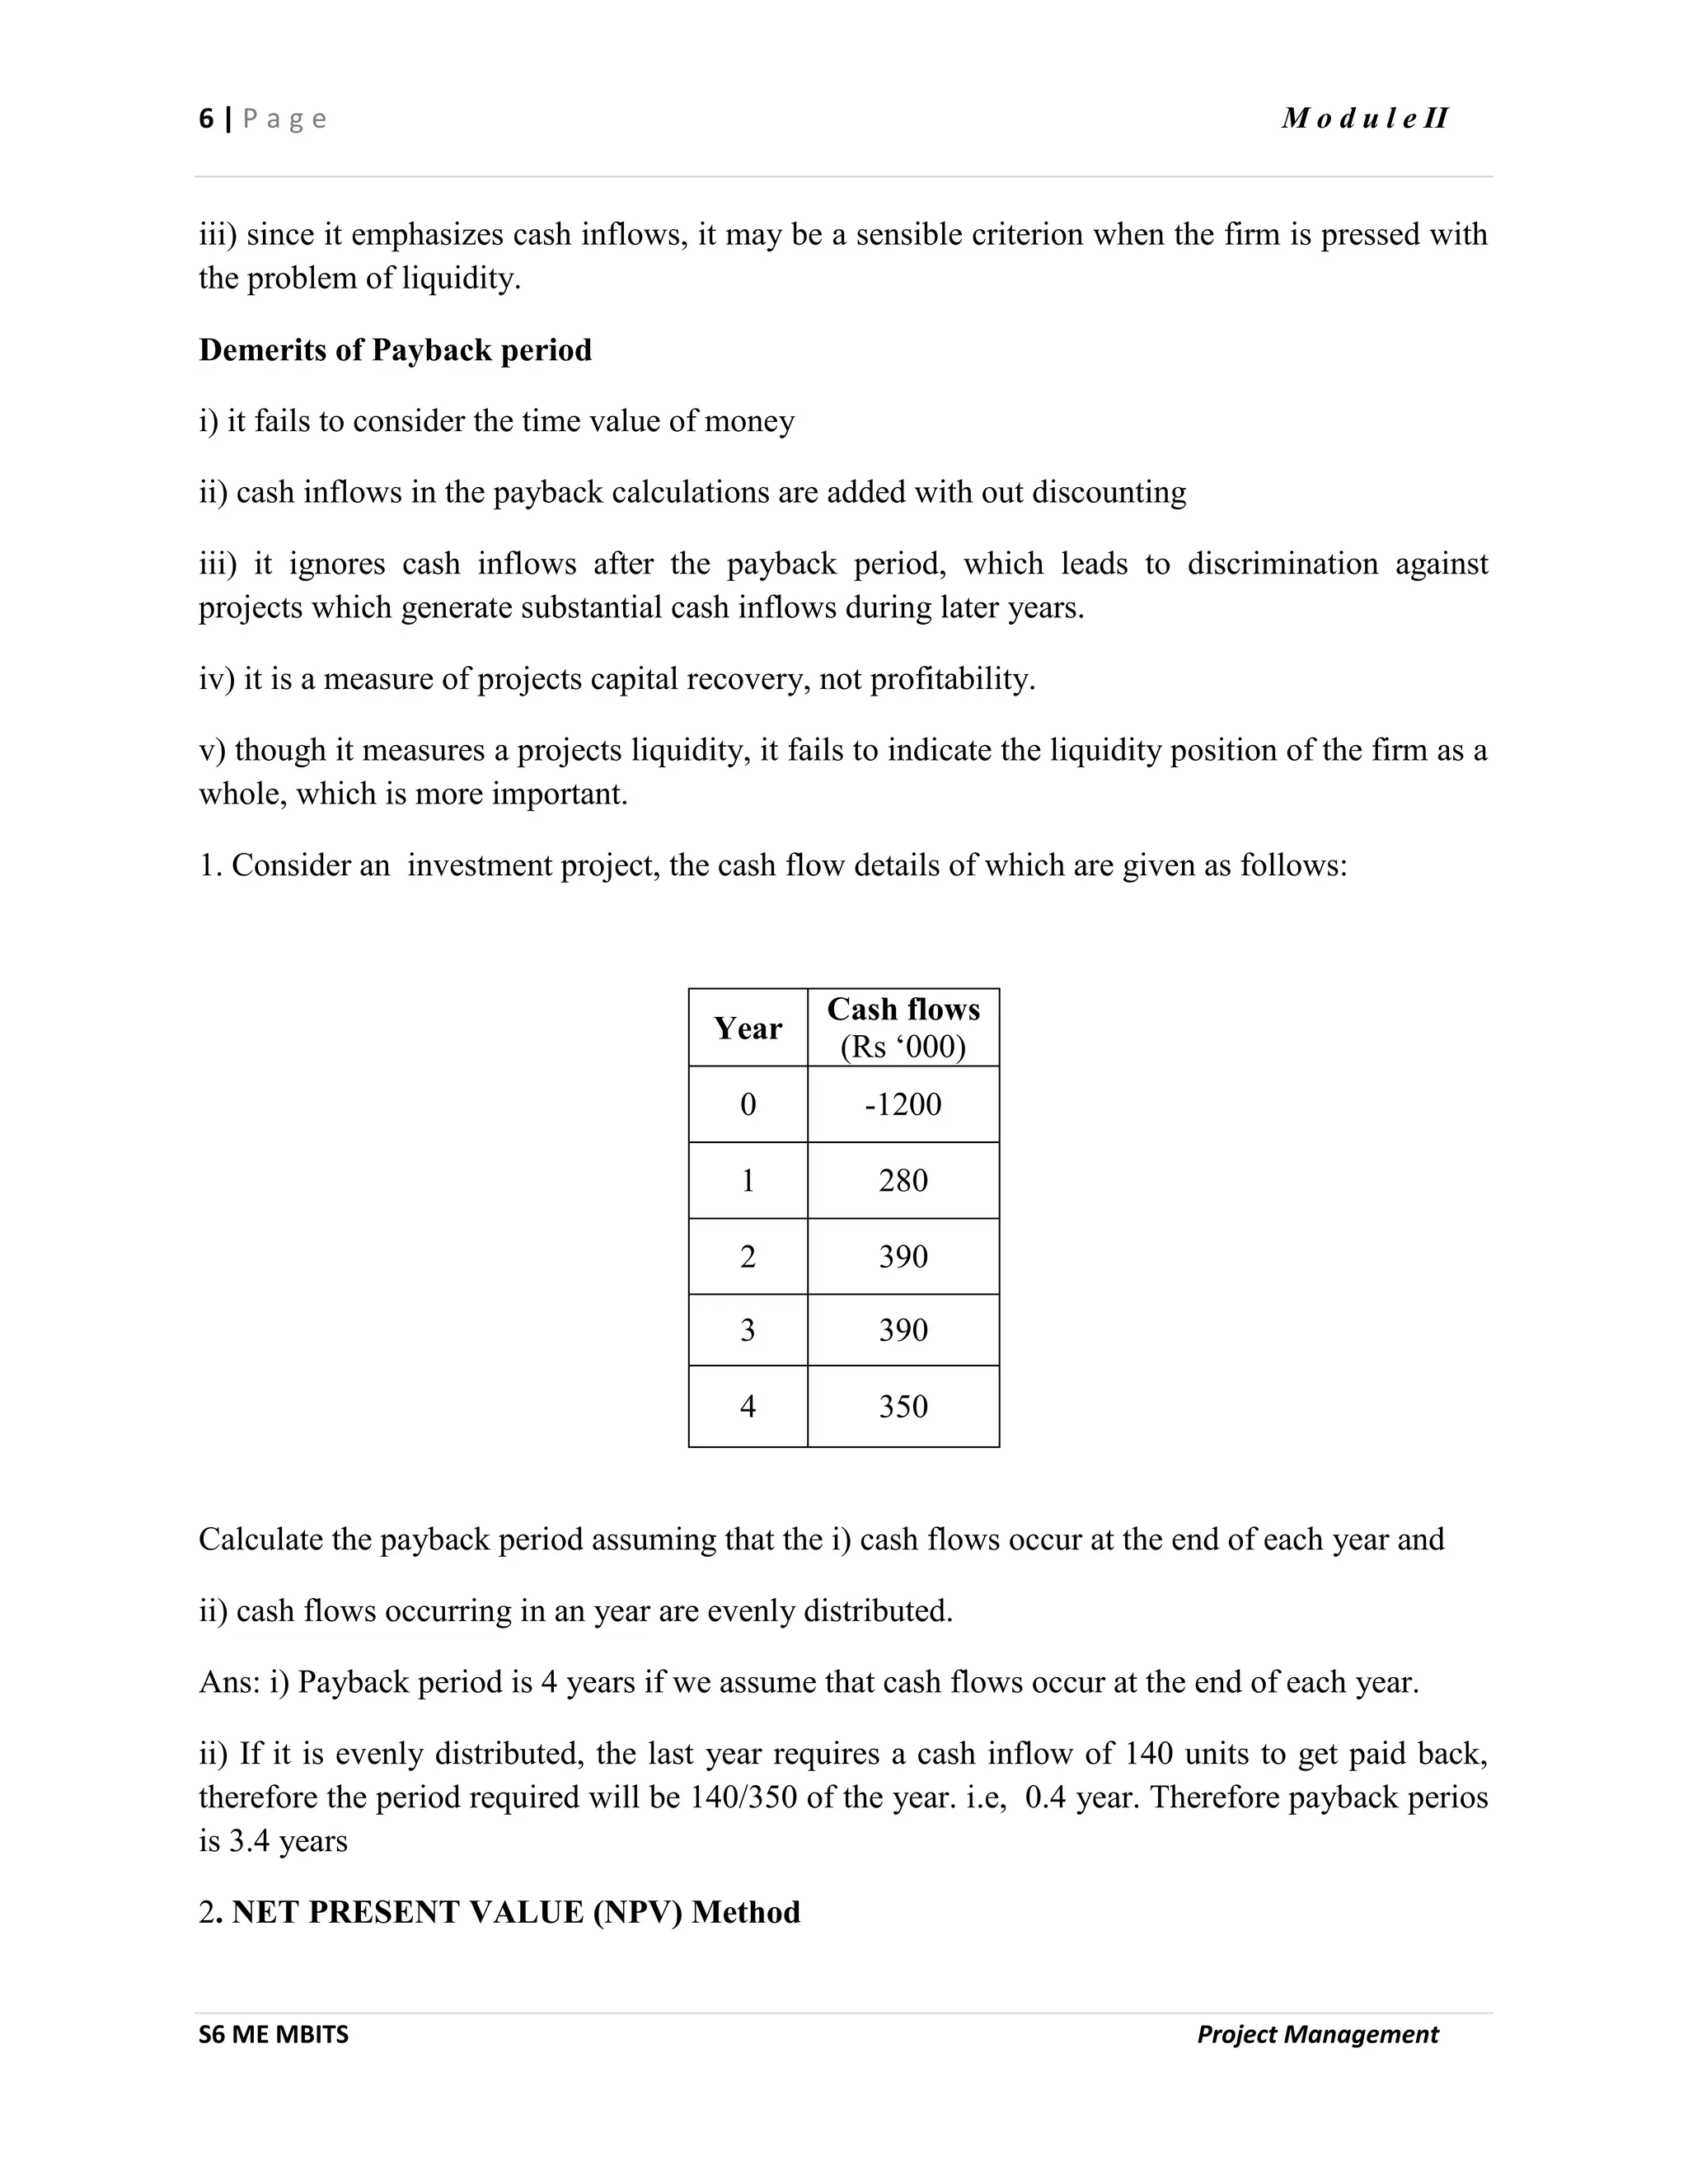
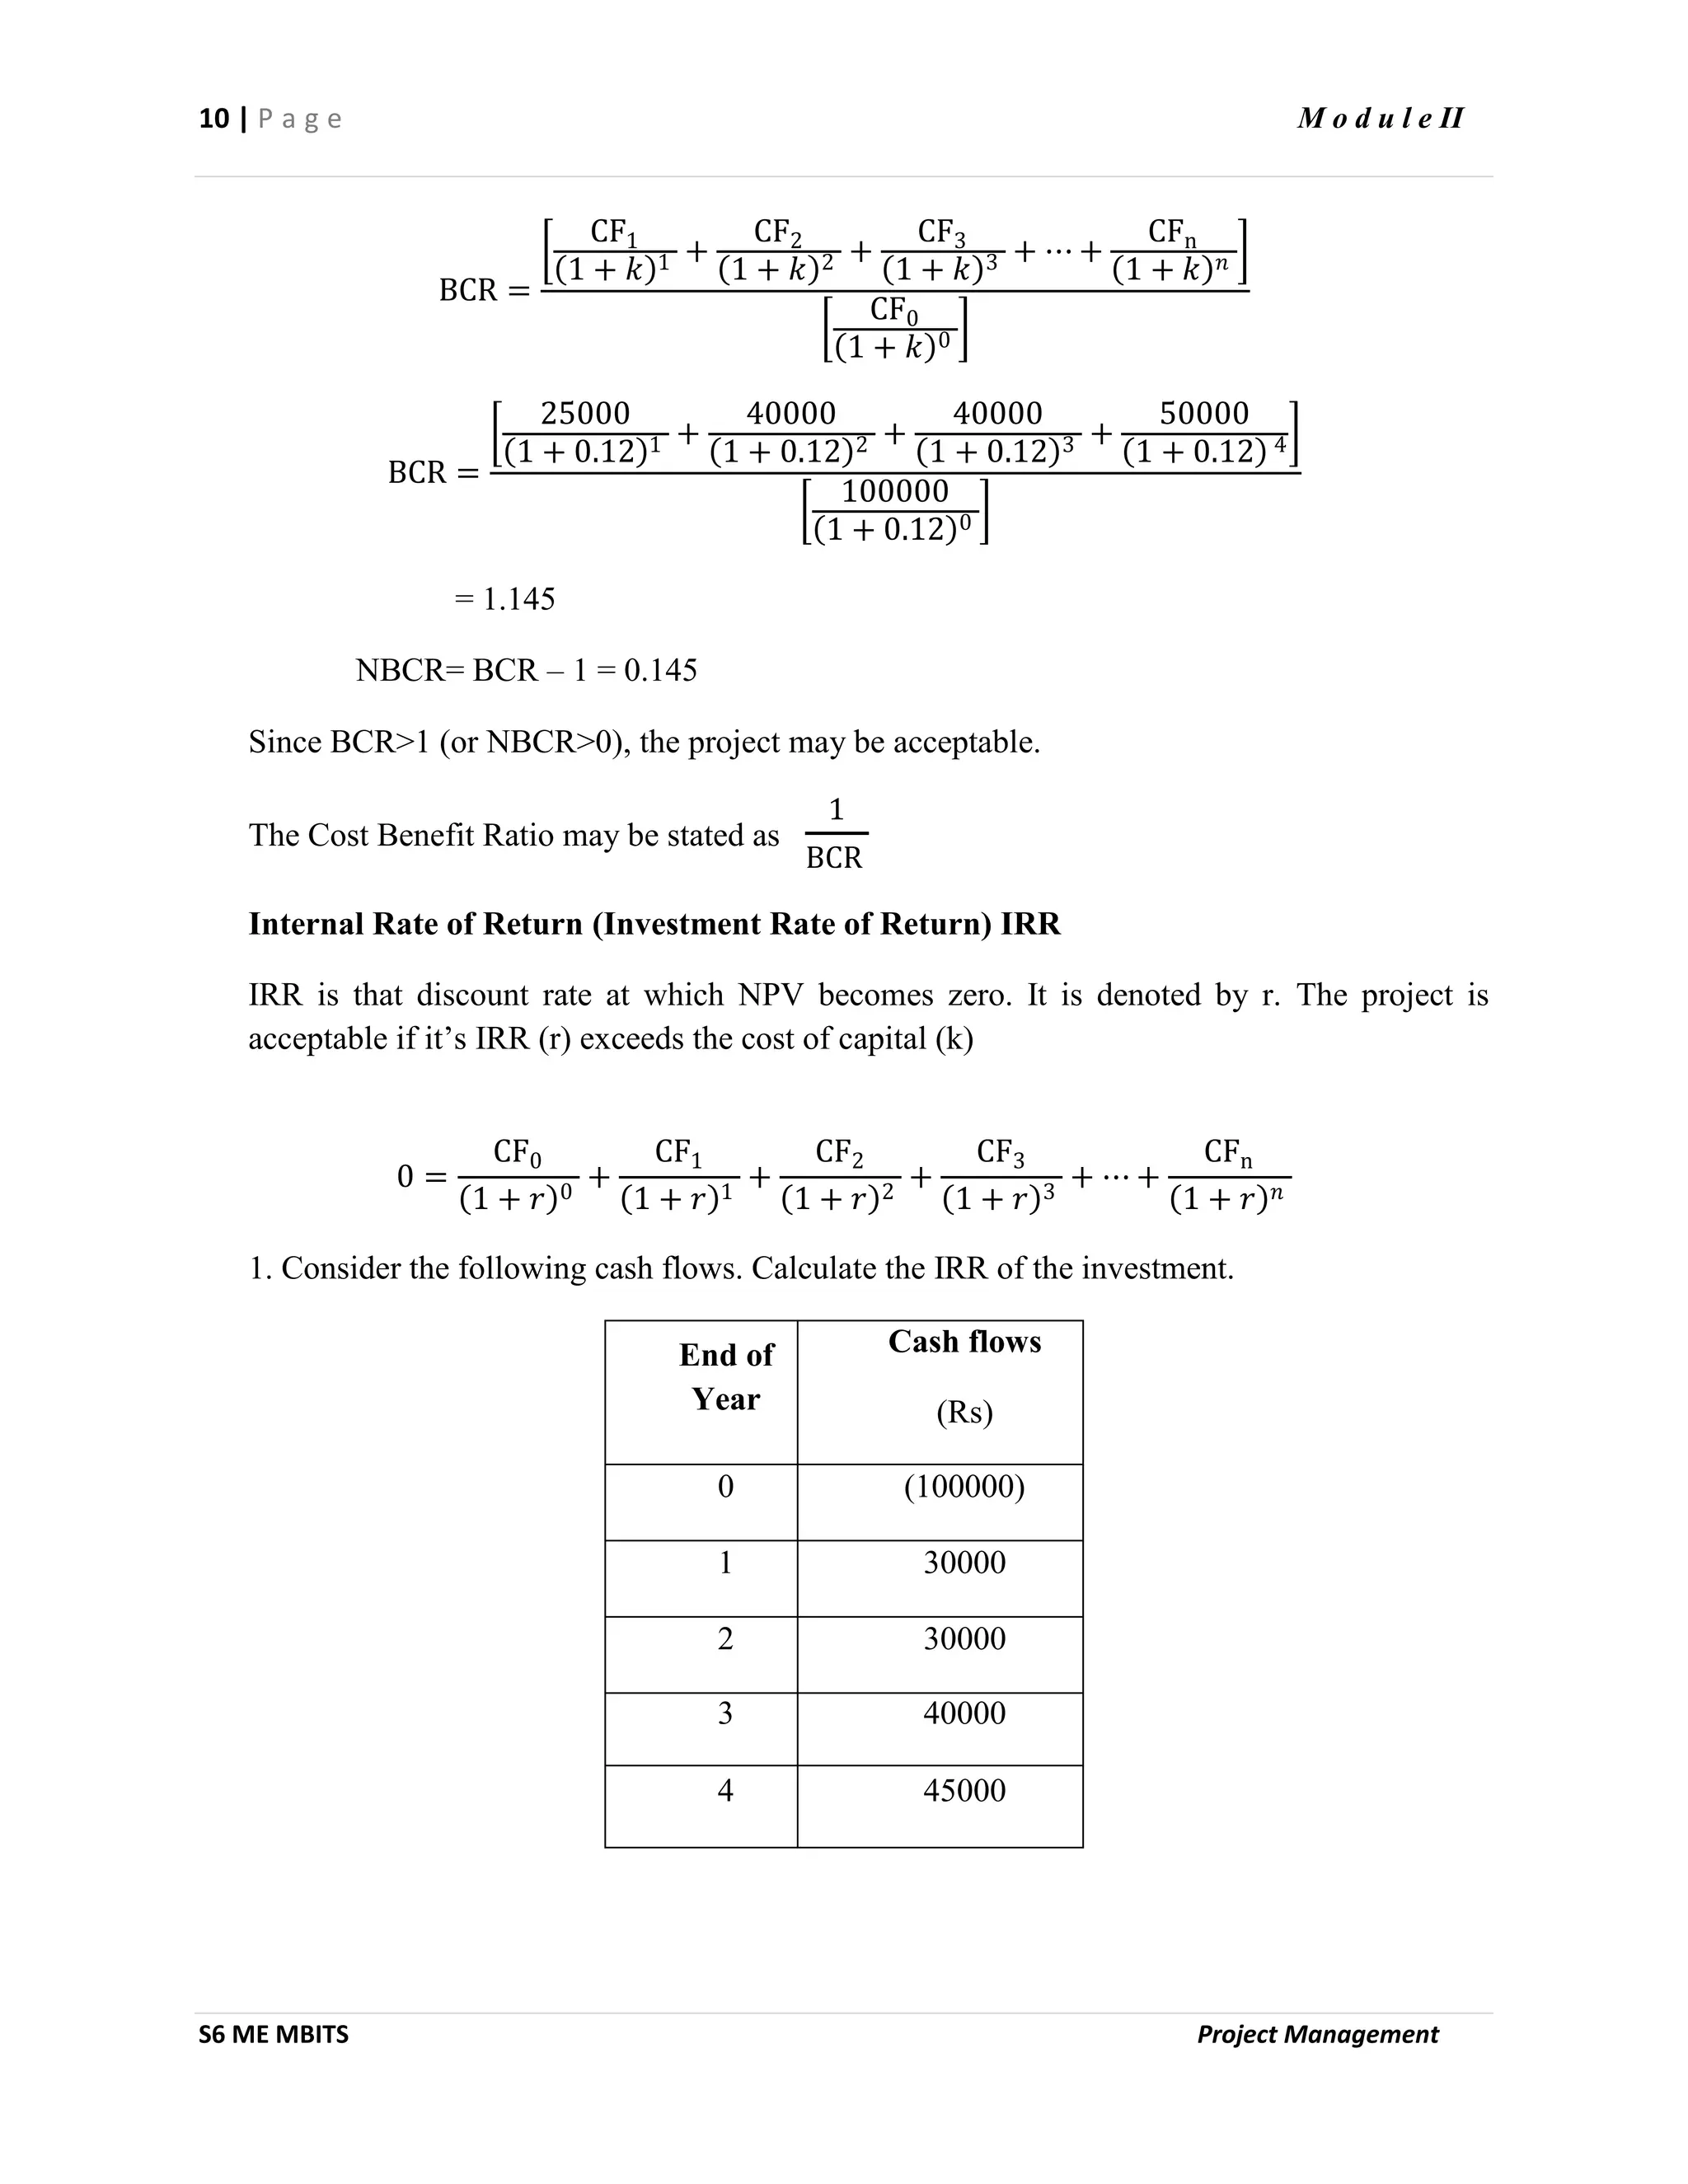
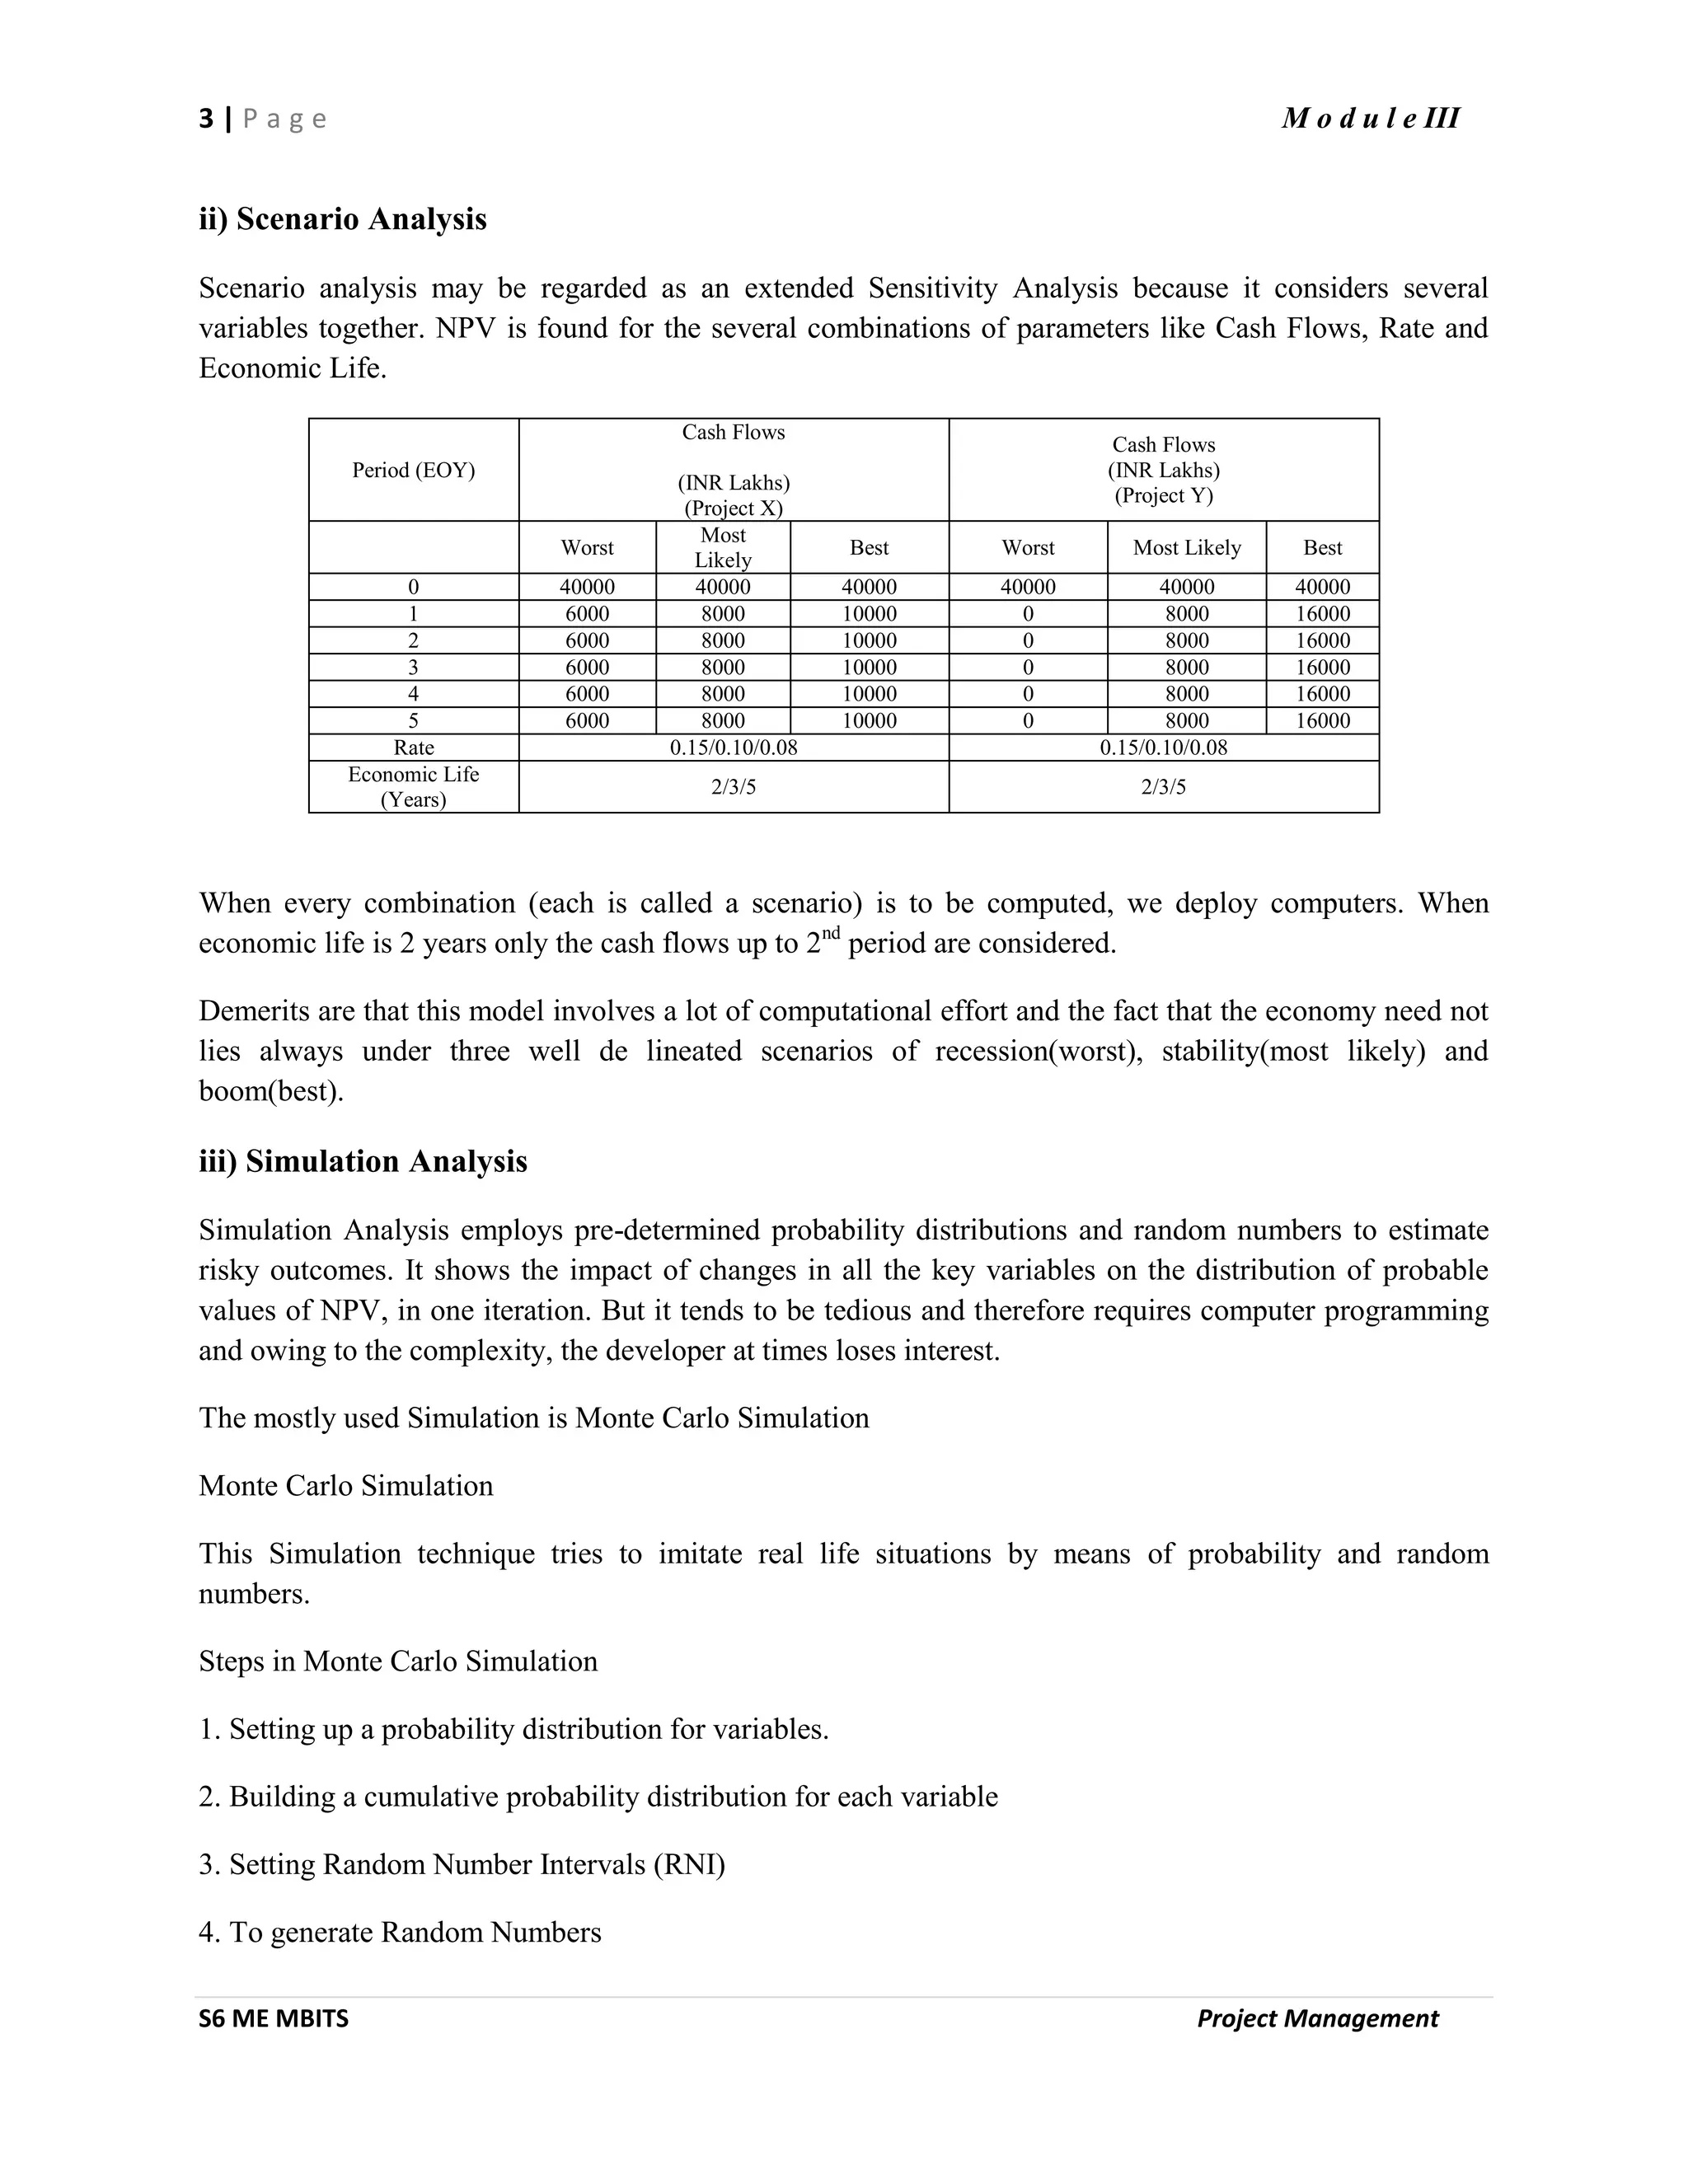
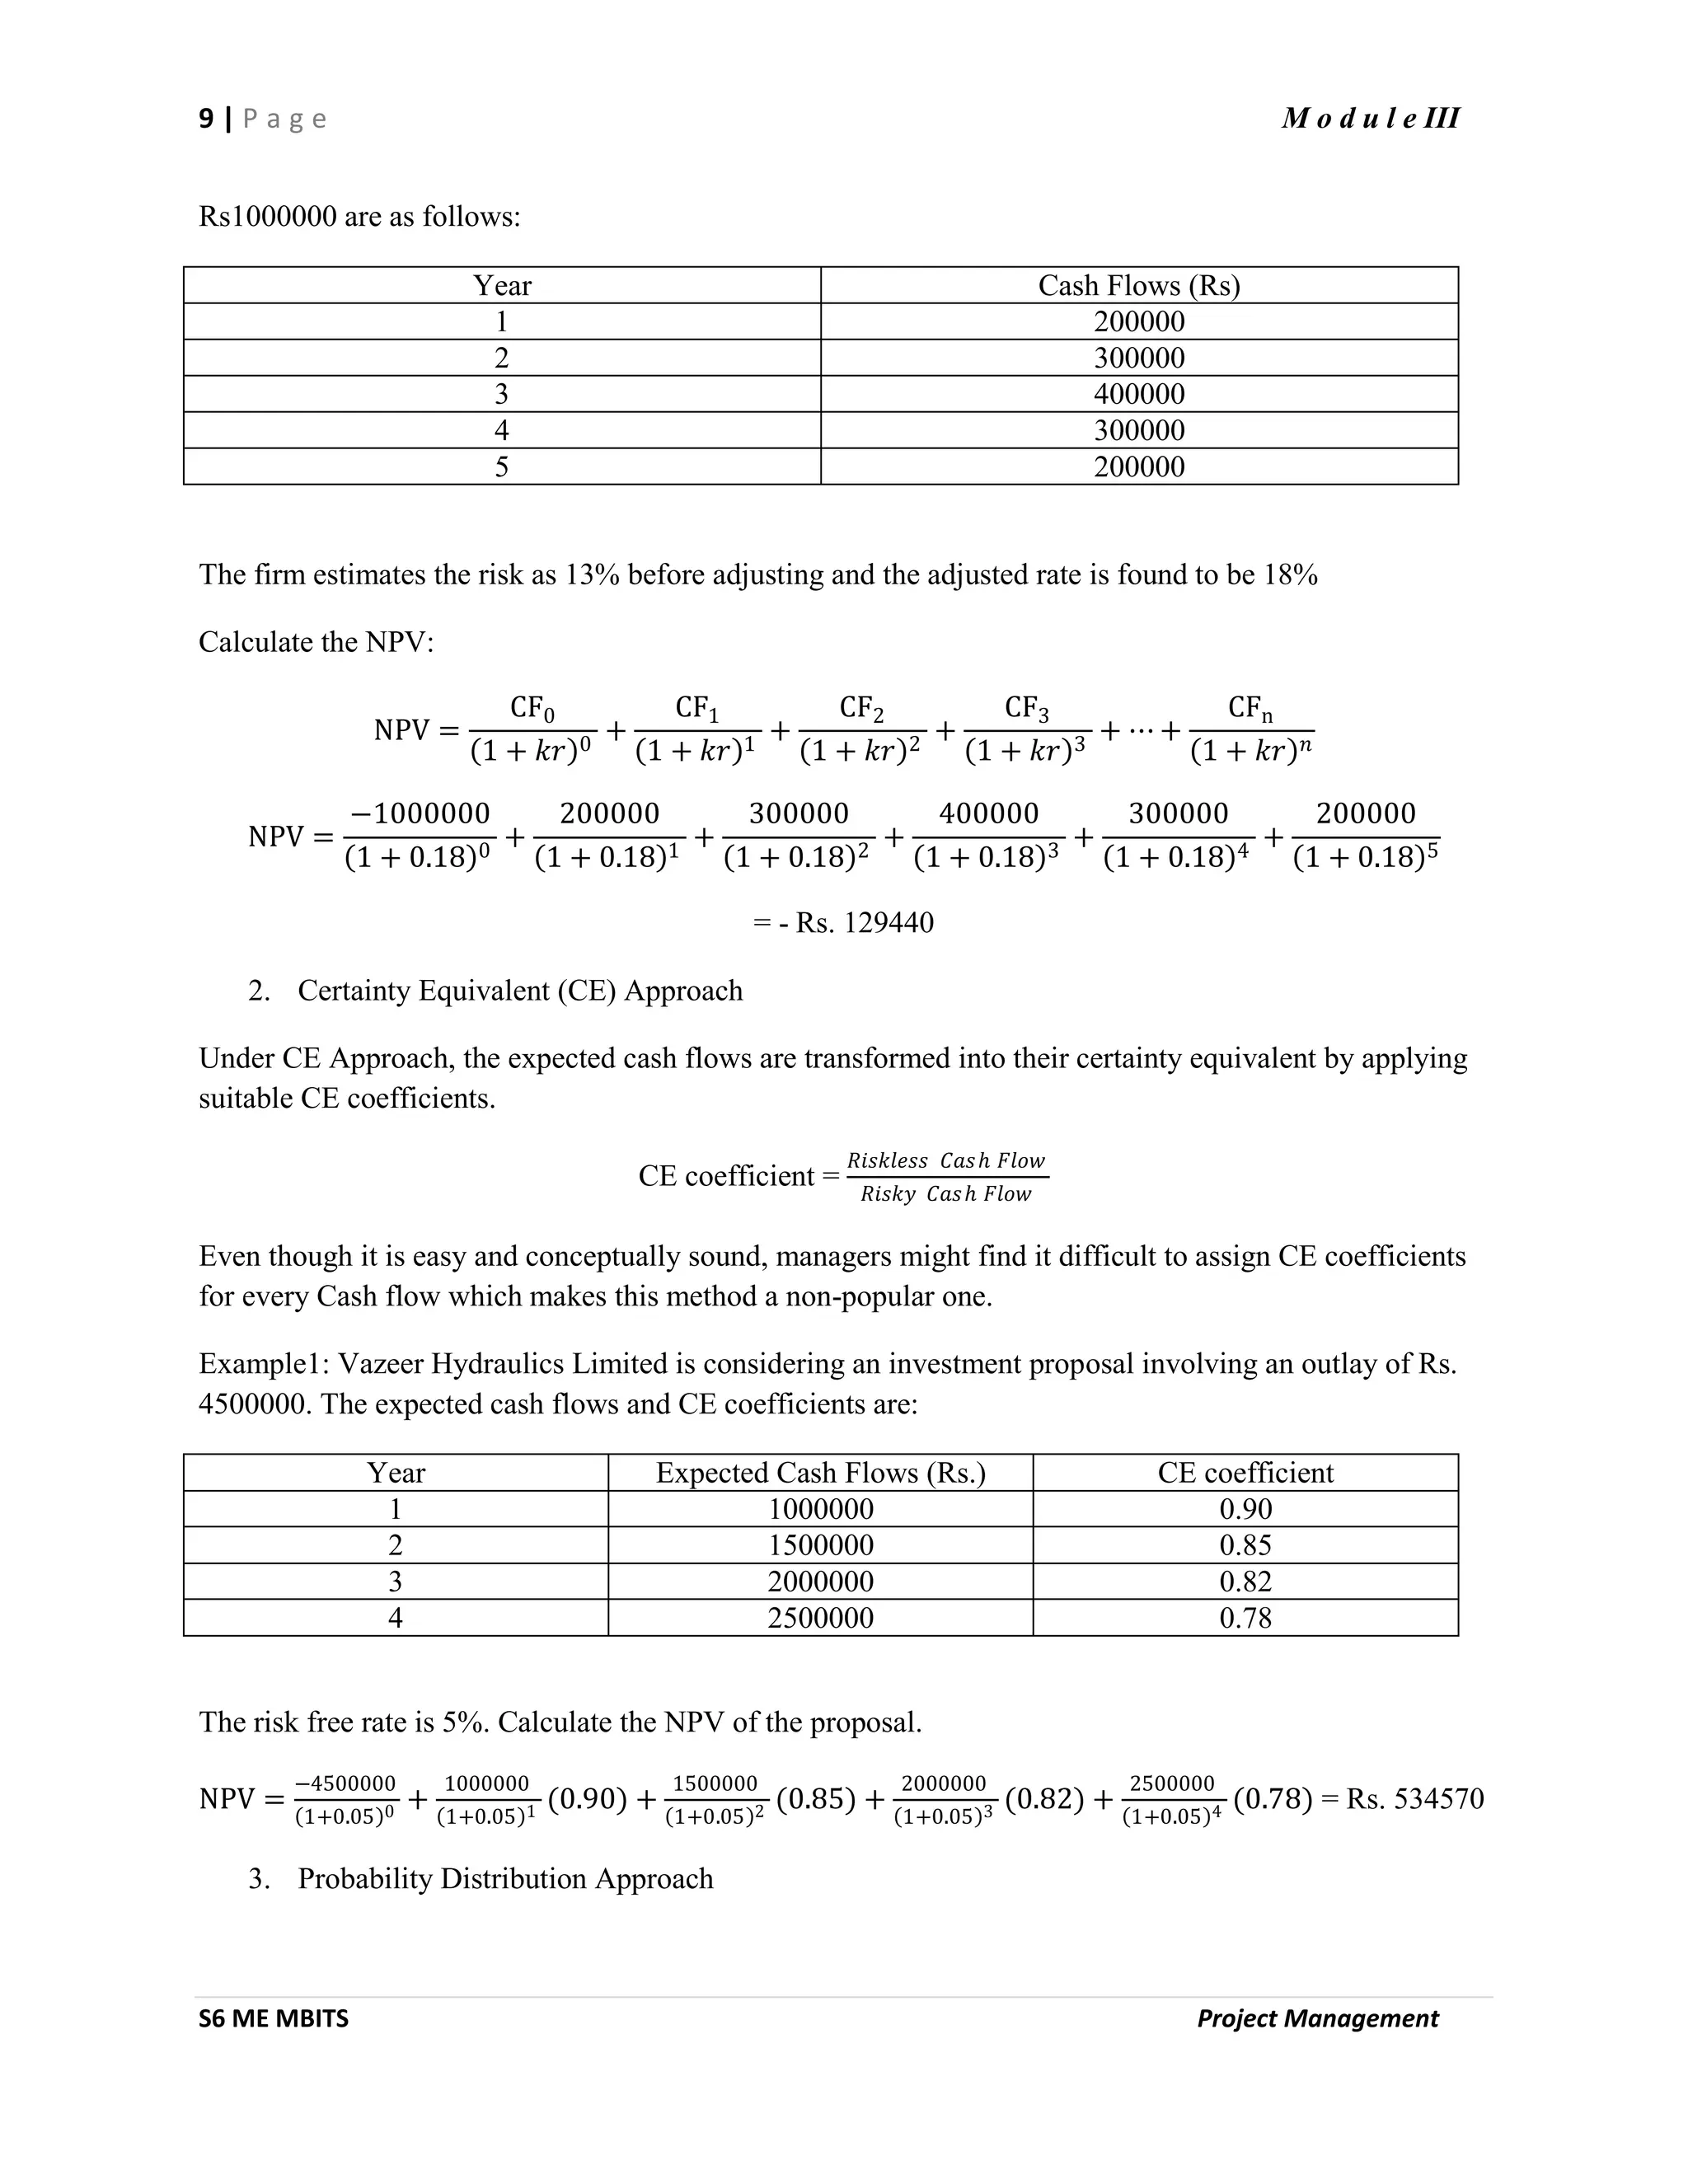
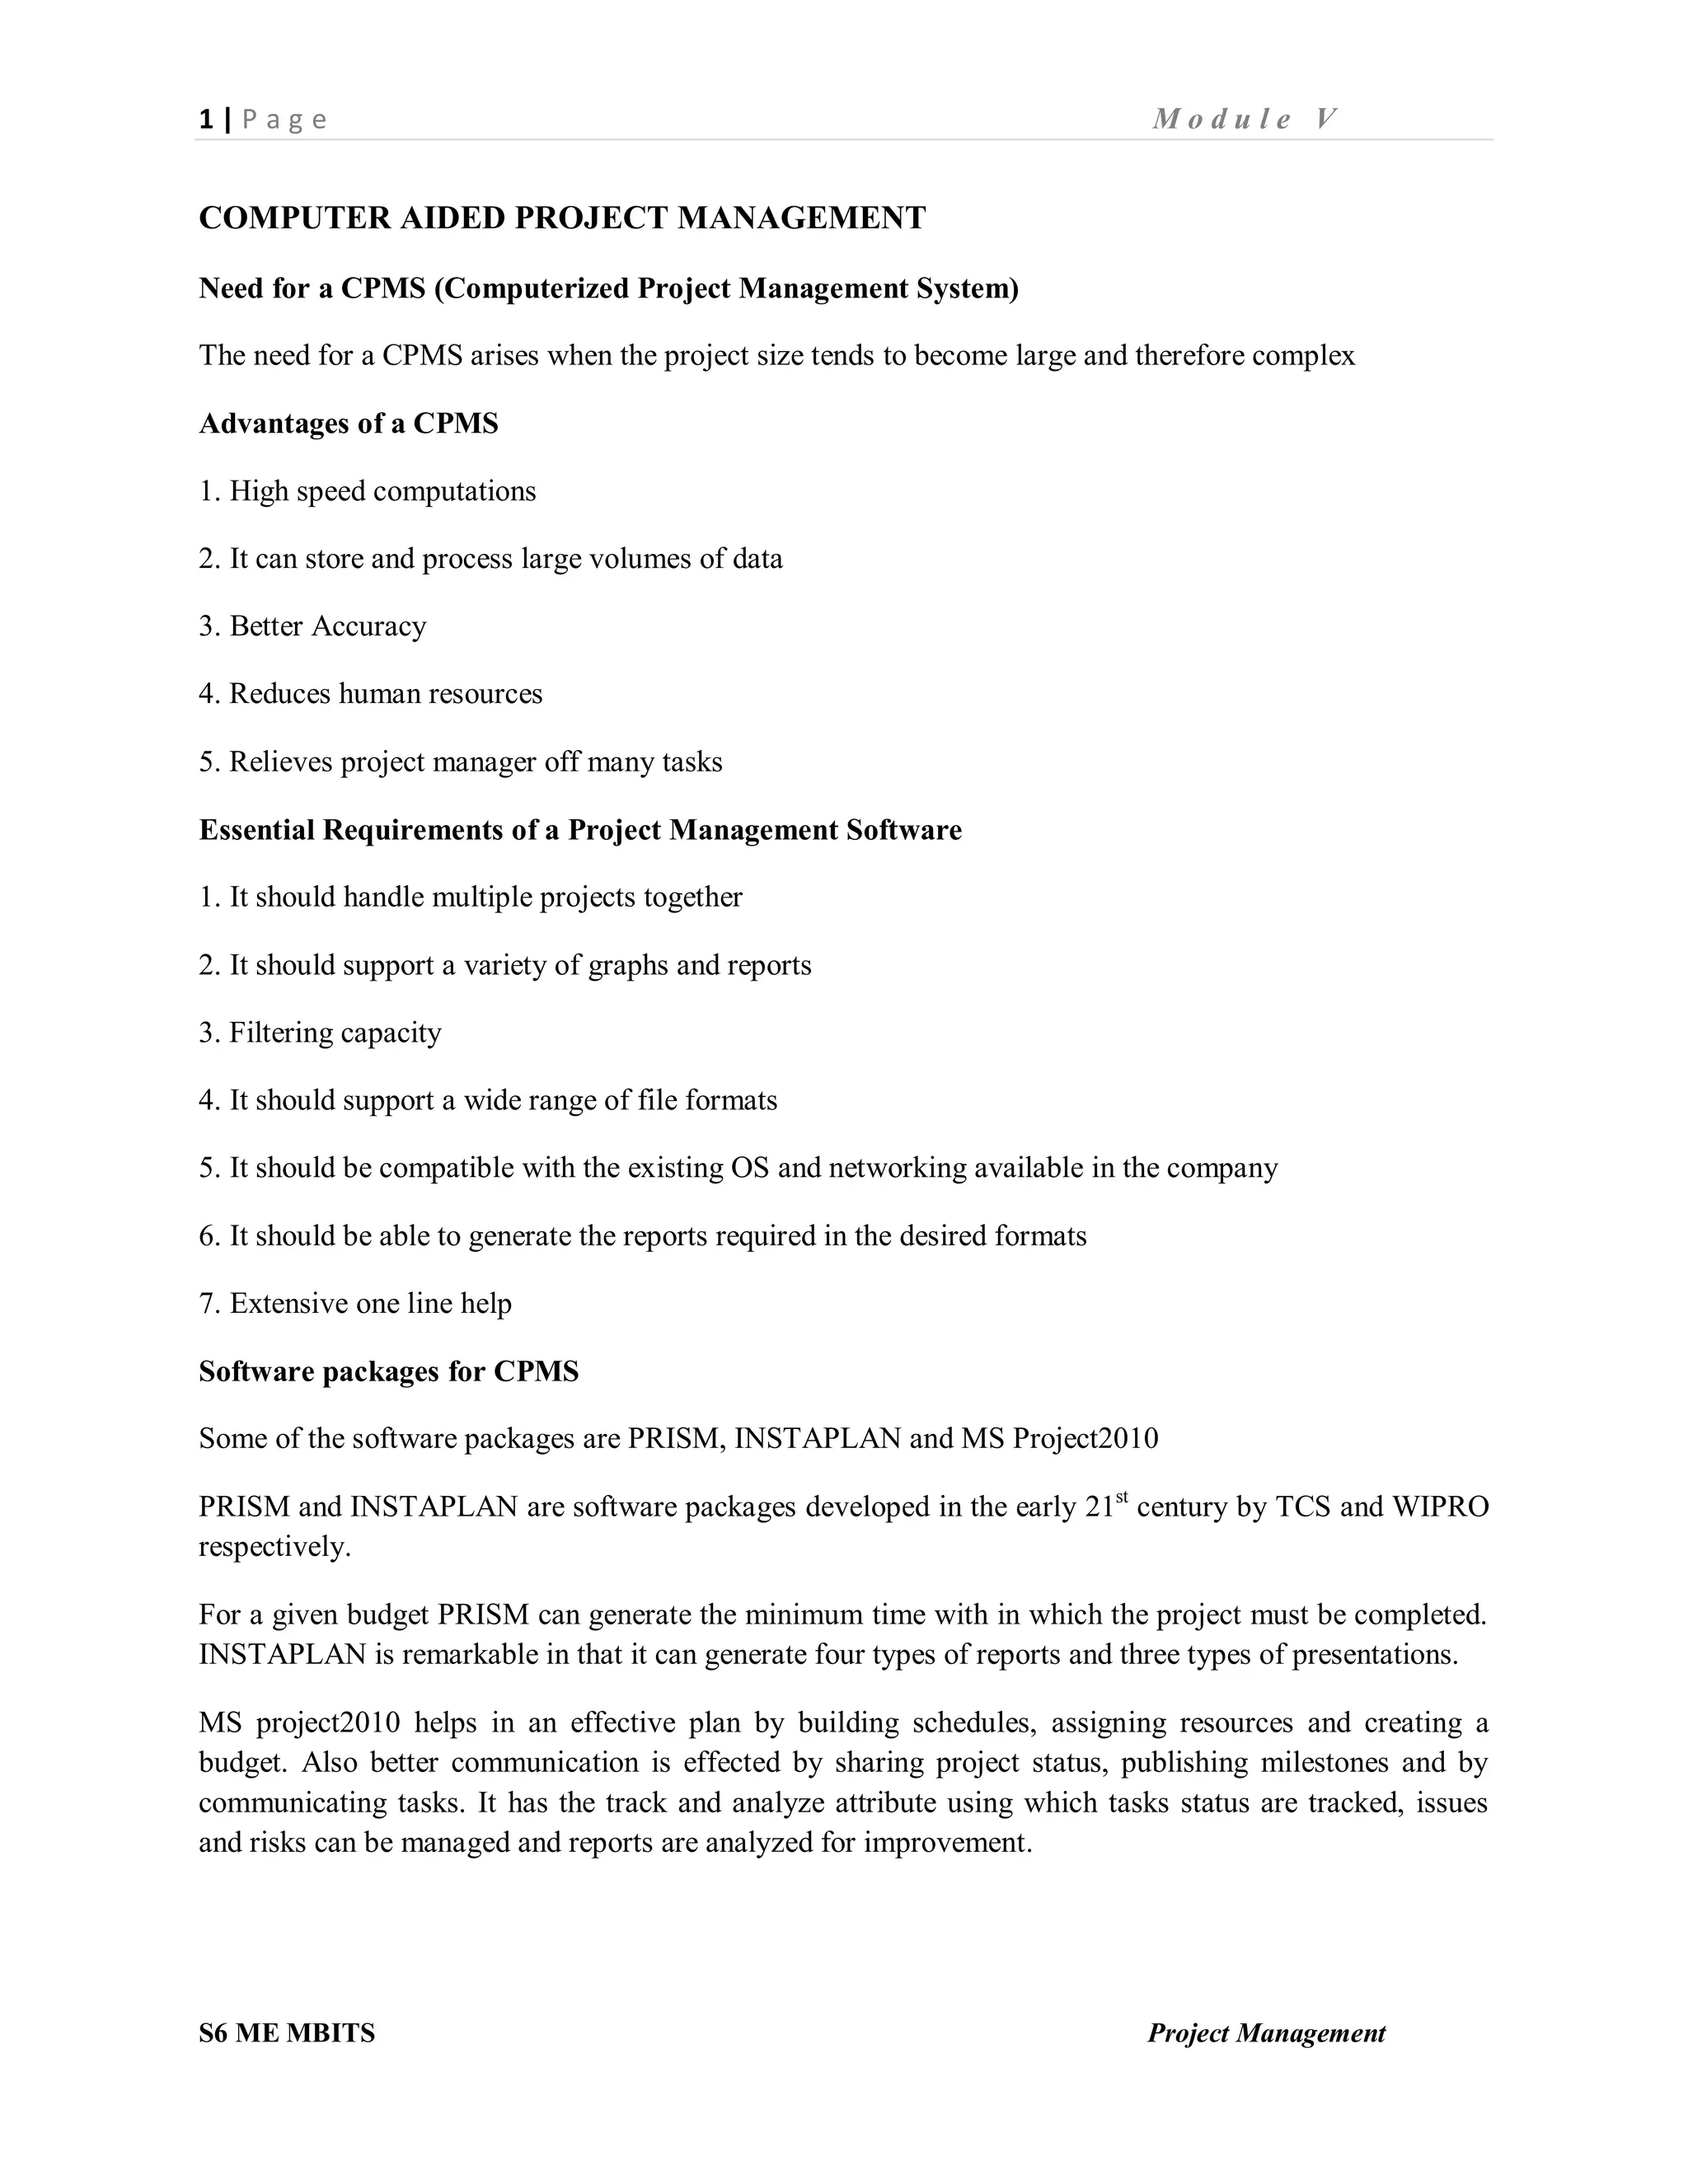
i) Sensitivity Analysis
Sensitivity analysis provides information as to how sensitive the various estimated project parameters
namely Cash Flows, Cost of capital and projects economic life are to estimation errors. In most cases the
variation in NPV are found out for the three different situations like best, most likely and worst.
Period (EOY)
Cash Flows (INR Lakhs)
[Project X]
Cash Flows (INR Lakhs)
[Project Y]
Worst
Most
Likely
Best Worst Most Likely Best
0 40000 40000 40000 40000 40000 40000
1 6000 8000 10000 0 8000 16000
2 6000 8000 10000 0 8000 16000
3 6000 8000 10000 0 8000 16000
Rate 0.10 0.10
Economic life
(Years)
3 3
Sensitivity Analysis performed on the above yields an outcome which is summarized in the following
table:
Period (EOY)
Cash Flows (INR Lakhs)
[Project X]
Cash Flows (INR Lakhs)
[Project Y]
Worst
Most
Likely
Best Worst Most Likely Best
0 40000 40000 40000 40000 40000 40000
1 6000 8000 10000 0 8000 16000
2 6000 8000 10000 0 8000 16000
3 6000 8000 10000 0 8000 16000
NPV
(INR Lakhs)
5636 20848 30060 (40000) 20848 81696](https://image.slidesharecdn.com/ilovepdfmerged-200220114434/75/project-management-pm-note-in-mg-university-S6-sem-26-2048.jpg)
![4 | P a g e M o d u l e III
S6 ME MBITS Project Management
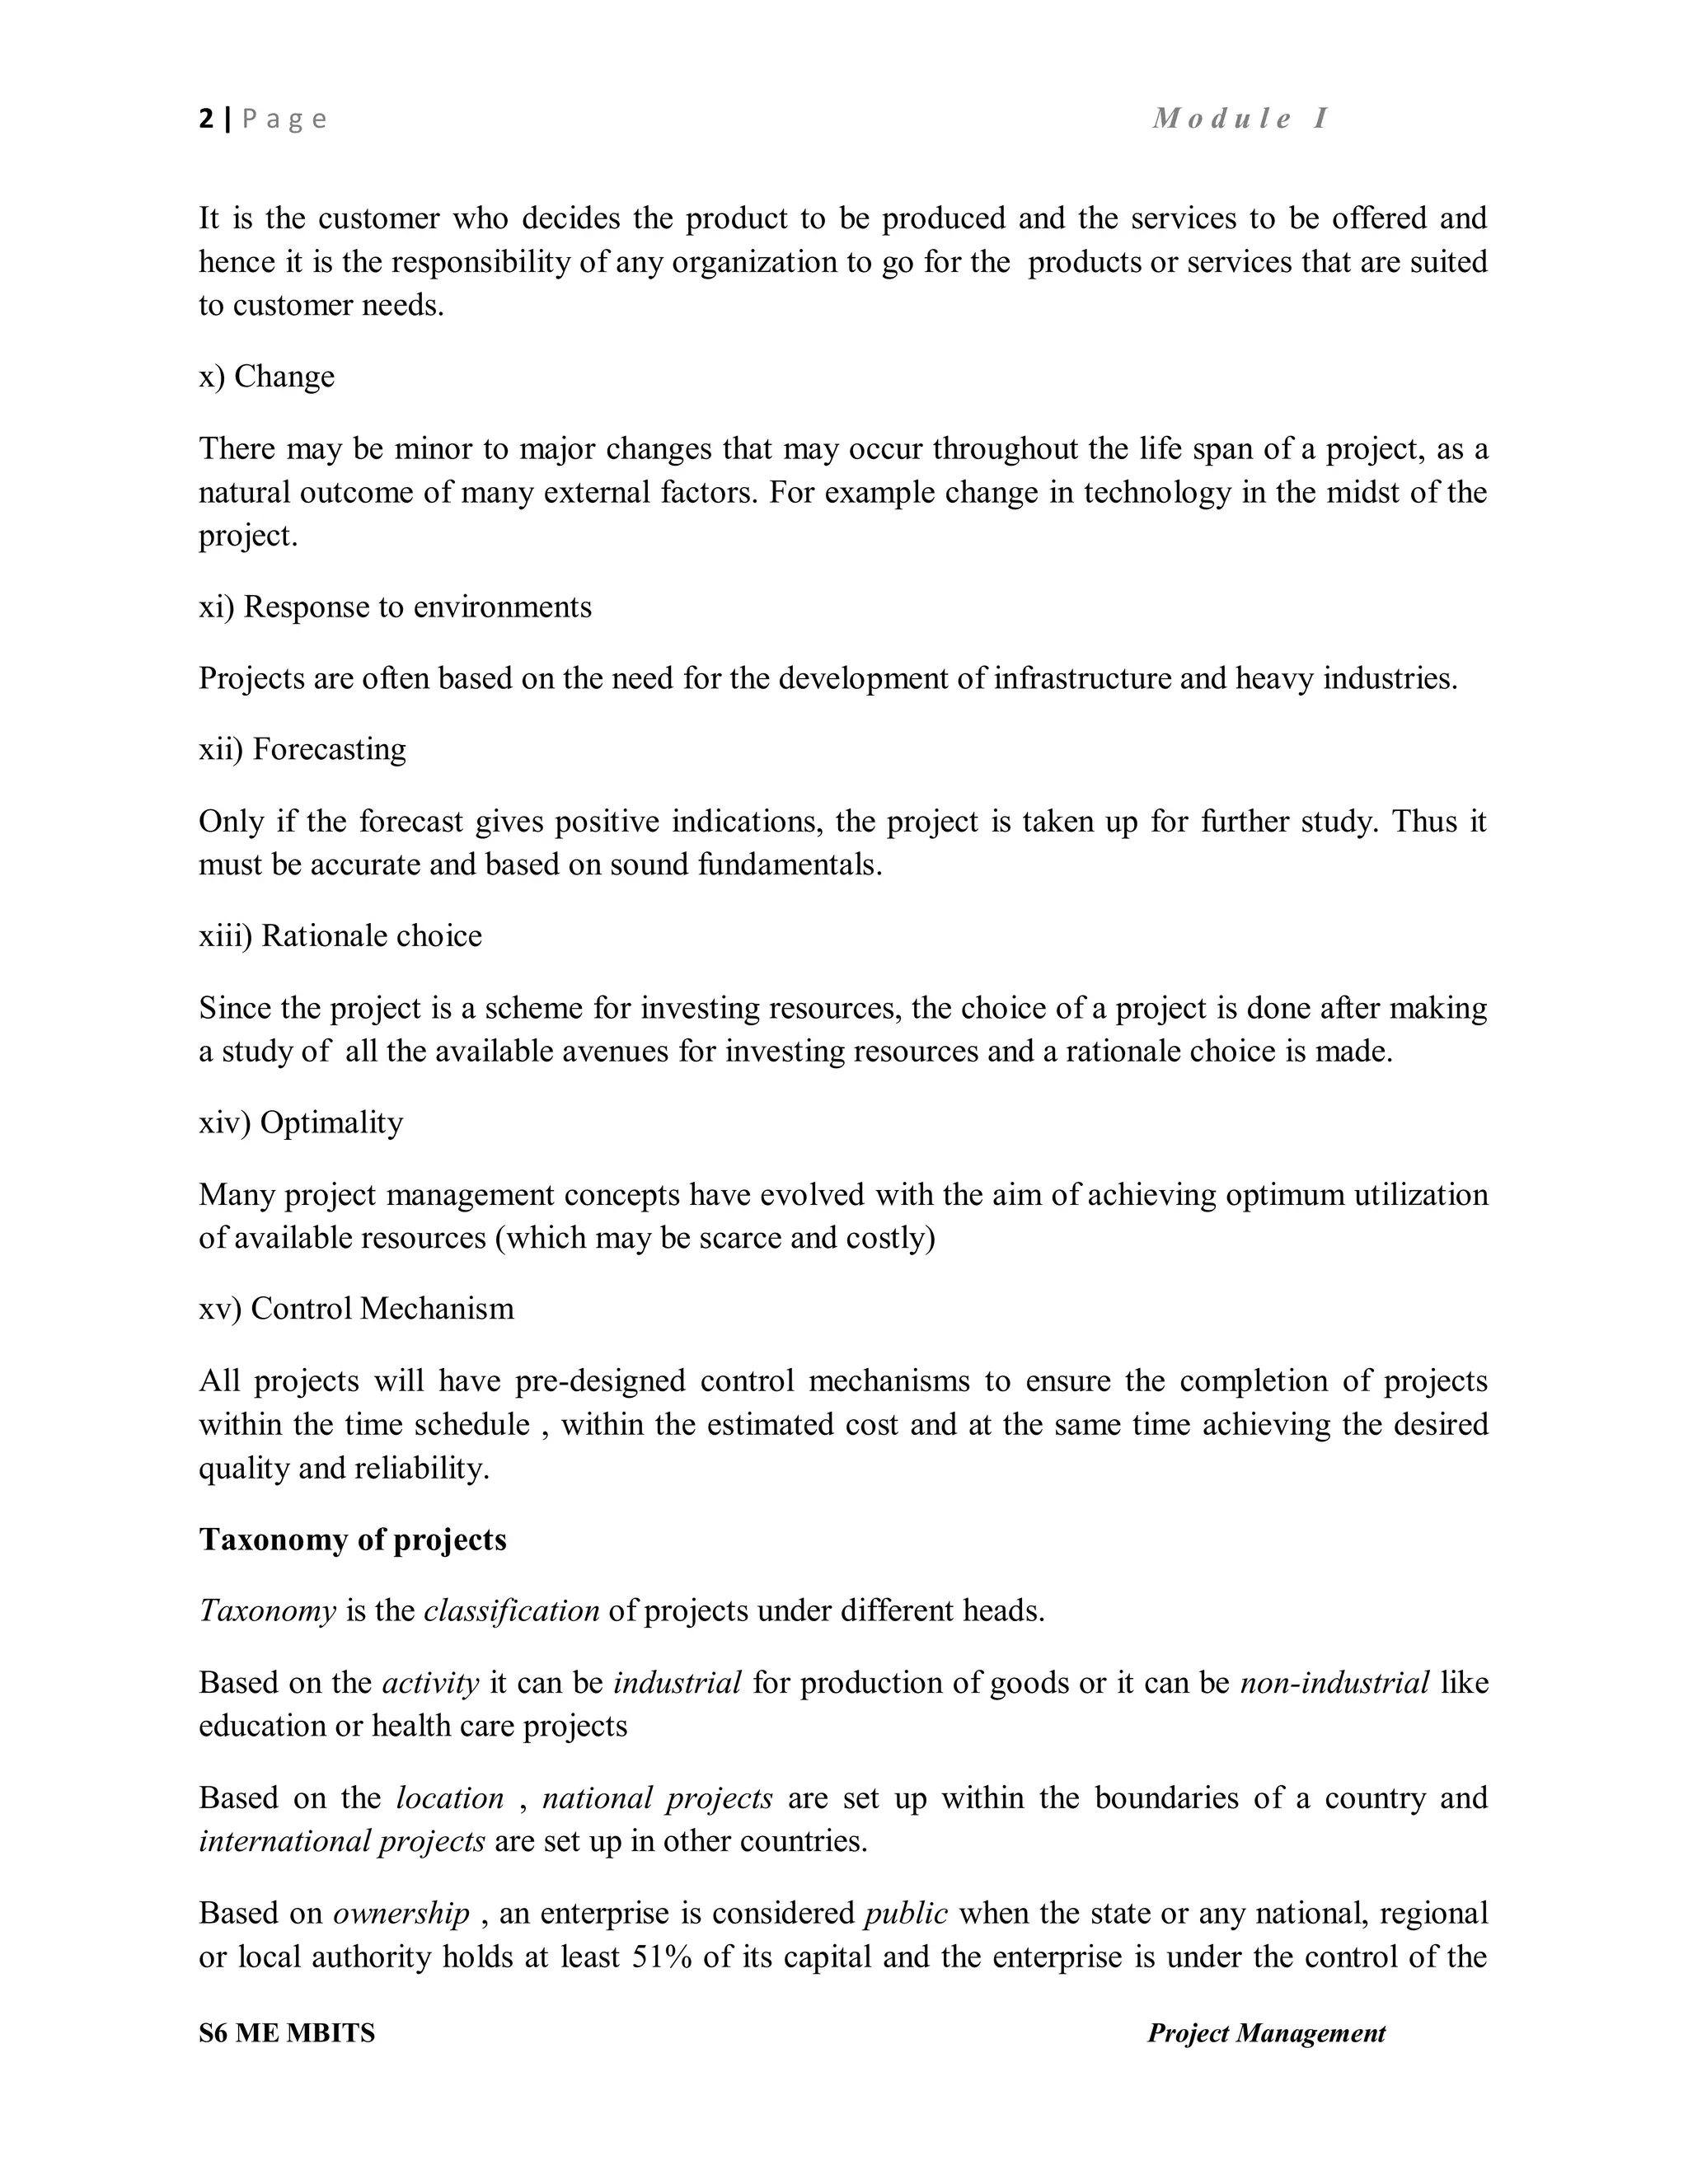
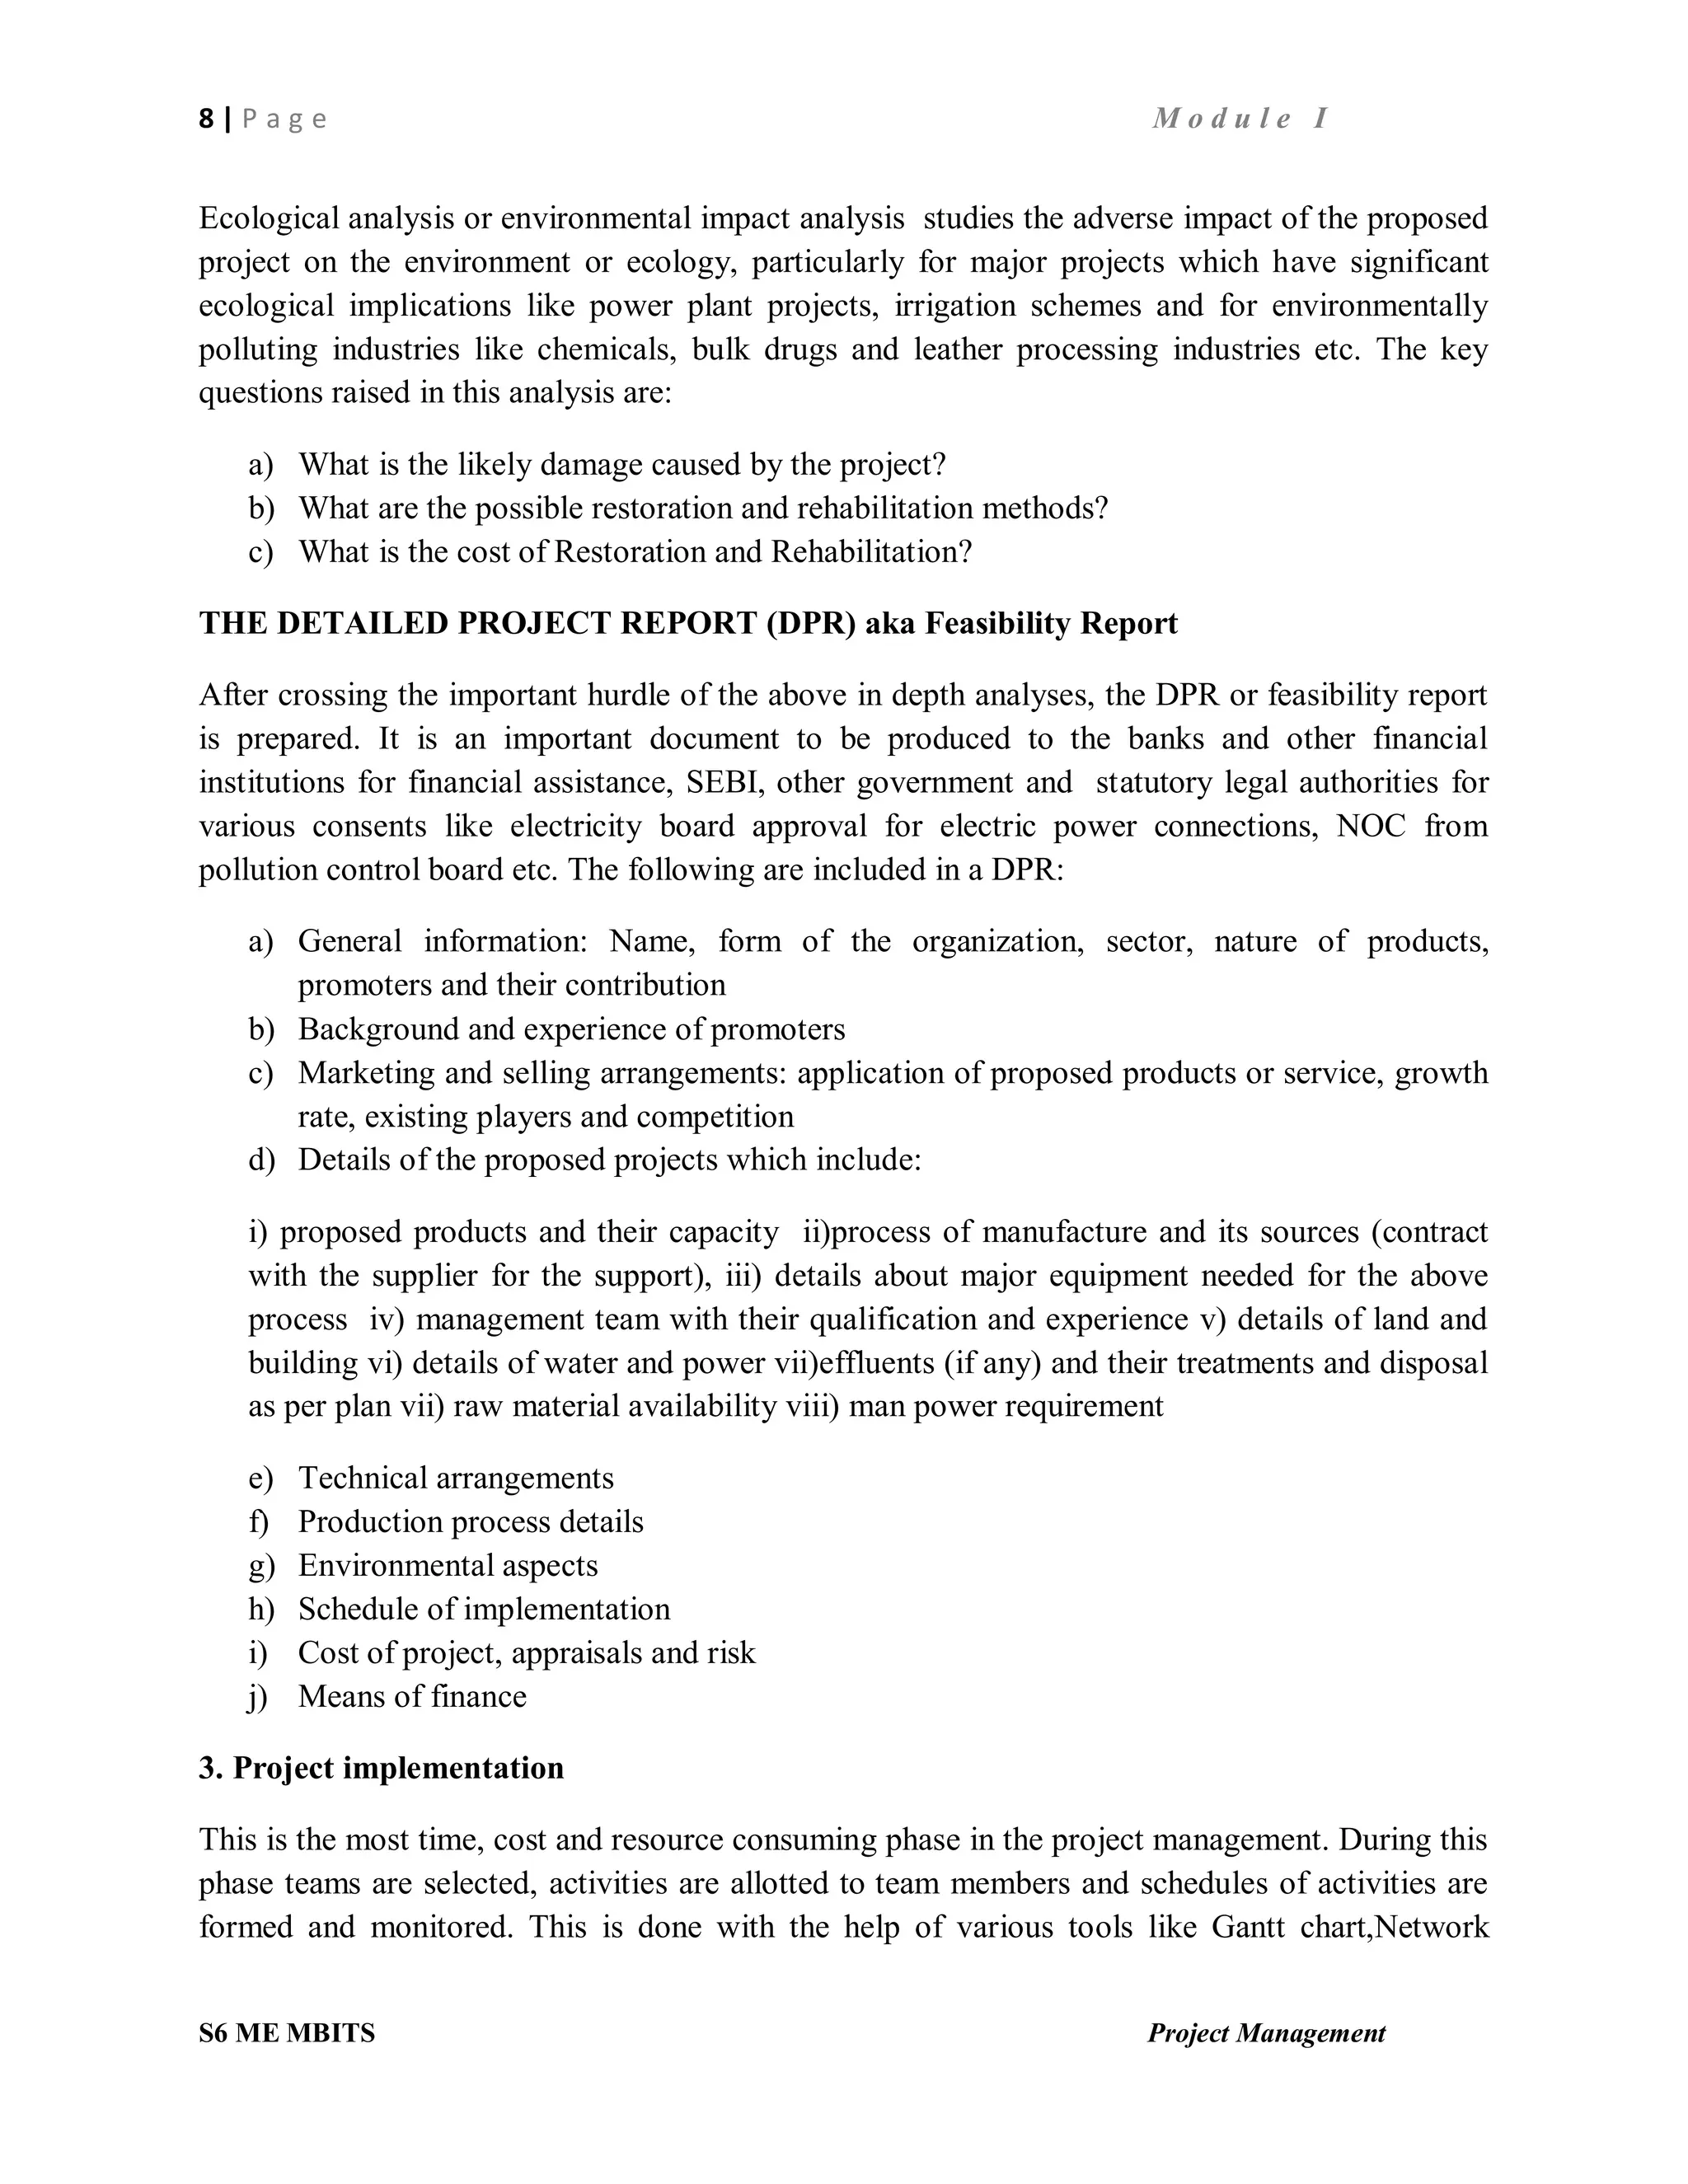
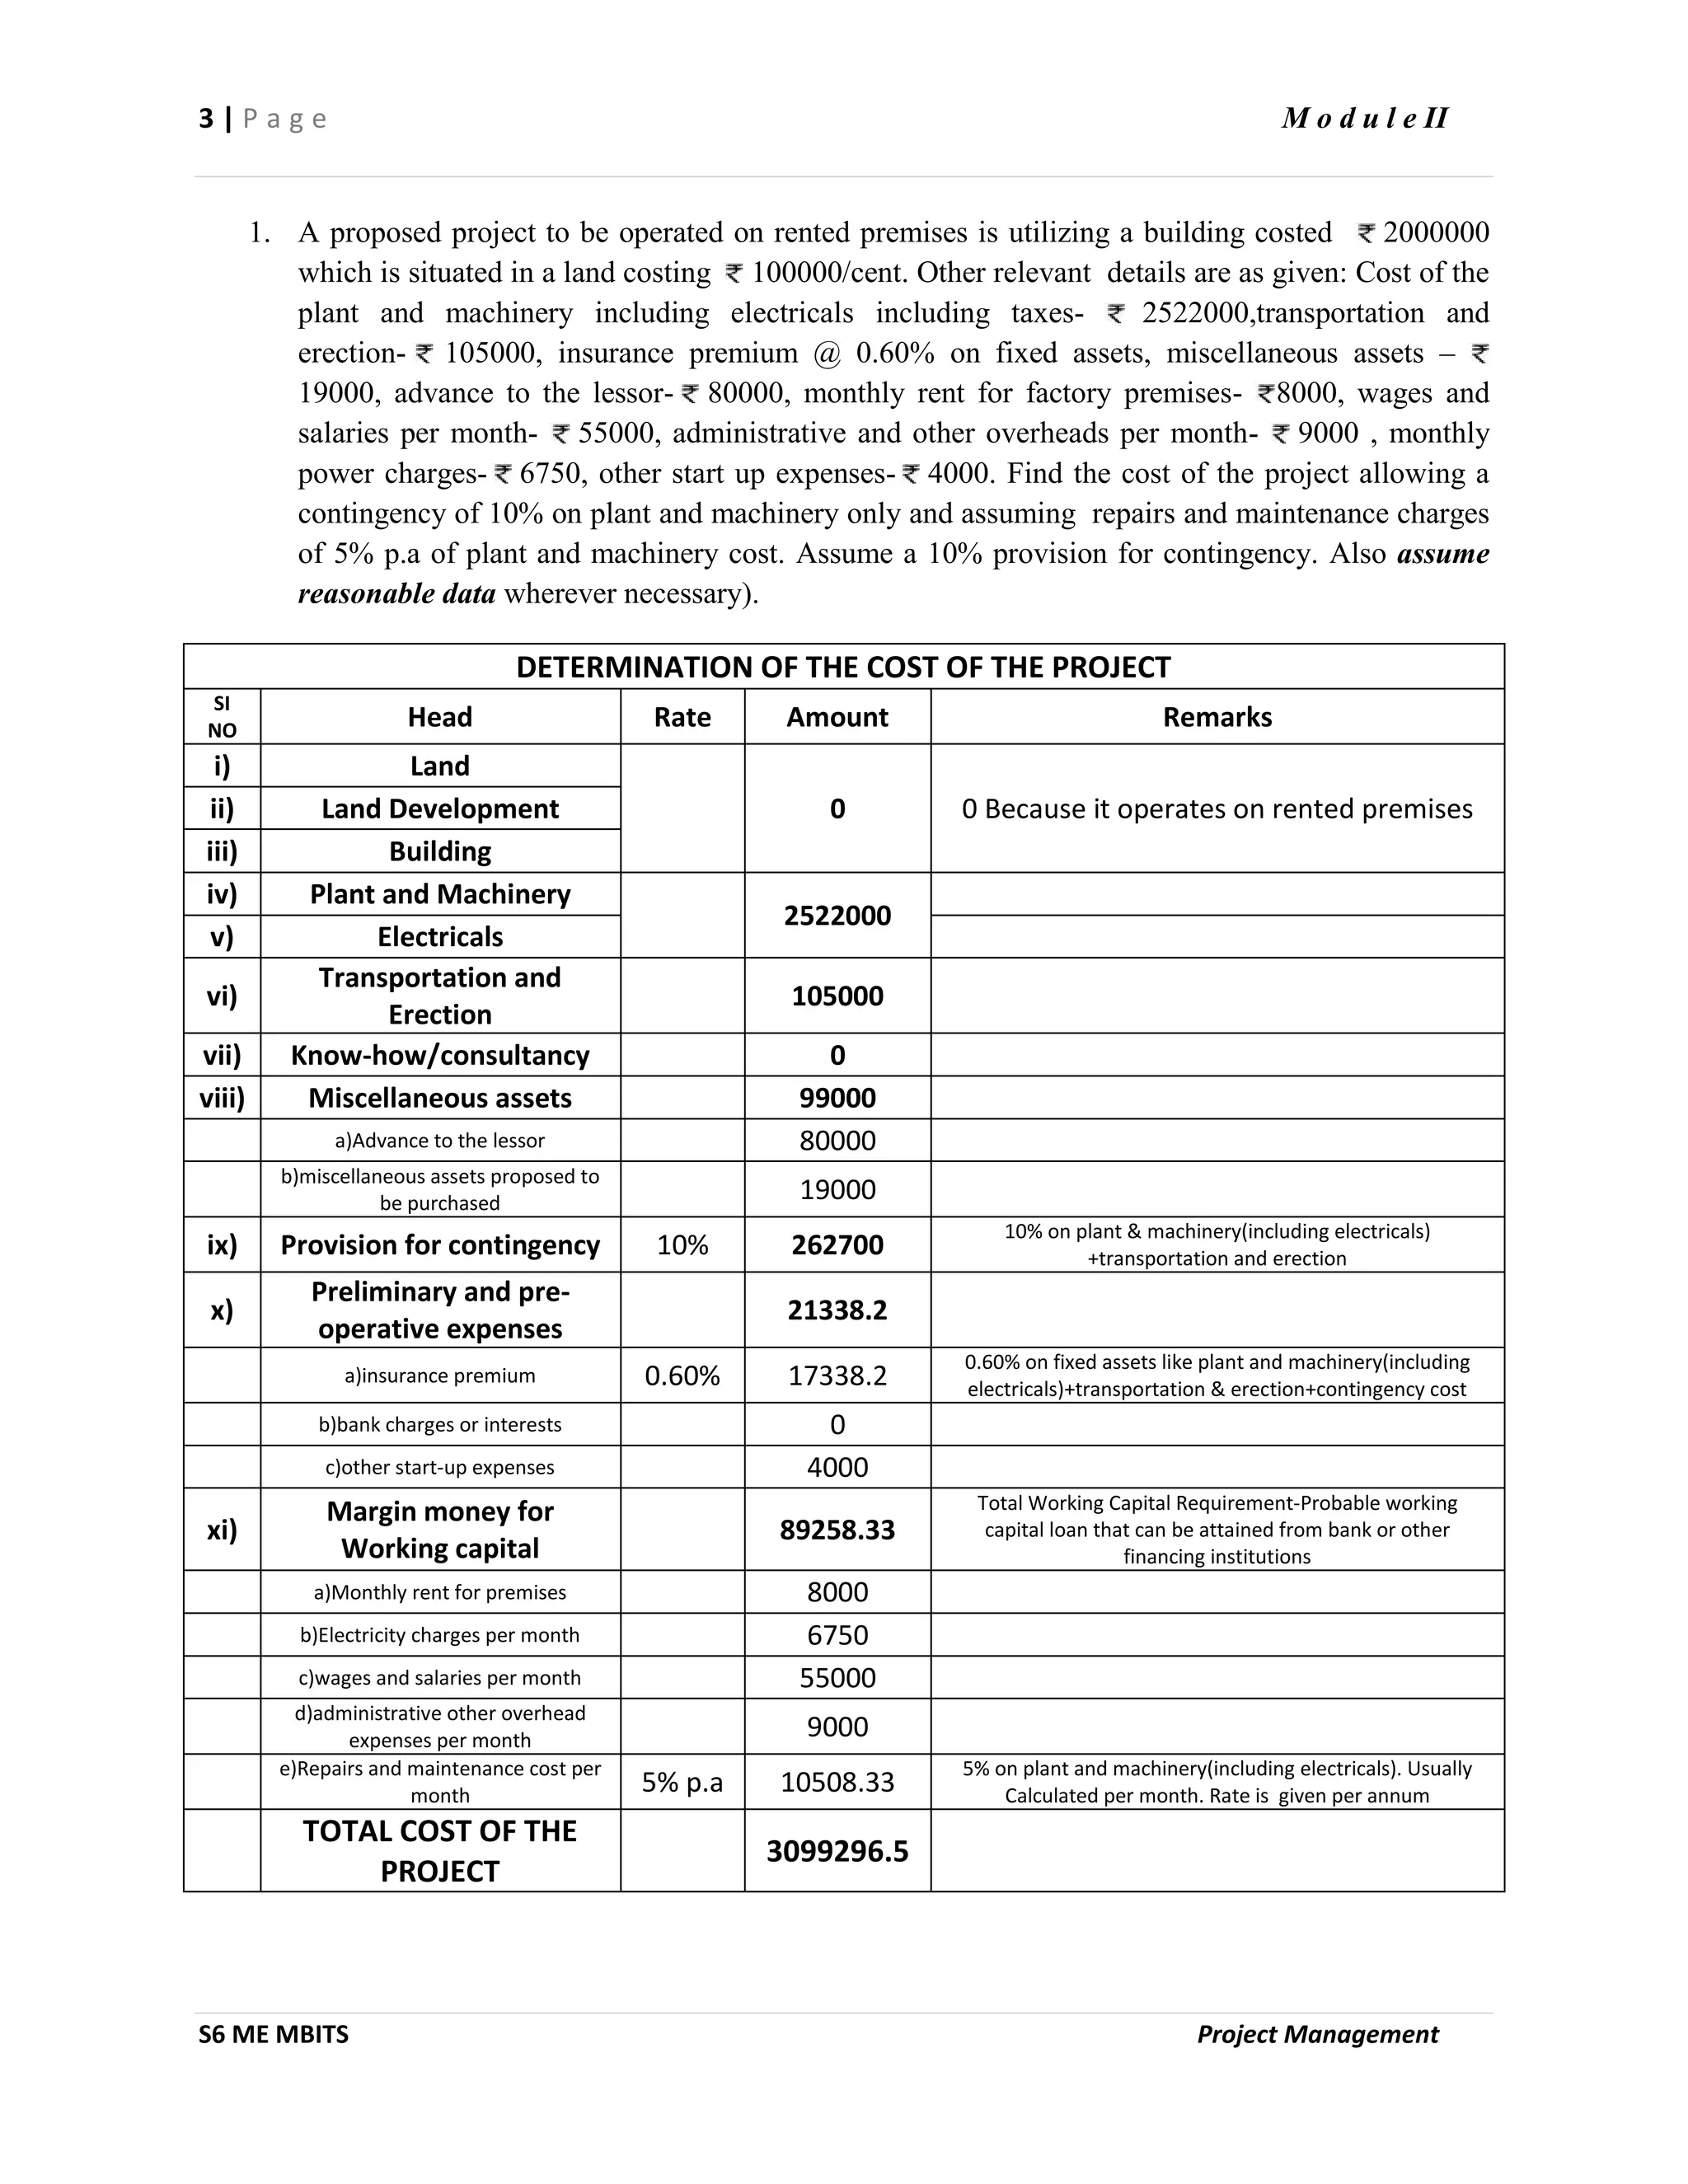
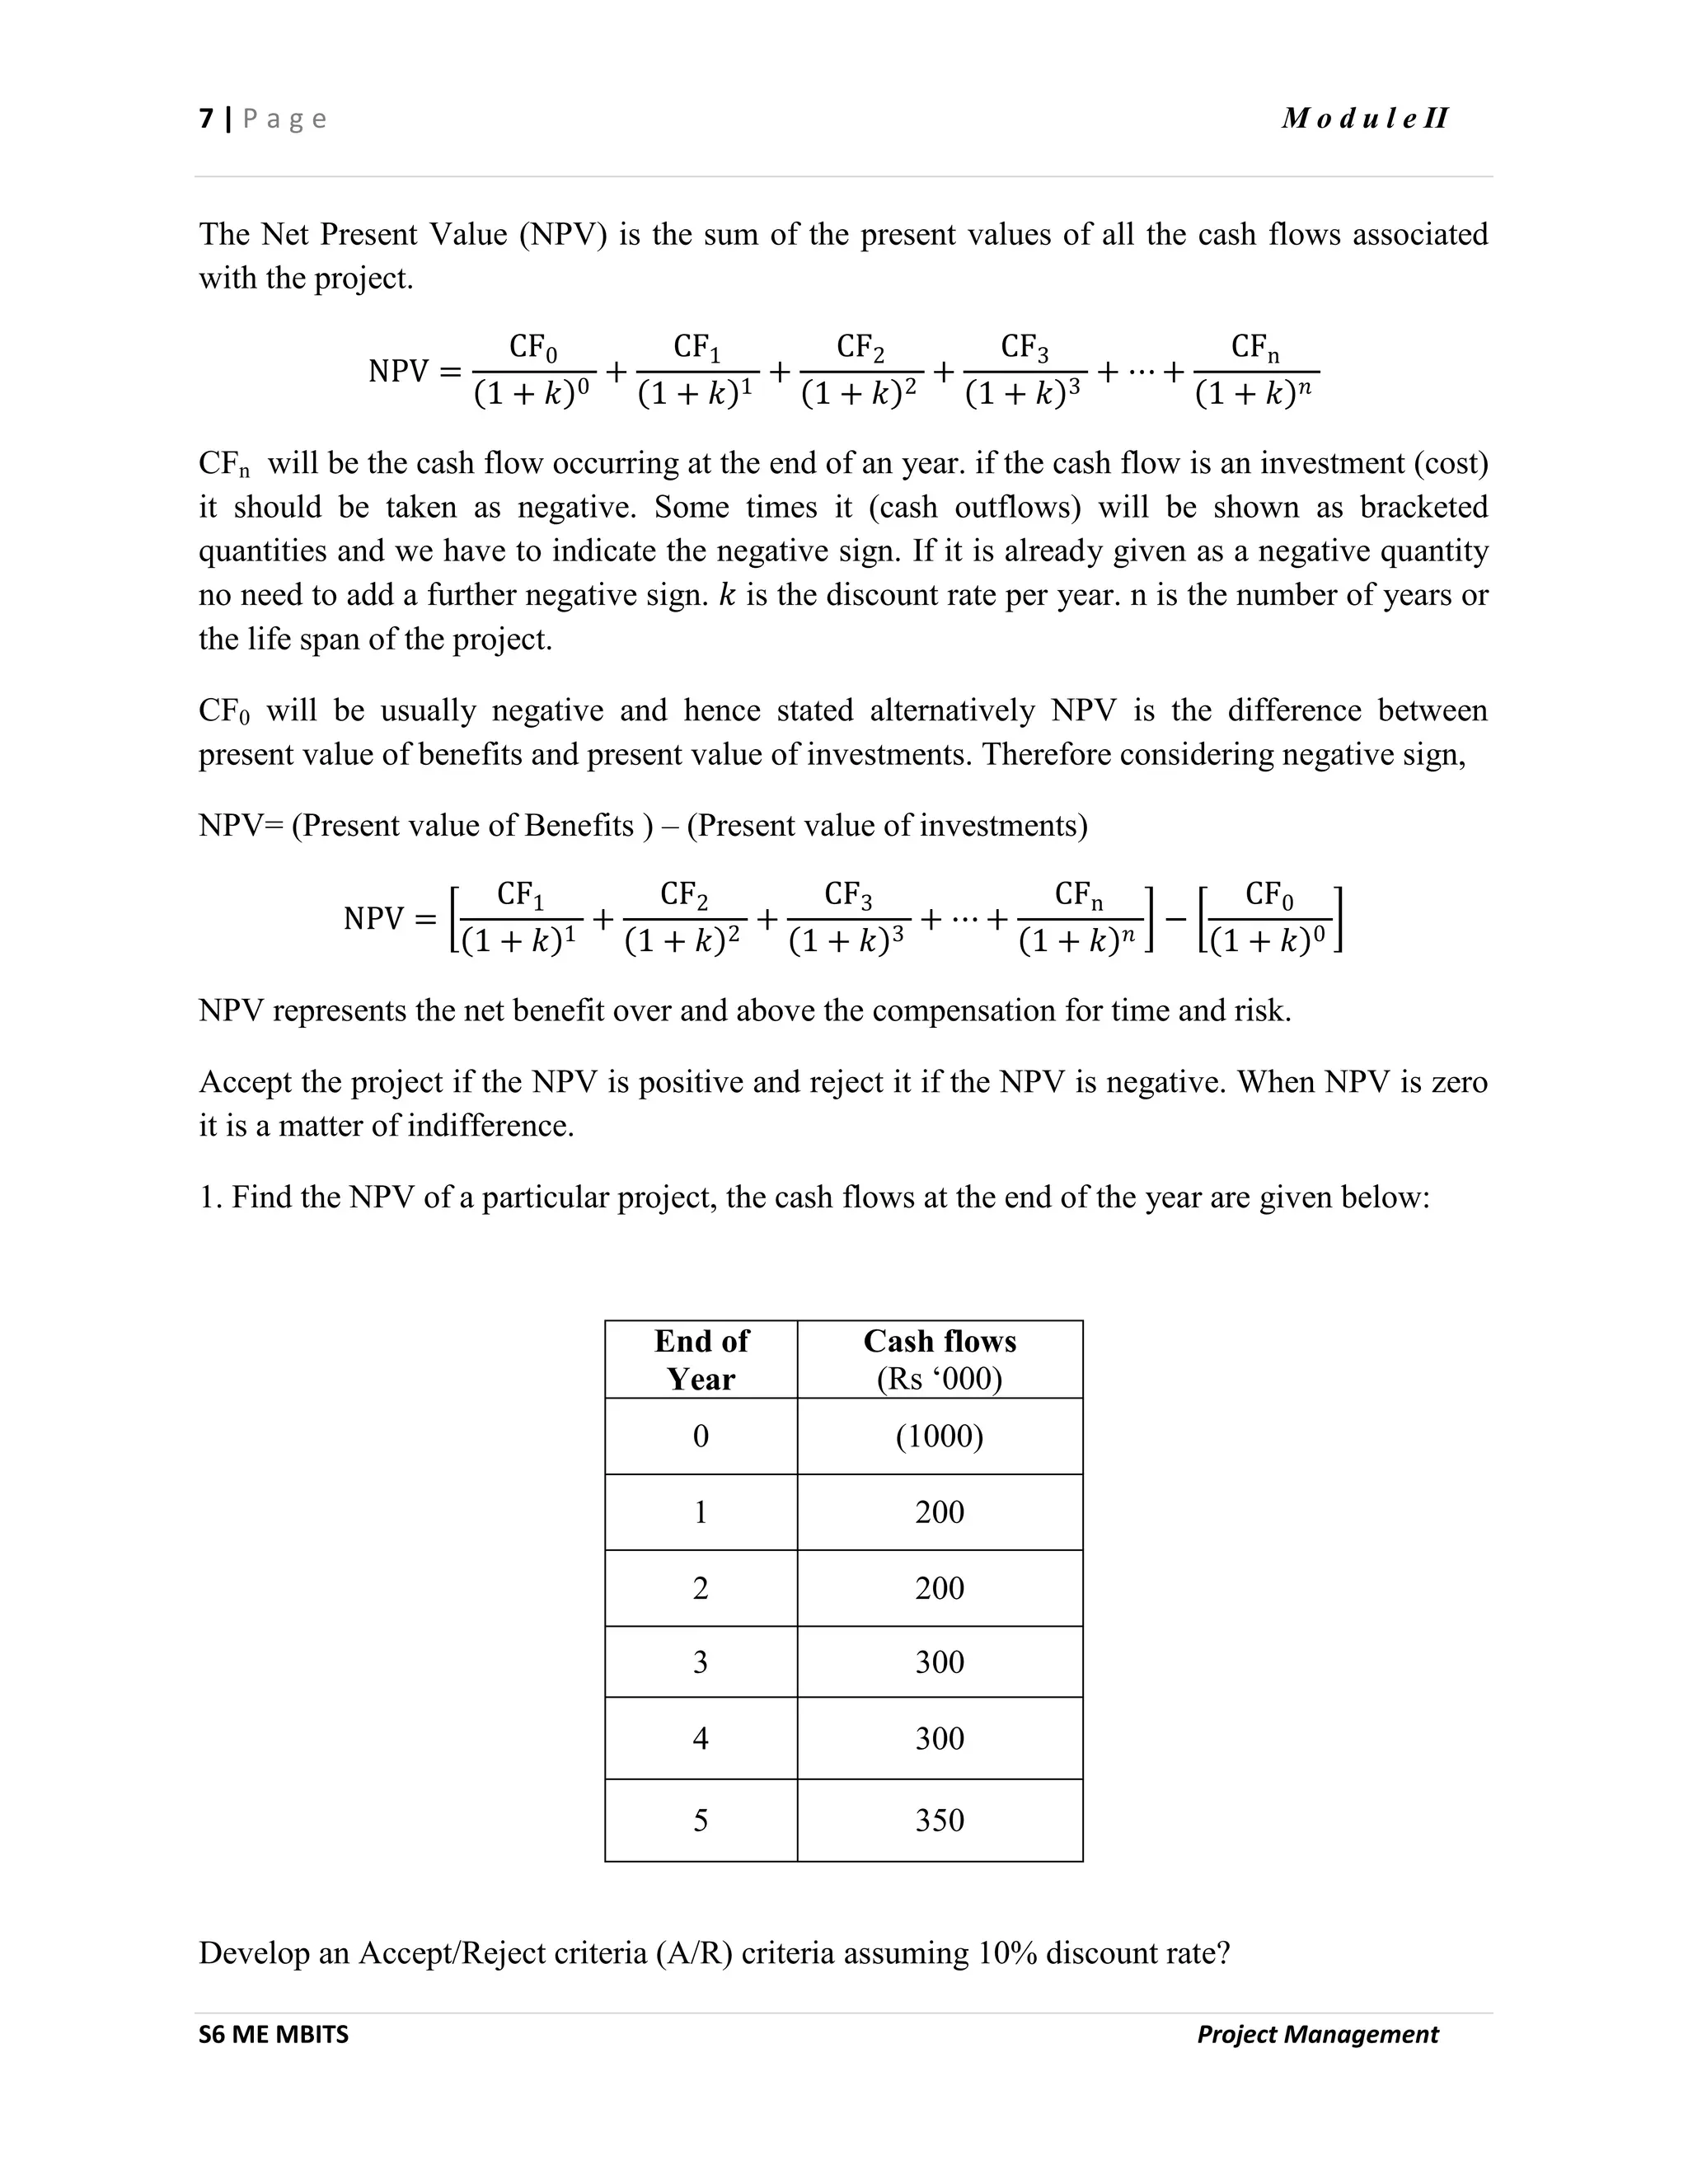
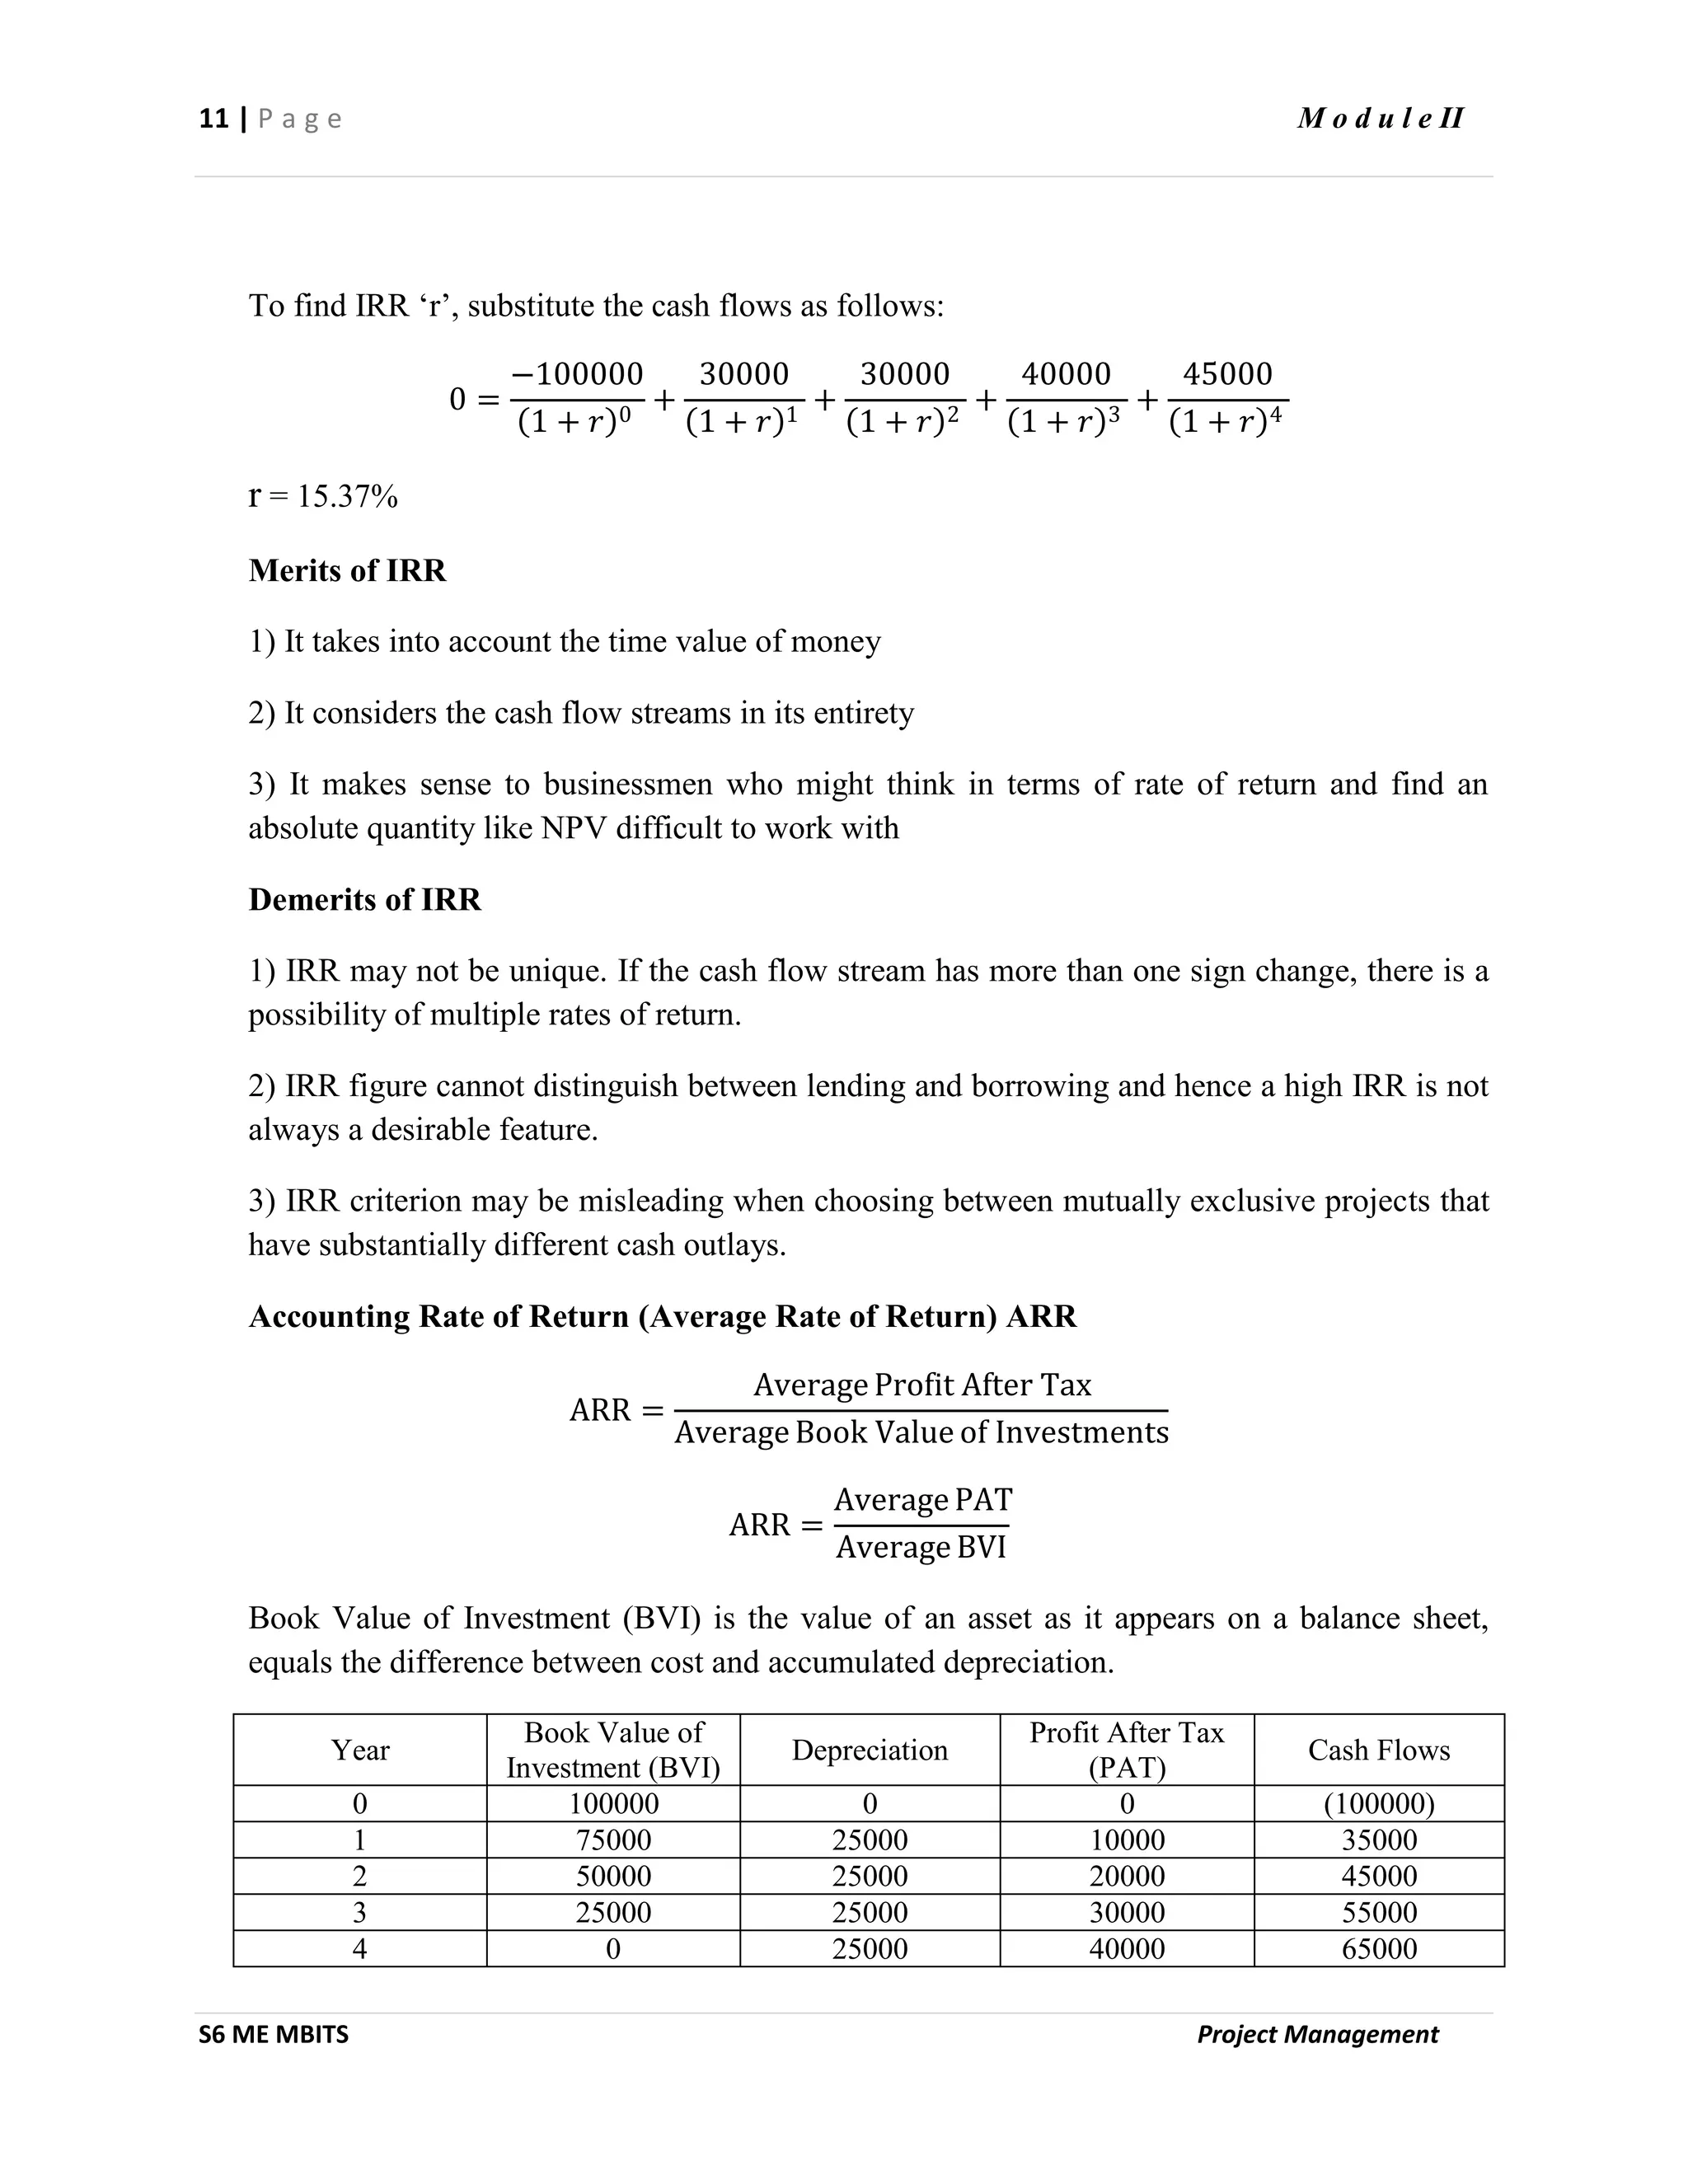
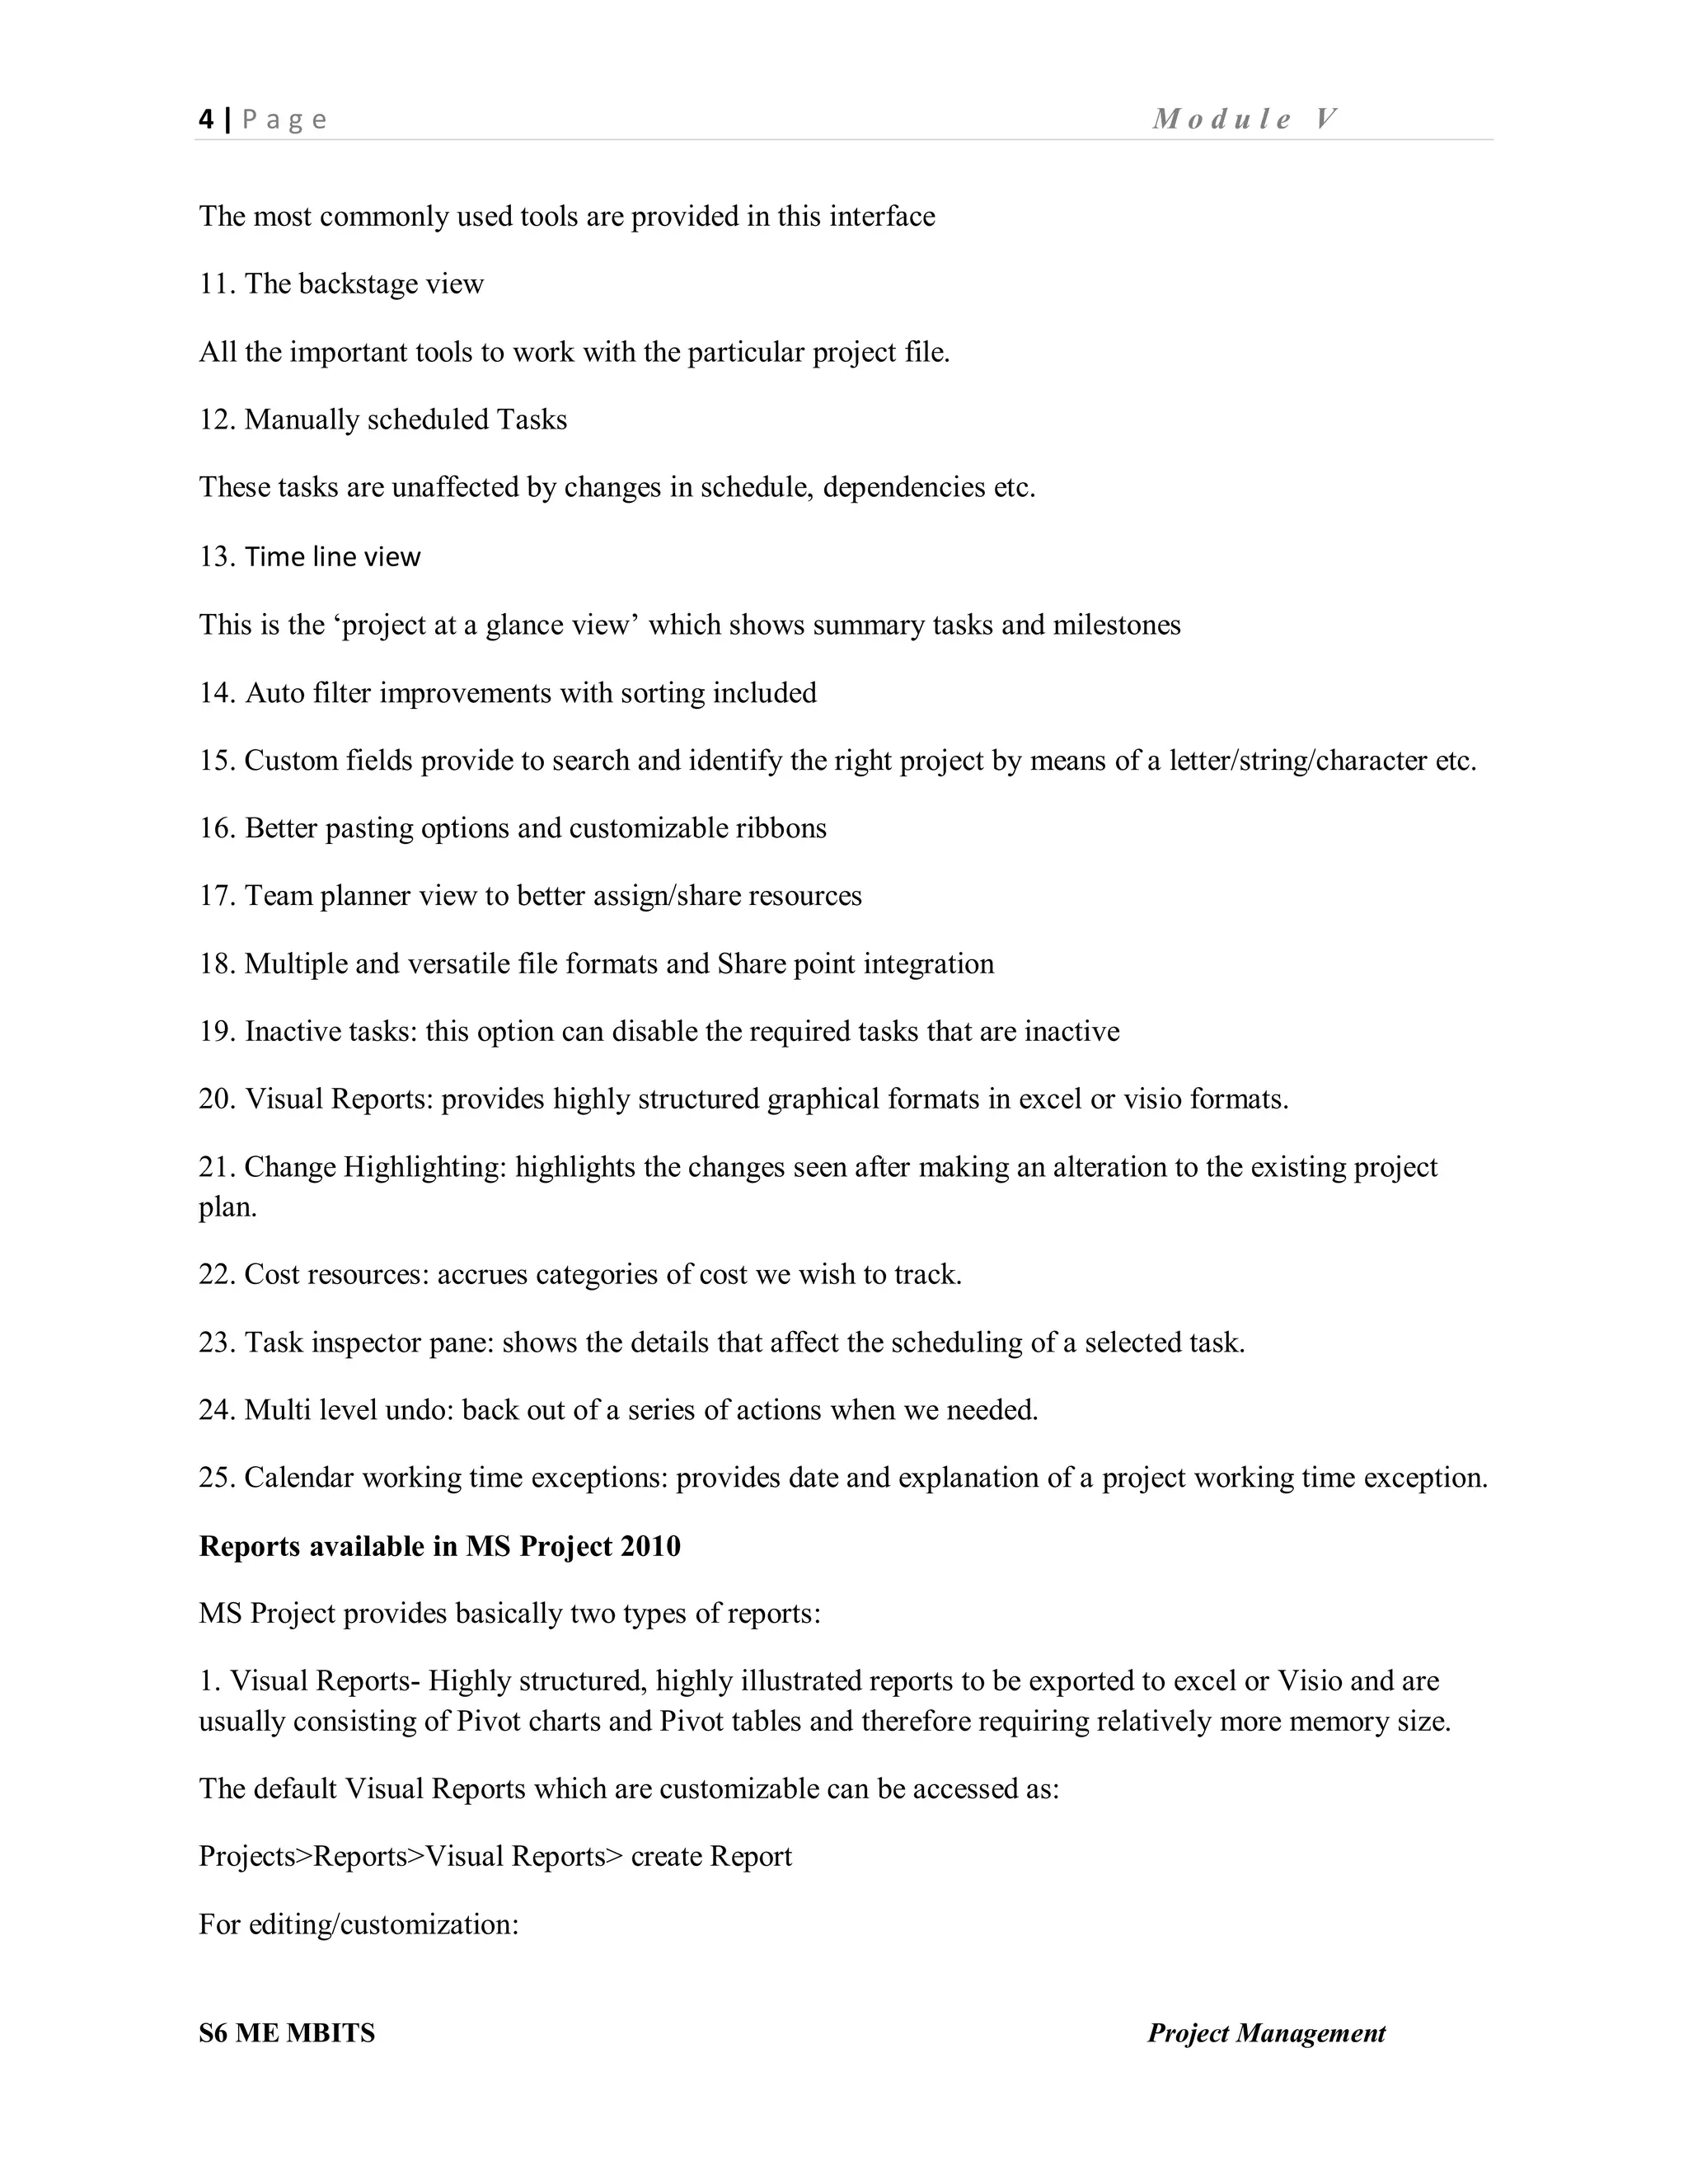
5. Simulate the experiment by means of Random Sampling
Example 1: A Retailer deals in perishable items, the daily demand and supply of which are random
numbers, the past 500 days data shows the following:
Supply Demand
Available(kg) Number of days Available(kg) Number of days
10 40 10 50
20 50 20 110
30 190 30 200
40 150 40 100
50 70 50 40
The retailer buys the item at Rs. 20 per kg and sells the item at Rs. 30 per kg. If any of the commodity
remains at the end of the day, it has no sell value and is a dead loss. More over the loss on any unsatisfied
item is Rs. 8 per kg. Given the following random numbers: 31, 18, 63, 84, 15, 79, 07, 32, 43, 75, 81 and
27. Use the random numbers alternately to simulate supply and demand for six days sales.
Answer: Create RNI and Probability Distribution
Supply side Demand side
Supply
(kg)
Probability
Random
Number
Interval
(RNI)
Demand
(kg)
Probability
Random Number
Interval
(RNI)
10 0.08 00-07 10 0.10 00-09
20 0.10 08-17 20 0.22 10-31
30 0.38 18-55 30 0.40 32-71
40 0.30 56-85 40 0.20 72-91
50 0.14 86-99 50 0.08 92-99
Using Random numbers , simulate for six days: The Net profit is found to be +400 (see the table)
Day RN
Supply
(kg)
RN
Demand
(kg)
Cost
(Rs.)
Revenue
(Rs.)
Loss of
Unmet
Demand
(Rs.)
Profit
(Rs.)
1 31 30 18 20 600 600 - -
2 63 40 84 40 800 1200 - 400
3 15 20 79 40 400 600 160 40
4 07 10 32 30 200 300 160 -60
5 43 30 75 40 600 900 80 220
6 81 40 27 20 800 600 - -200
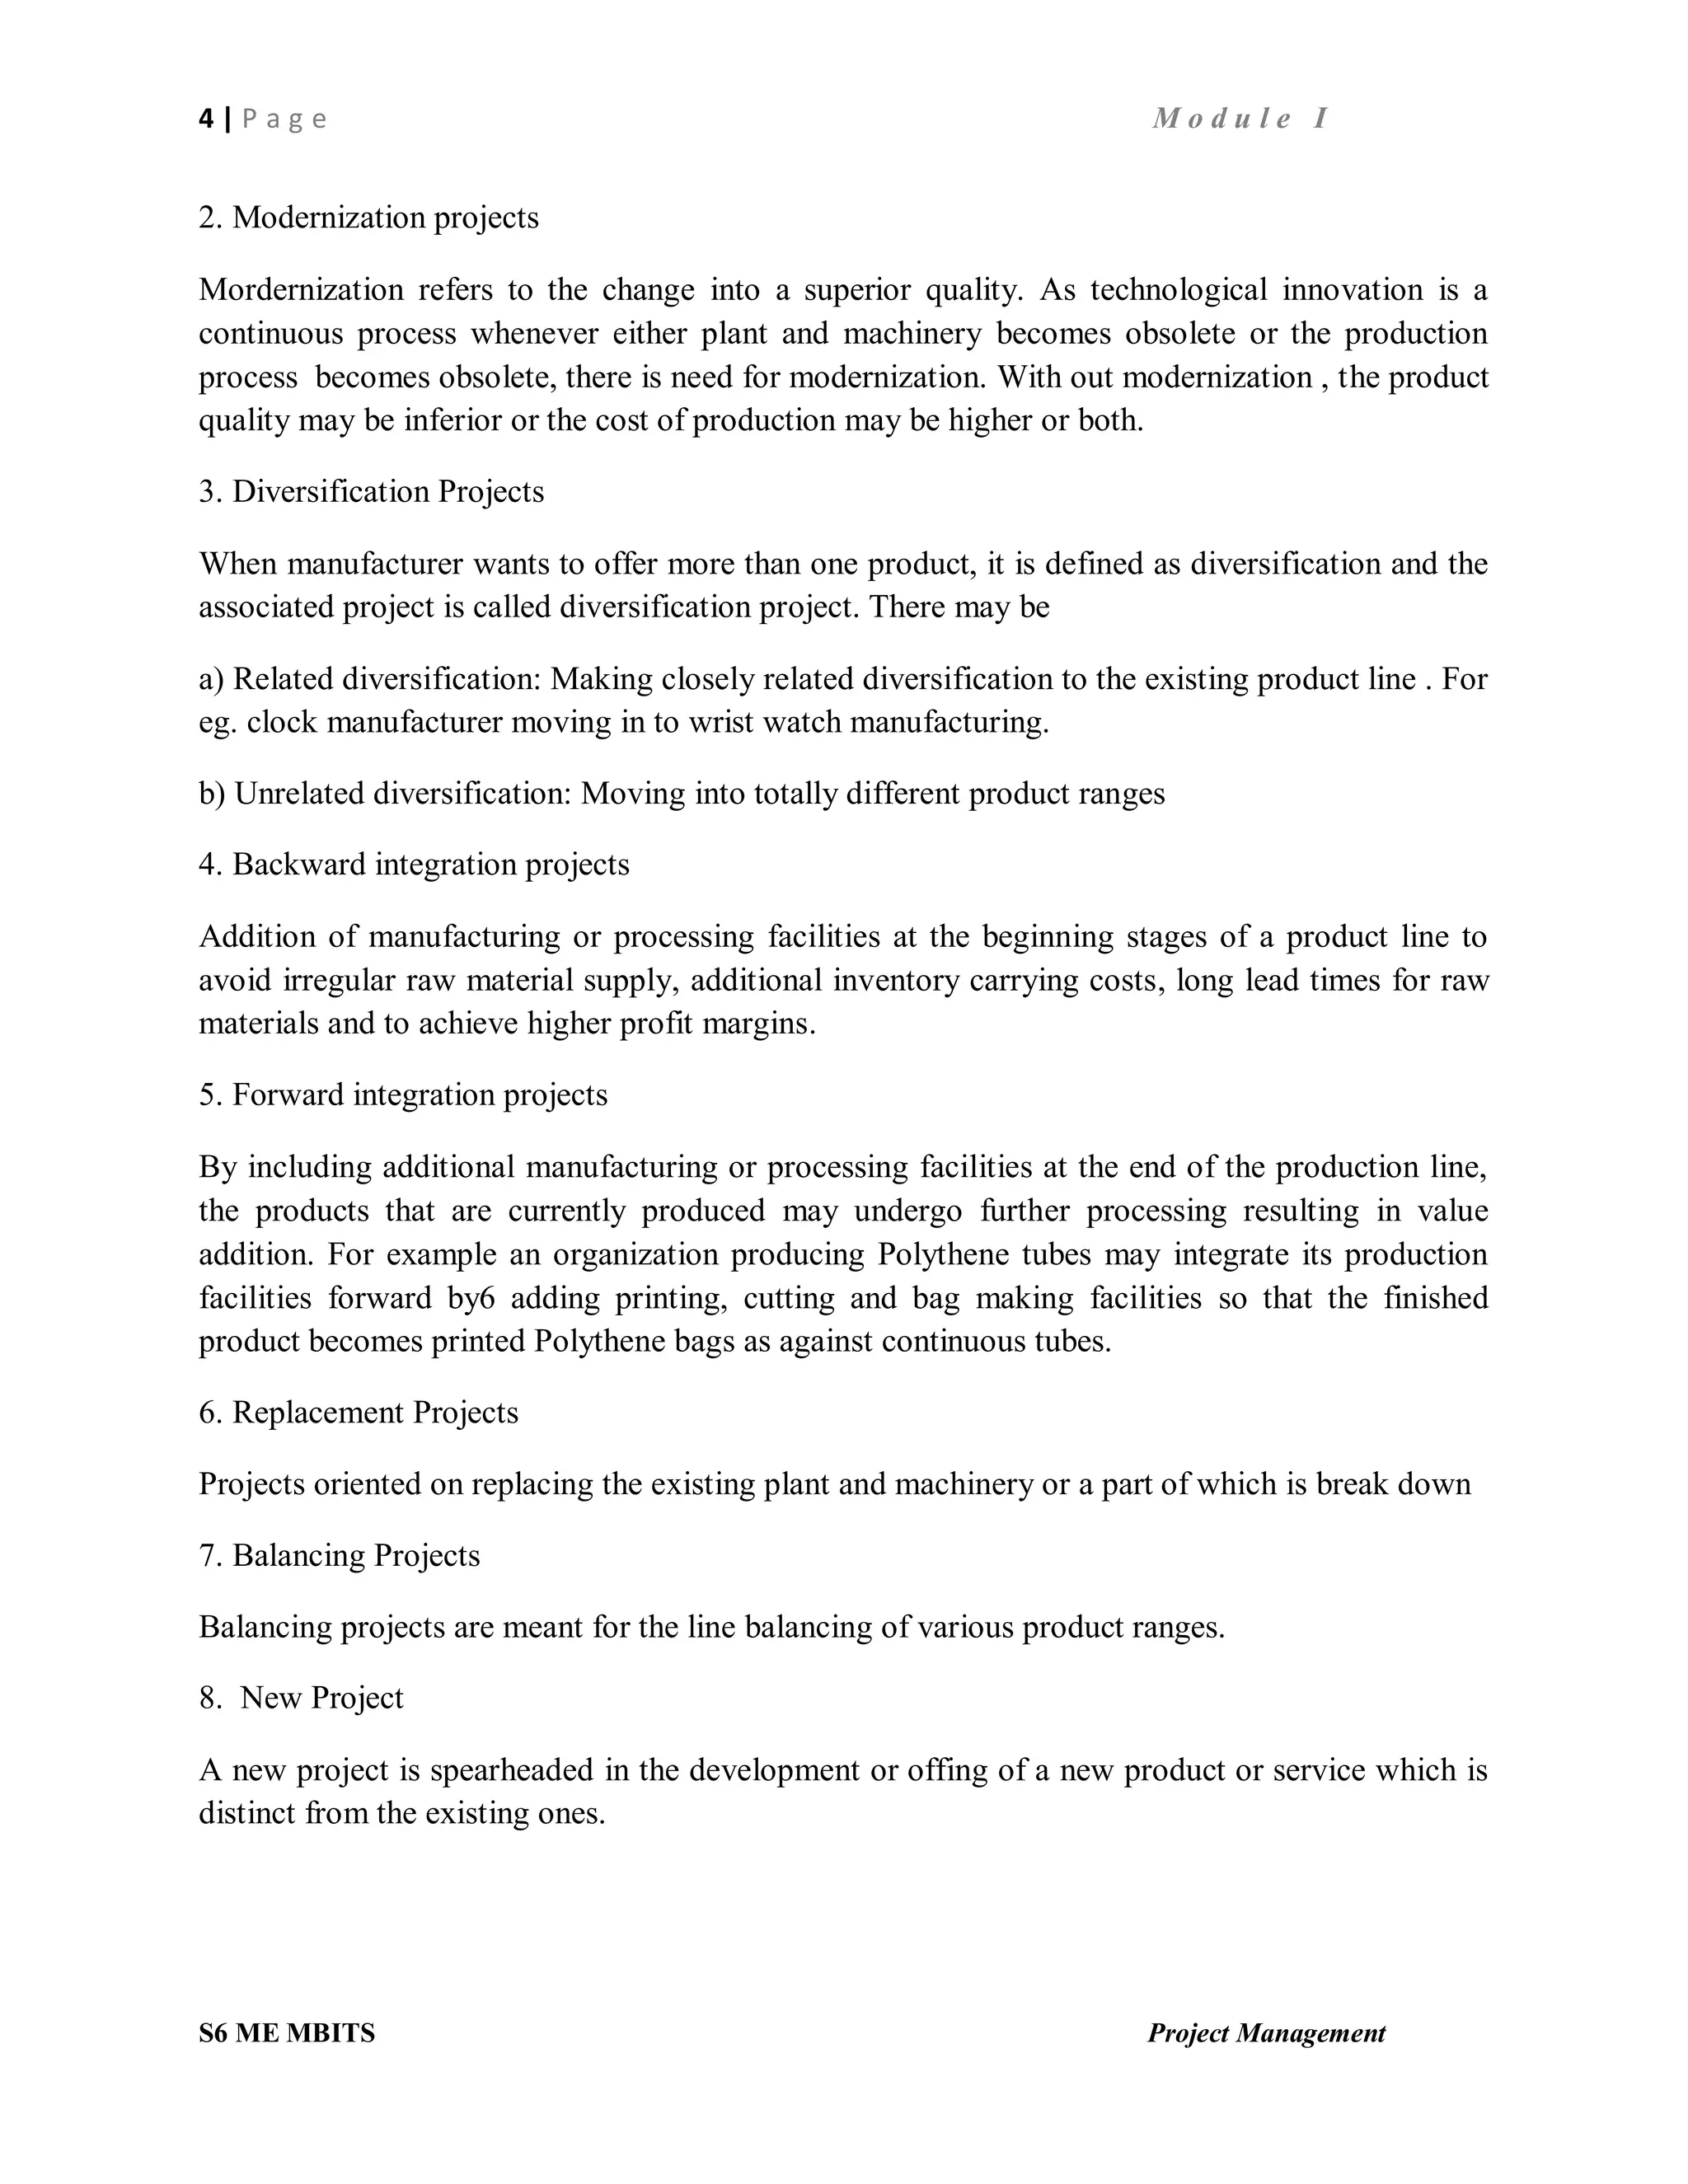
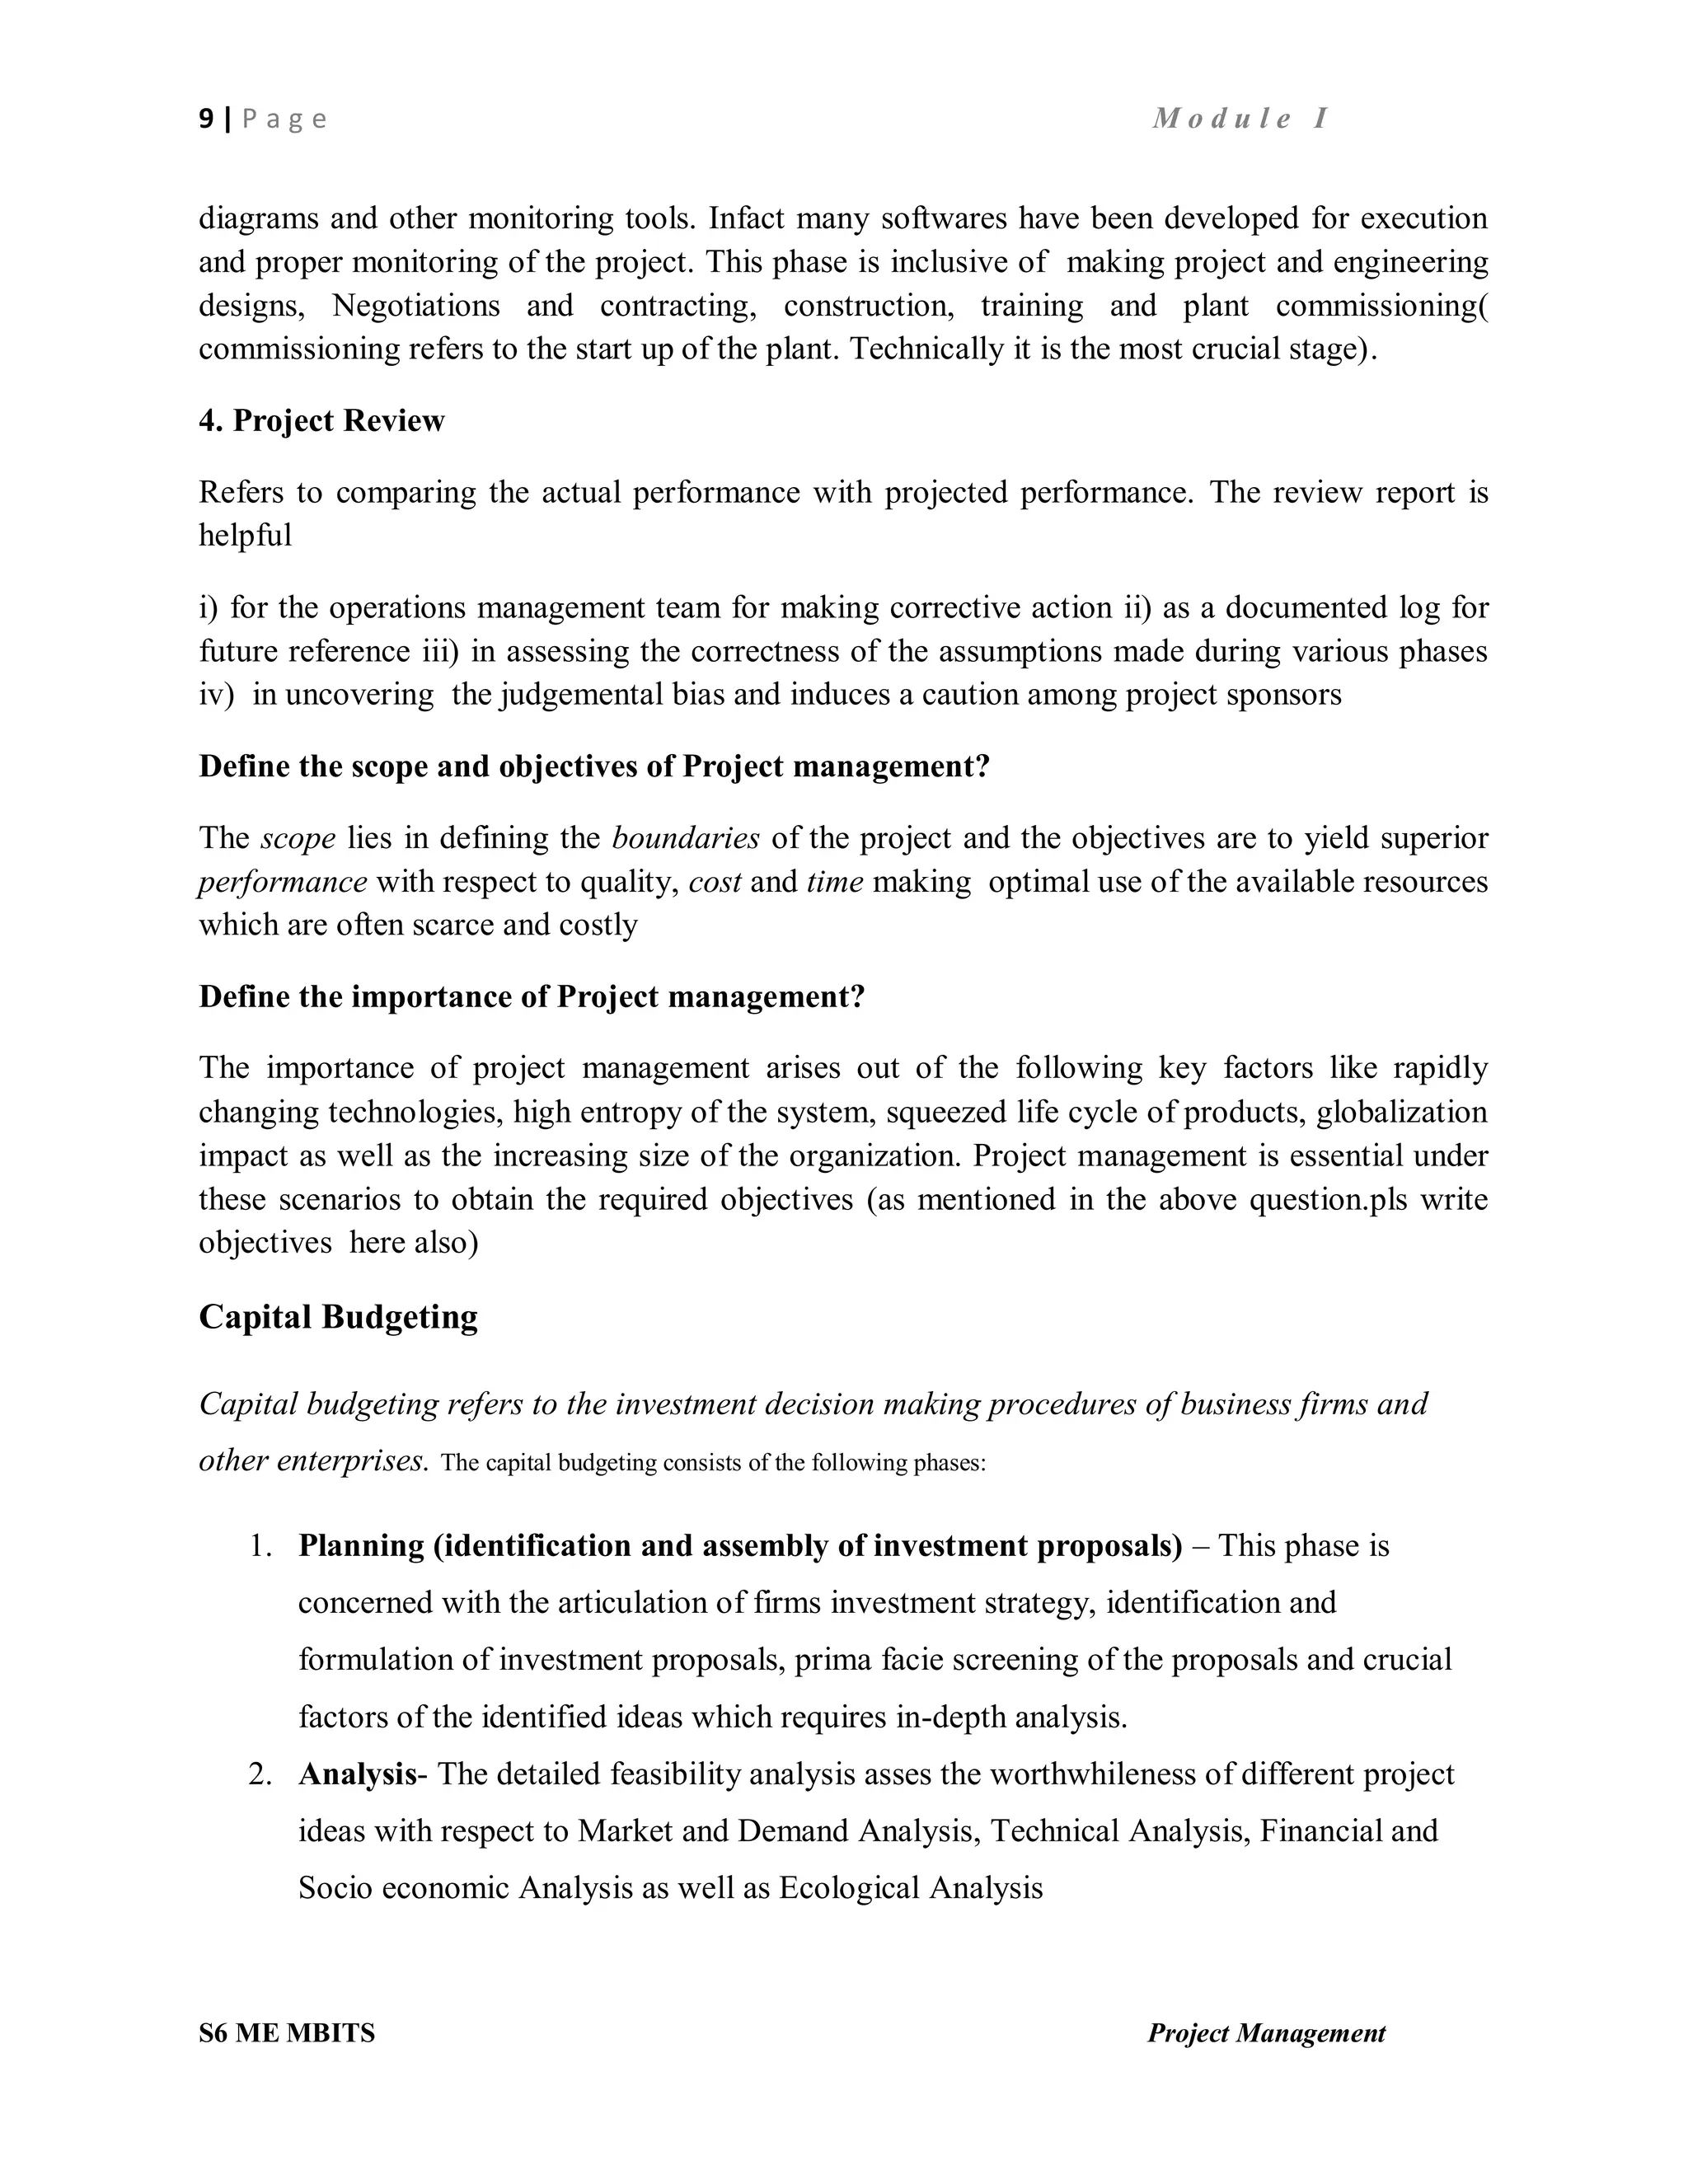
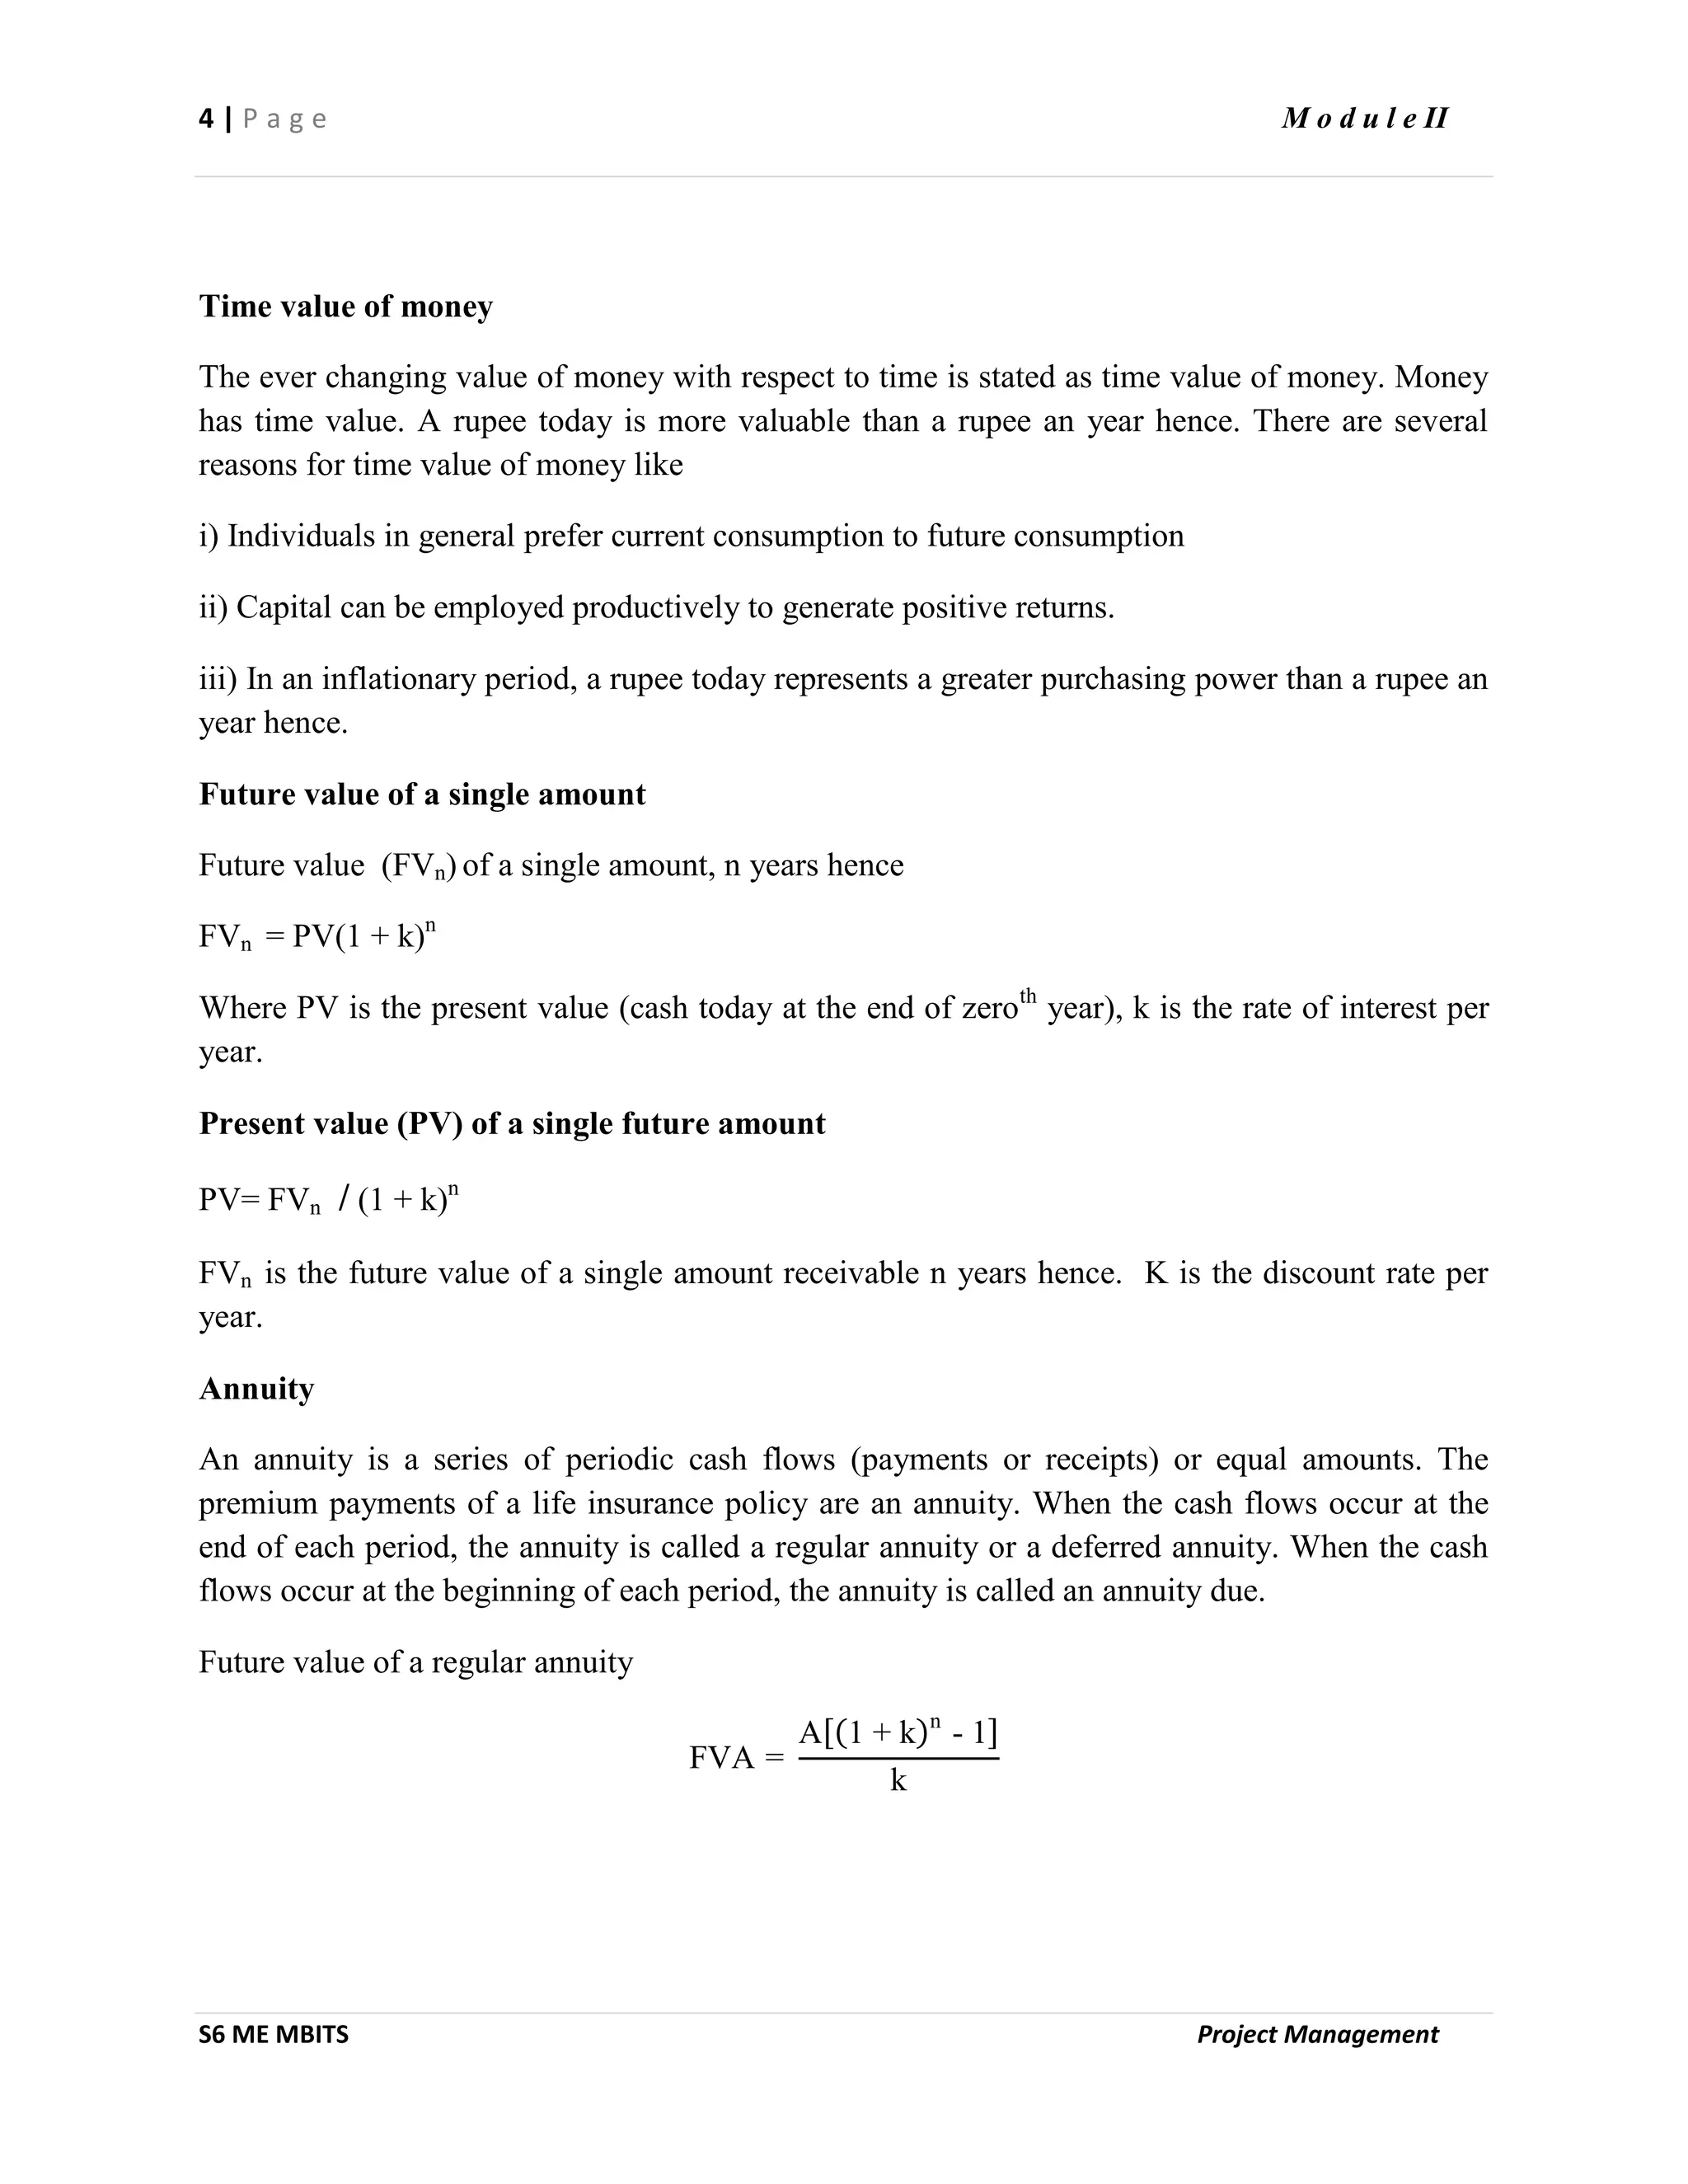
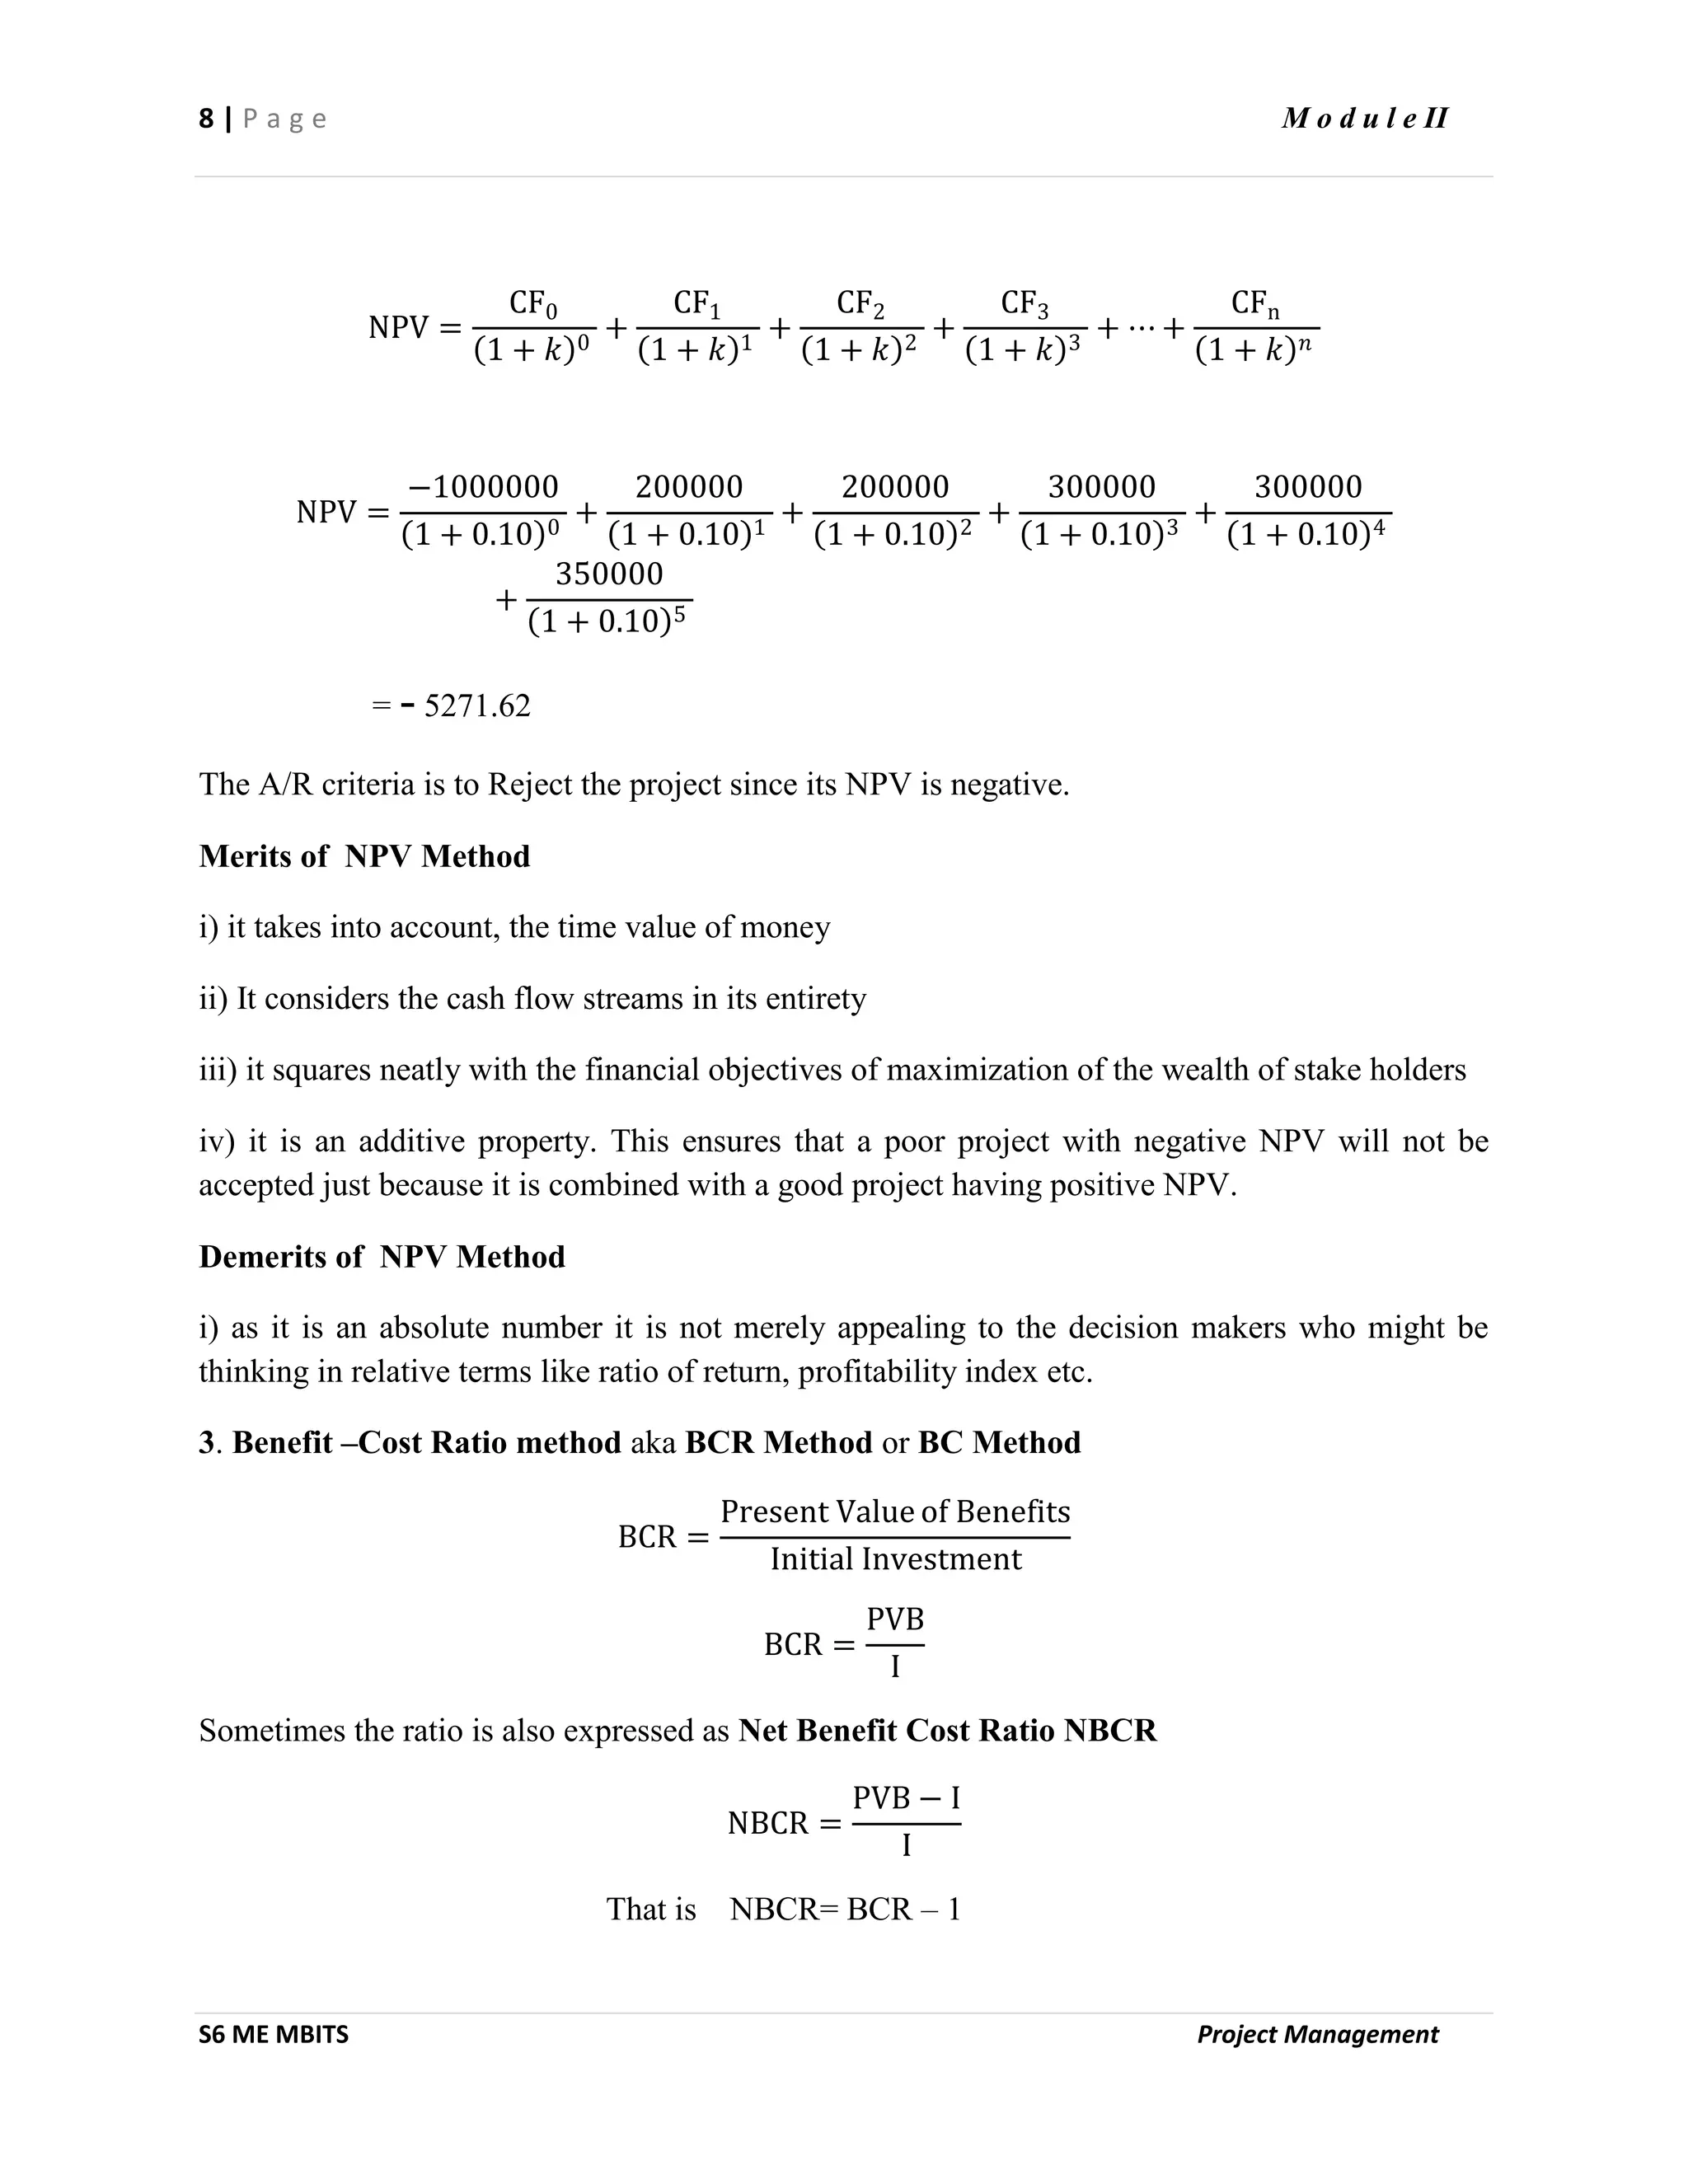
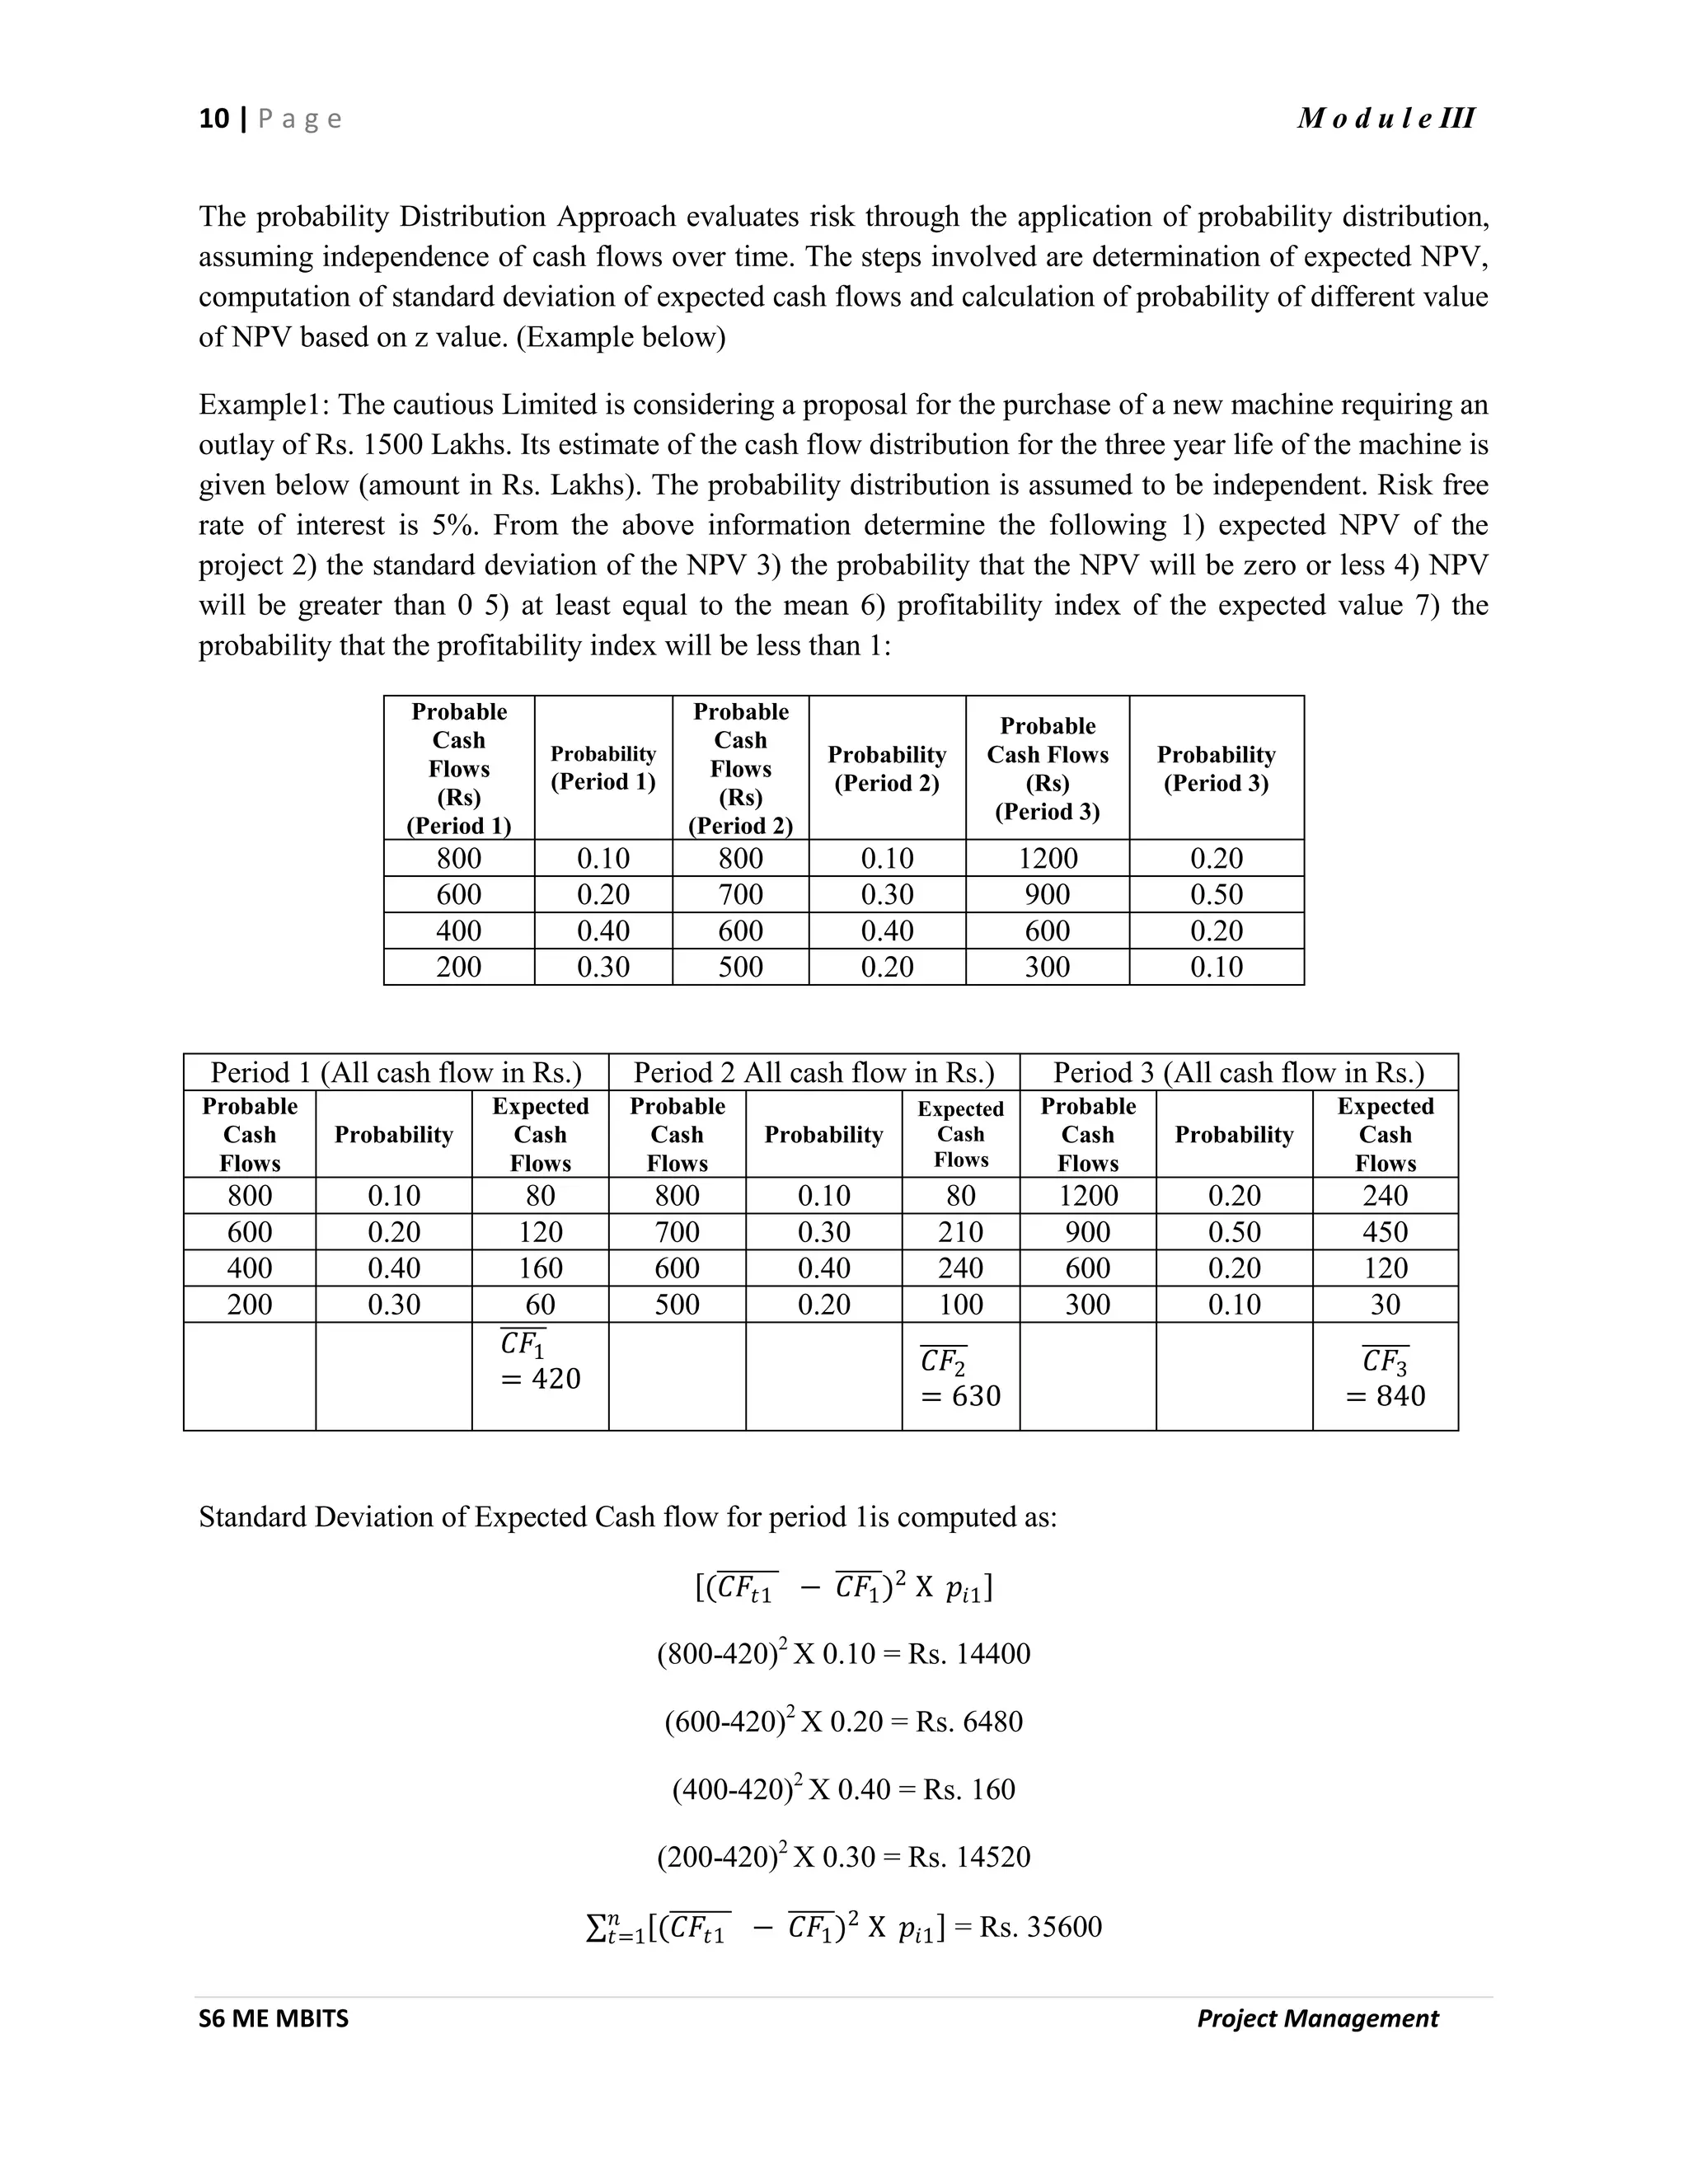
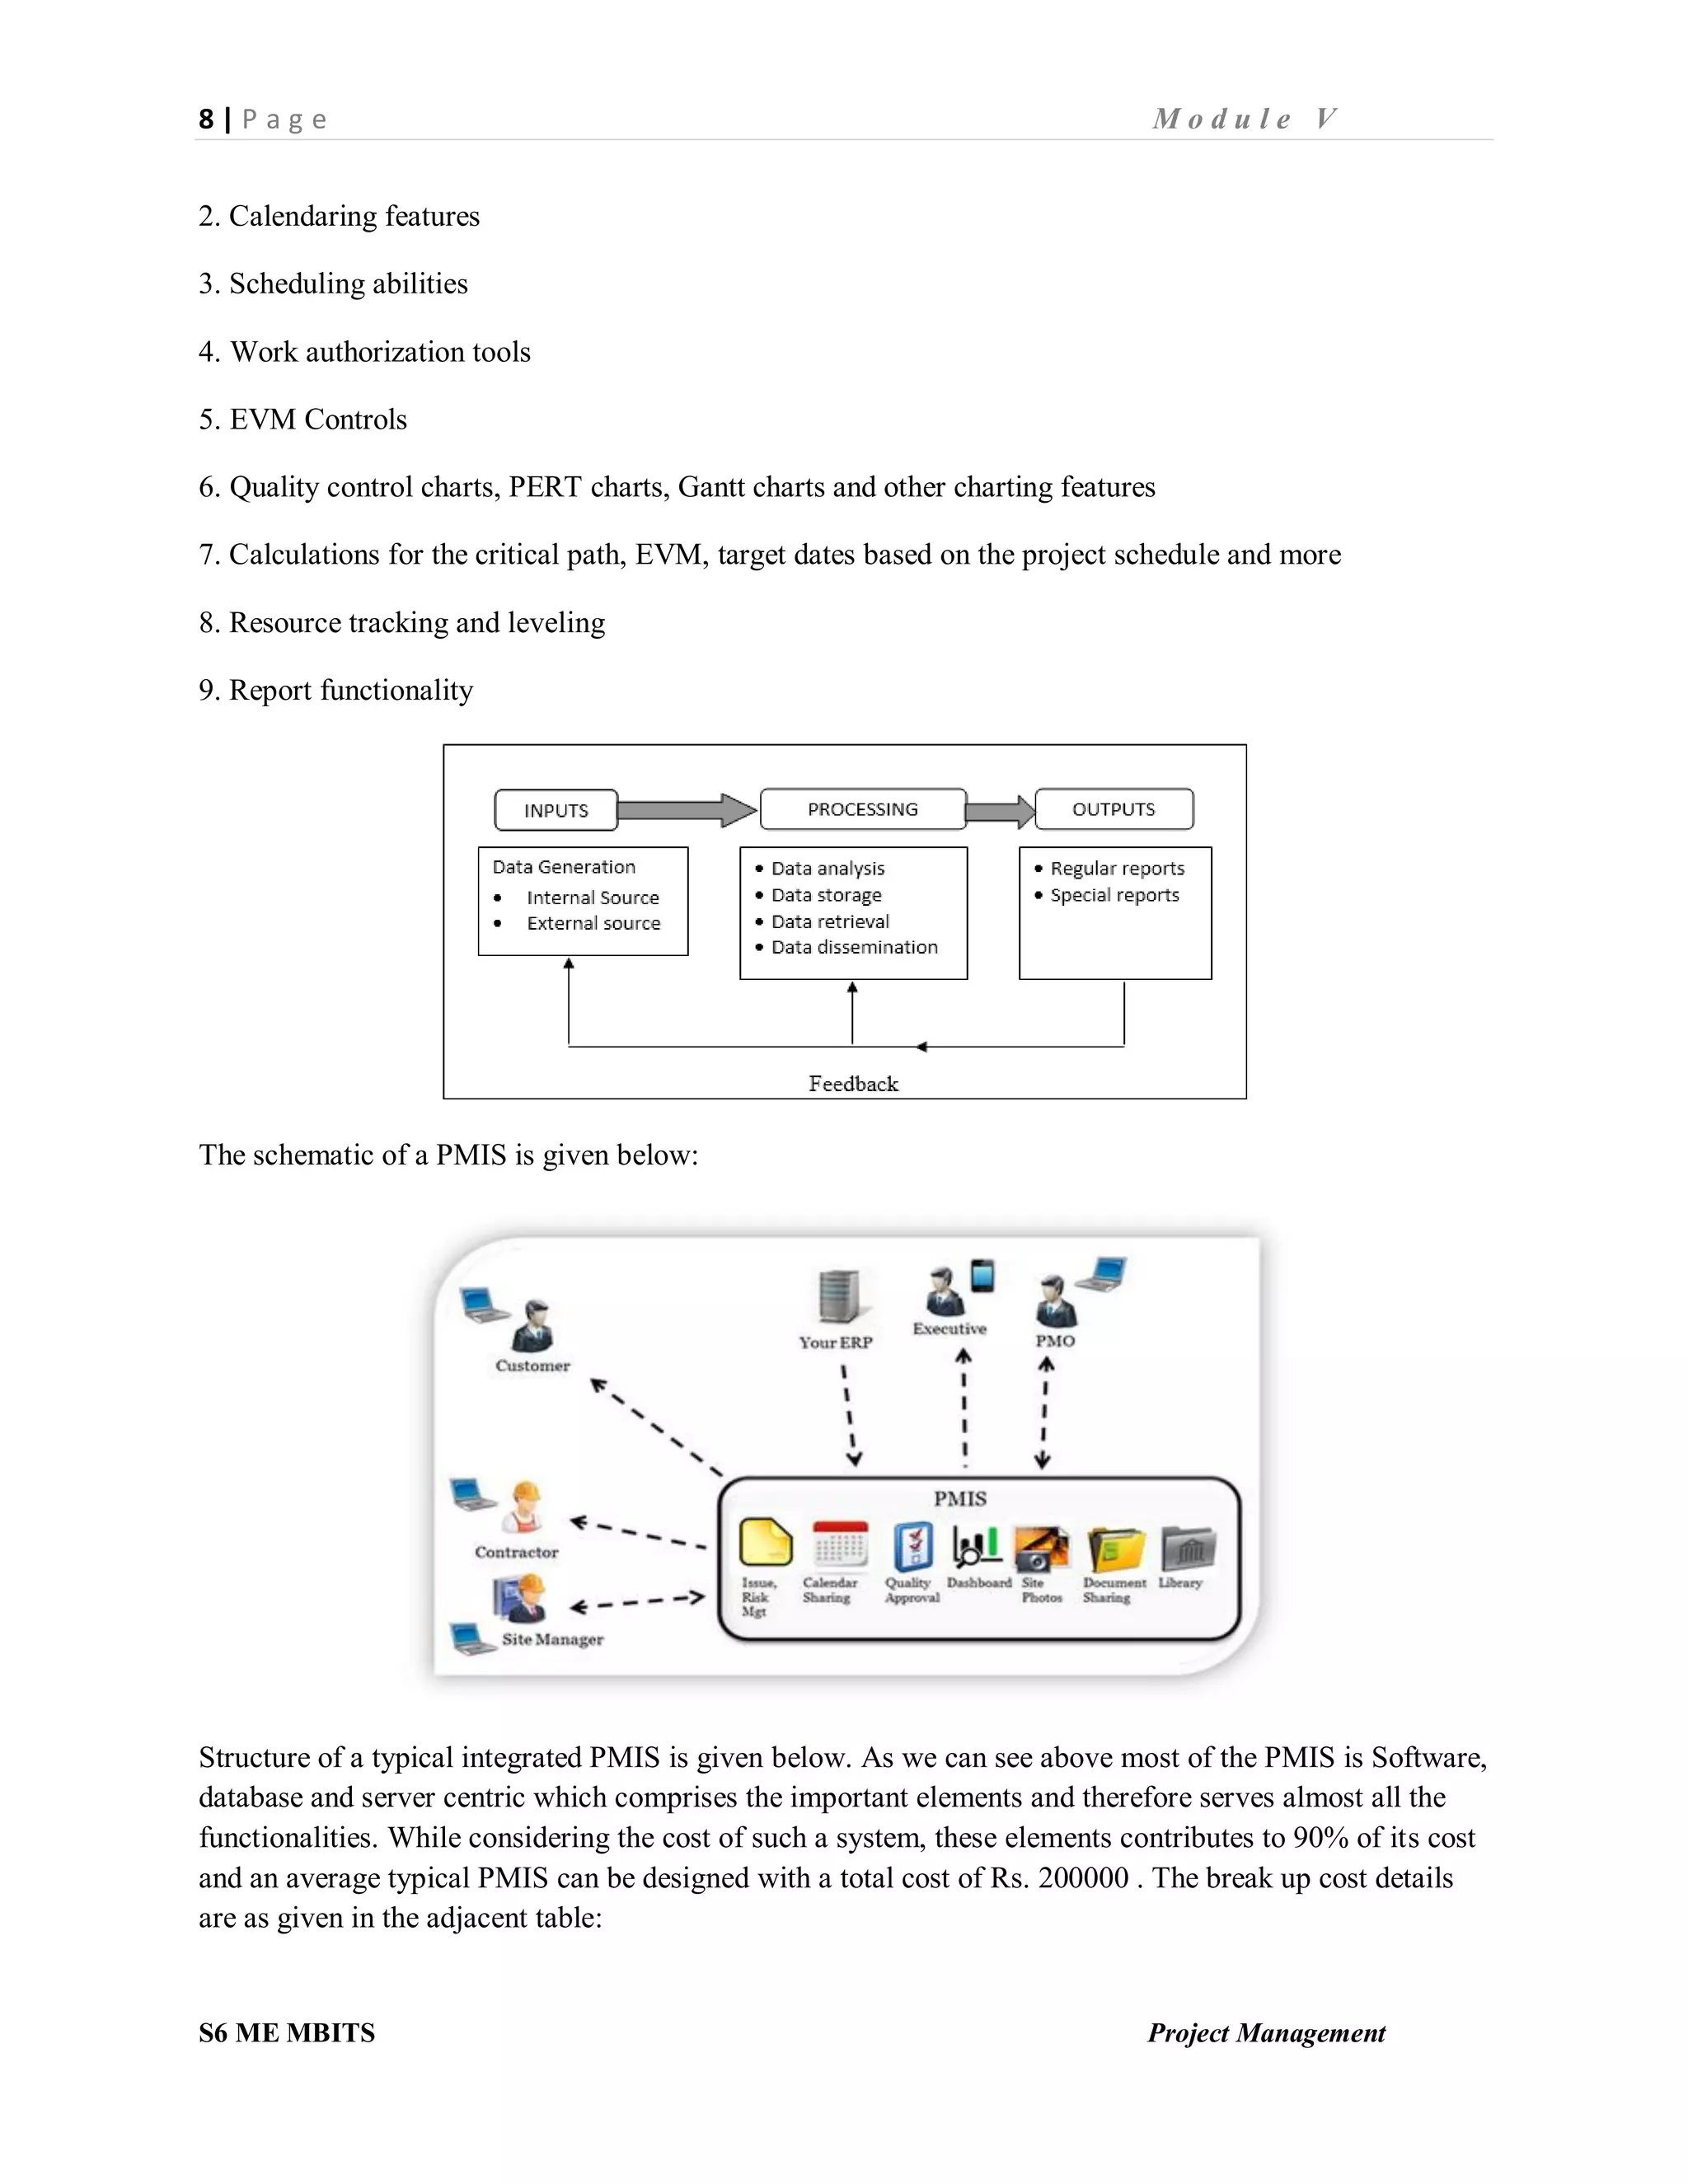
iv) The Hillier Model
The Hillier Model gives the NPV and the standard deviation of the NPV [𝜎(𝑁𝑃𝑉)] based on expected
cash flows under two different situations viz; perfectly correlated cash flows and uncorrelated cash flows.](https://image.slidesharecdn.com/ilovepdfmerged-200220114434/75/project-management-pm-note-in-mg-university-S6-sem-28-2048.jpg)
![5 | P a g e M o d u l e III
S6 ME MBITS Project Management
Response Uncorrelated cash flows Perfectly correlated cash flows
NPV
𝐶𝐹𝑡
1 + 𝑘 𝑡
𝑛
𝑡=1
− 𝐼
𝐶𝐹𝑡
1 + 𝑘 𝑡
𝑛
𝑡=1
− 𝐼
𝜎(𝑁𝑃𝑉)
𝜎𝑡
2
1 + 𝑘 2𝑡
𝑛
𝑡=1
𝜎𝑡
1 + 𝑘 𝑡
𝑛
𝑡=1
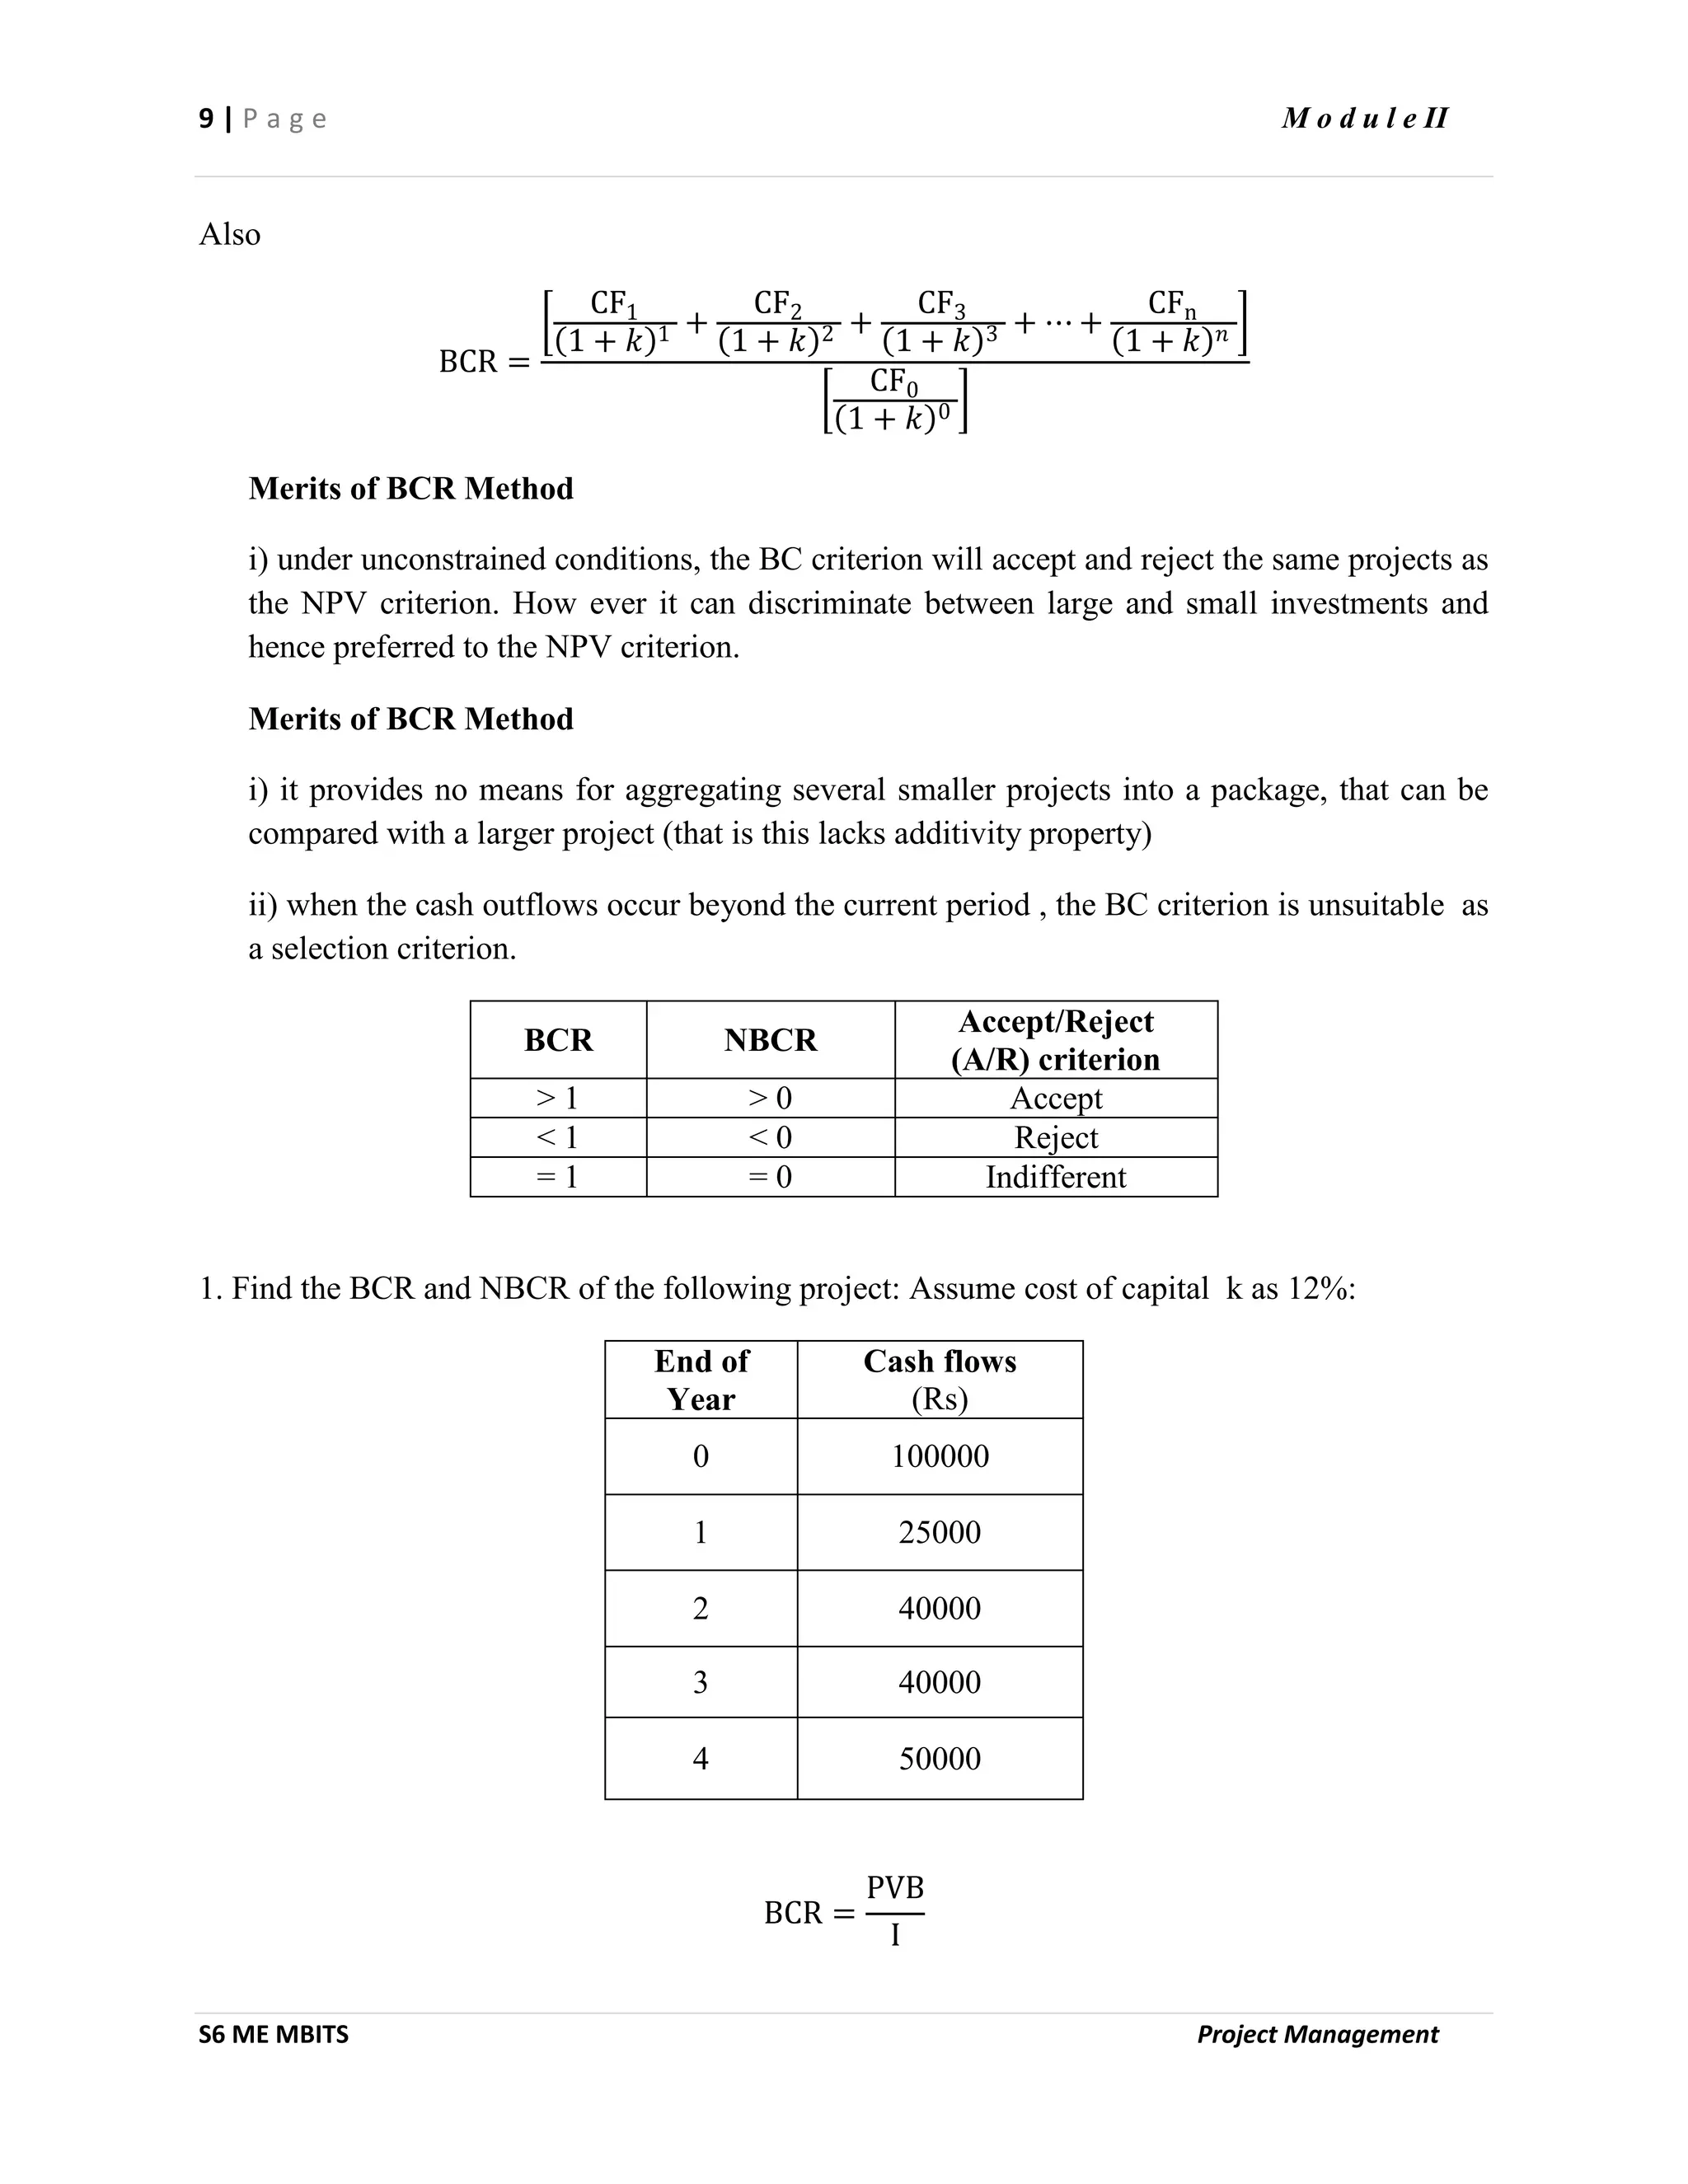
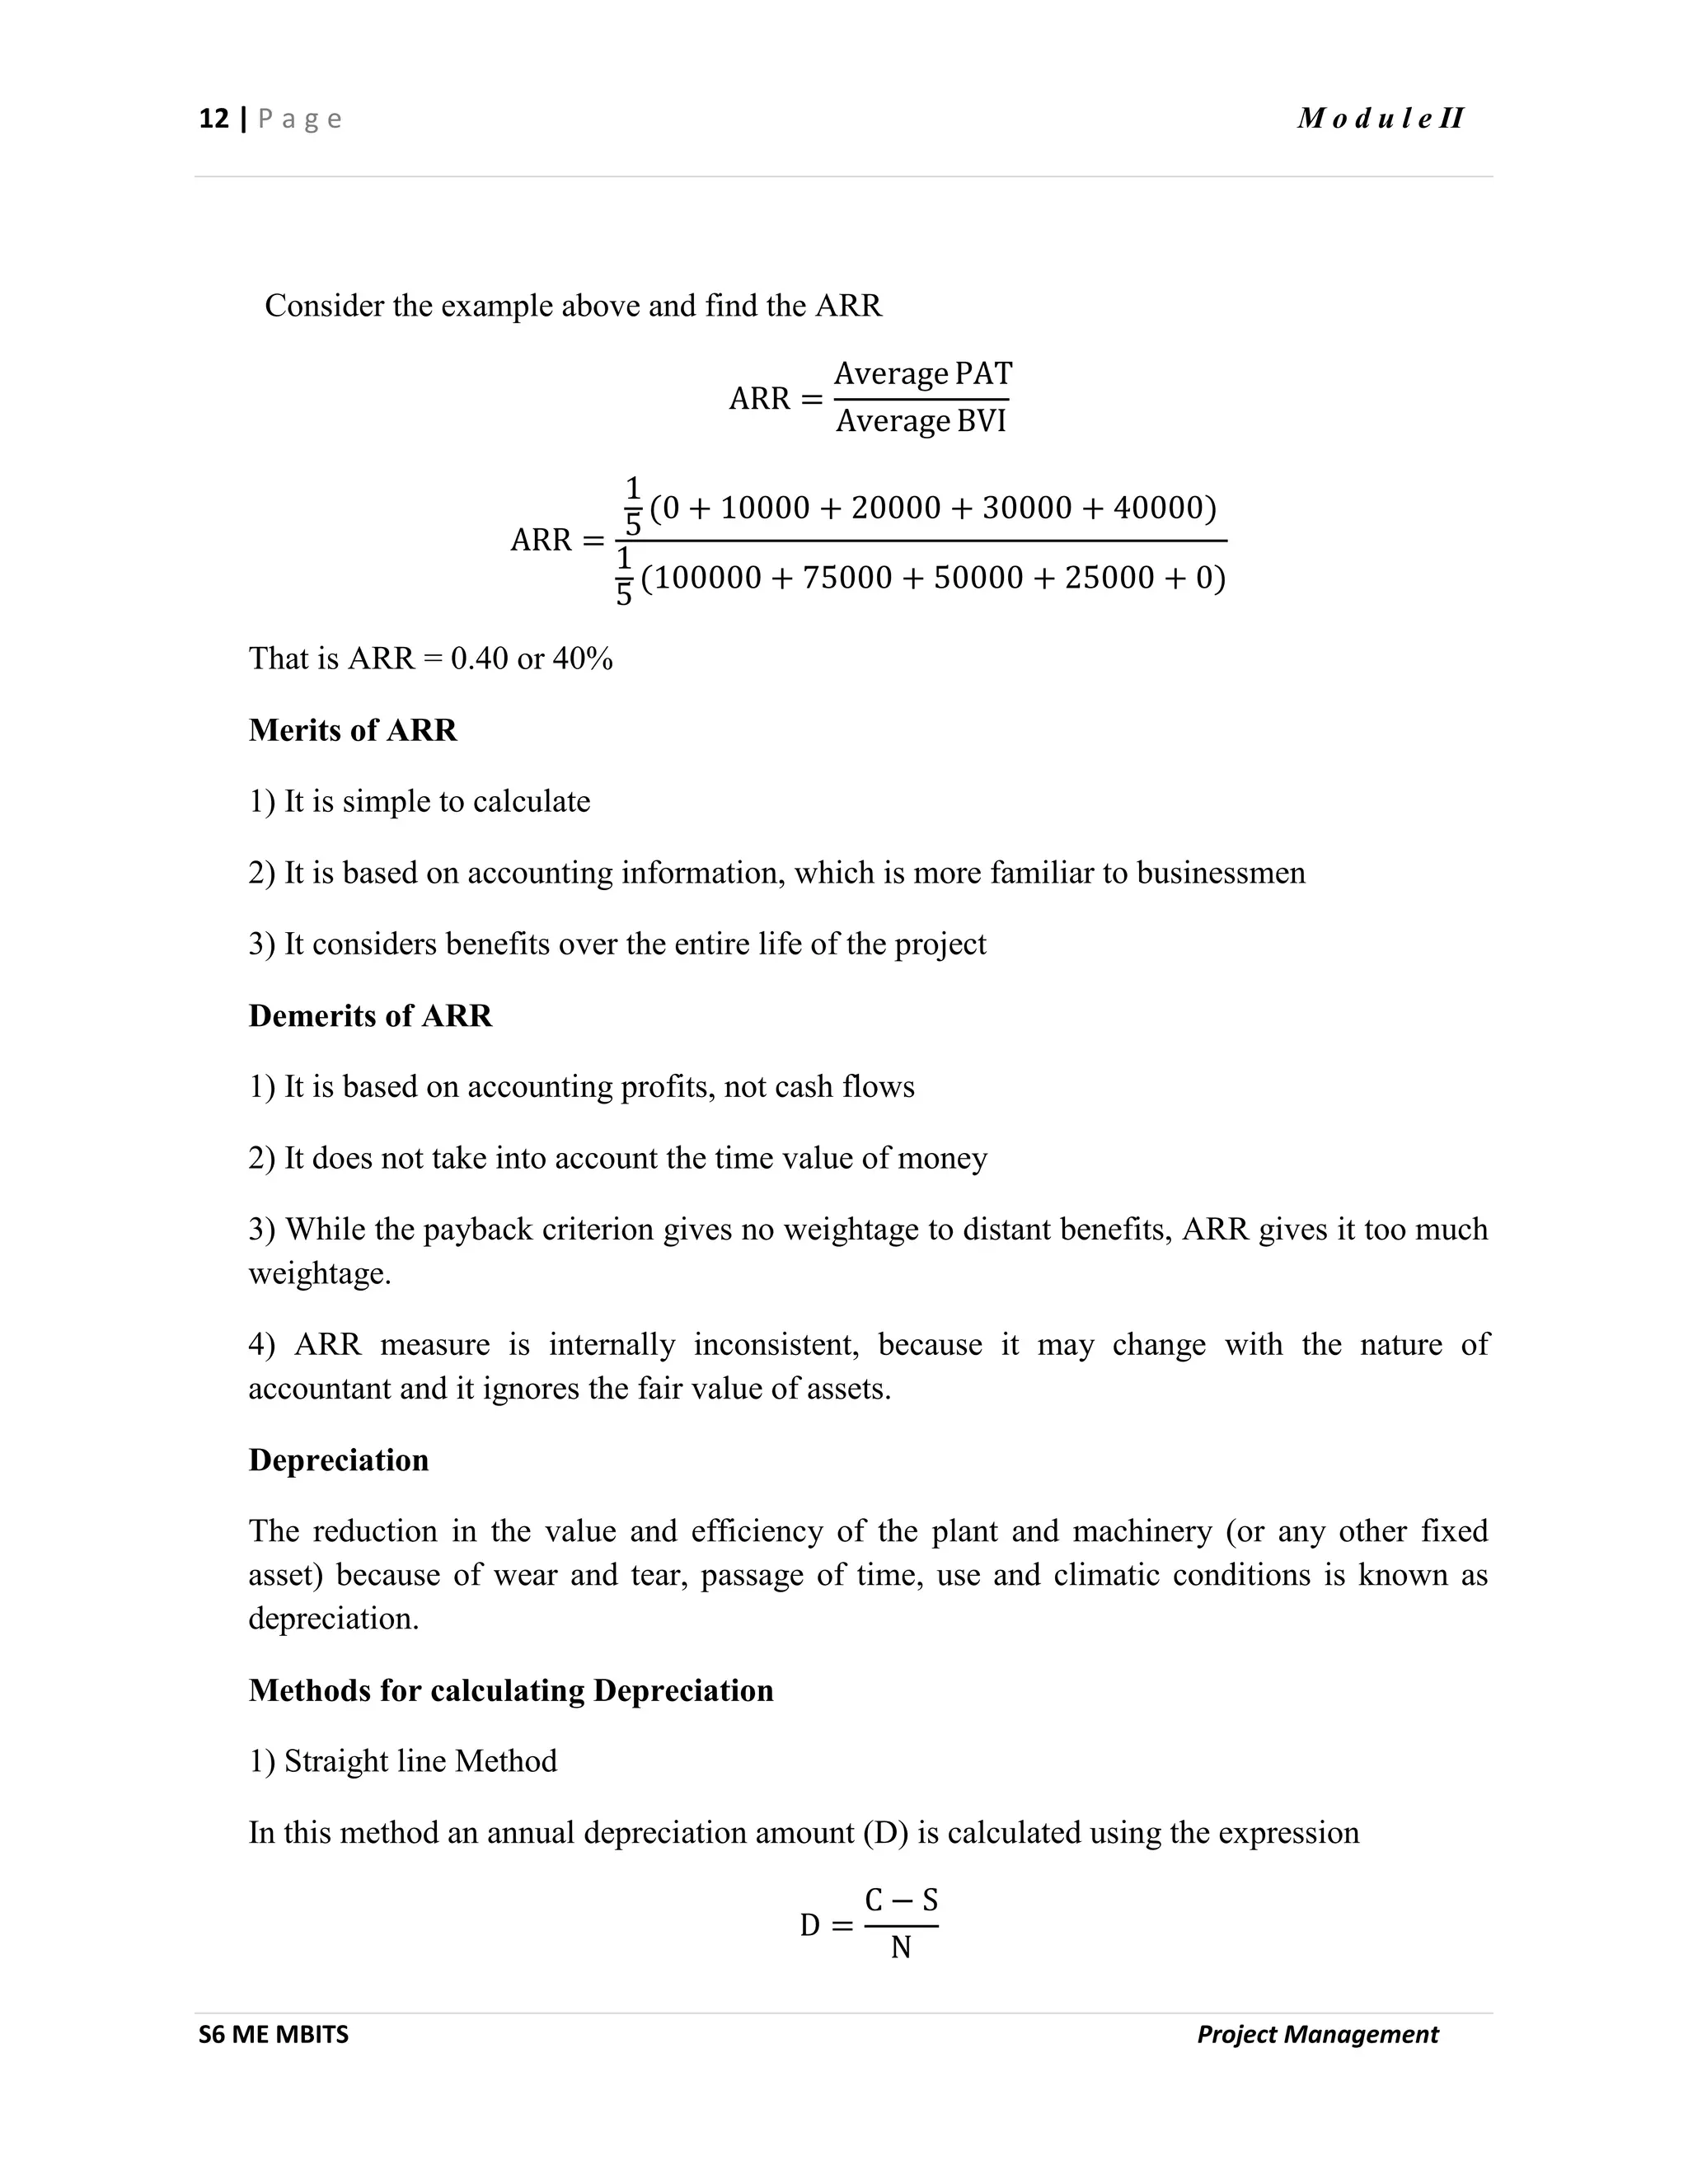
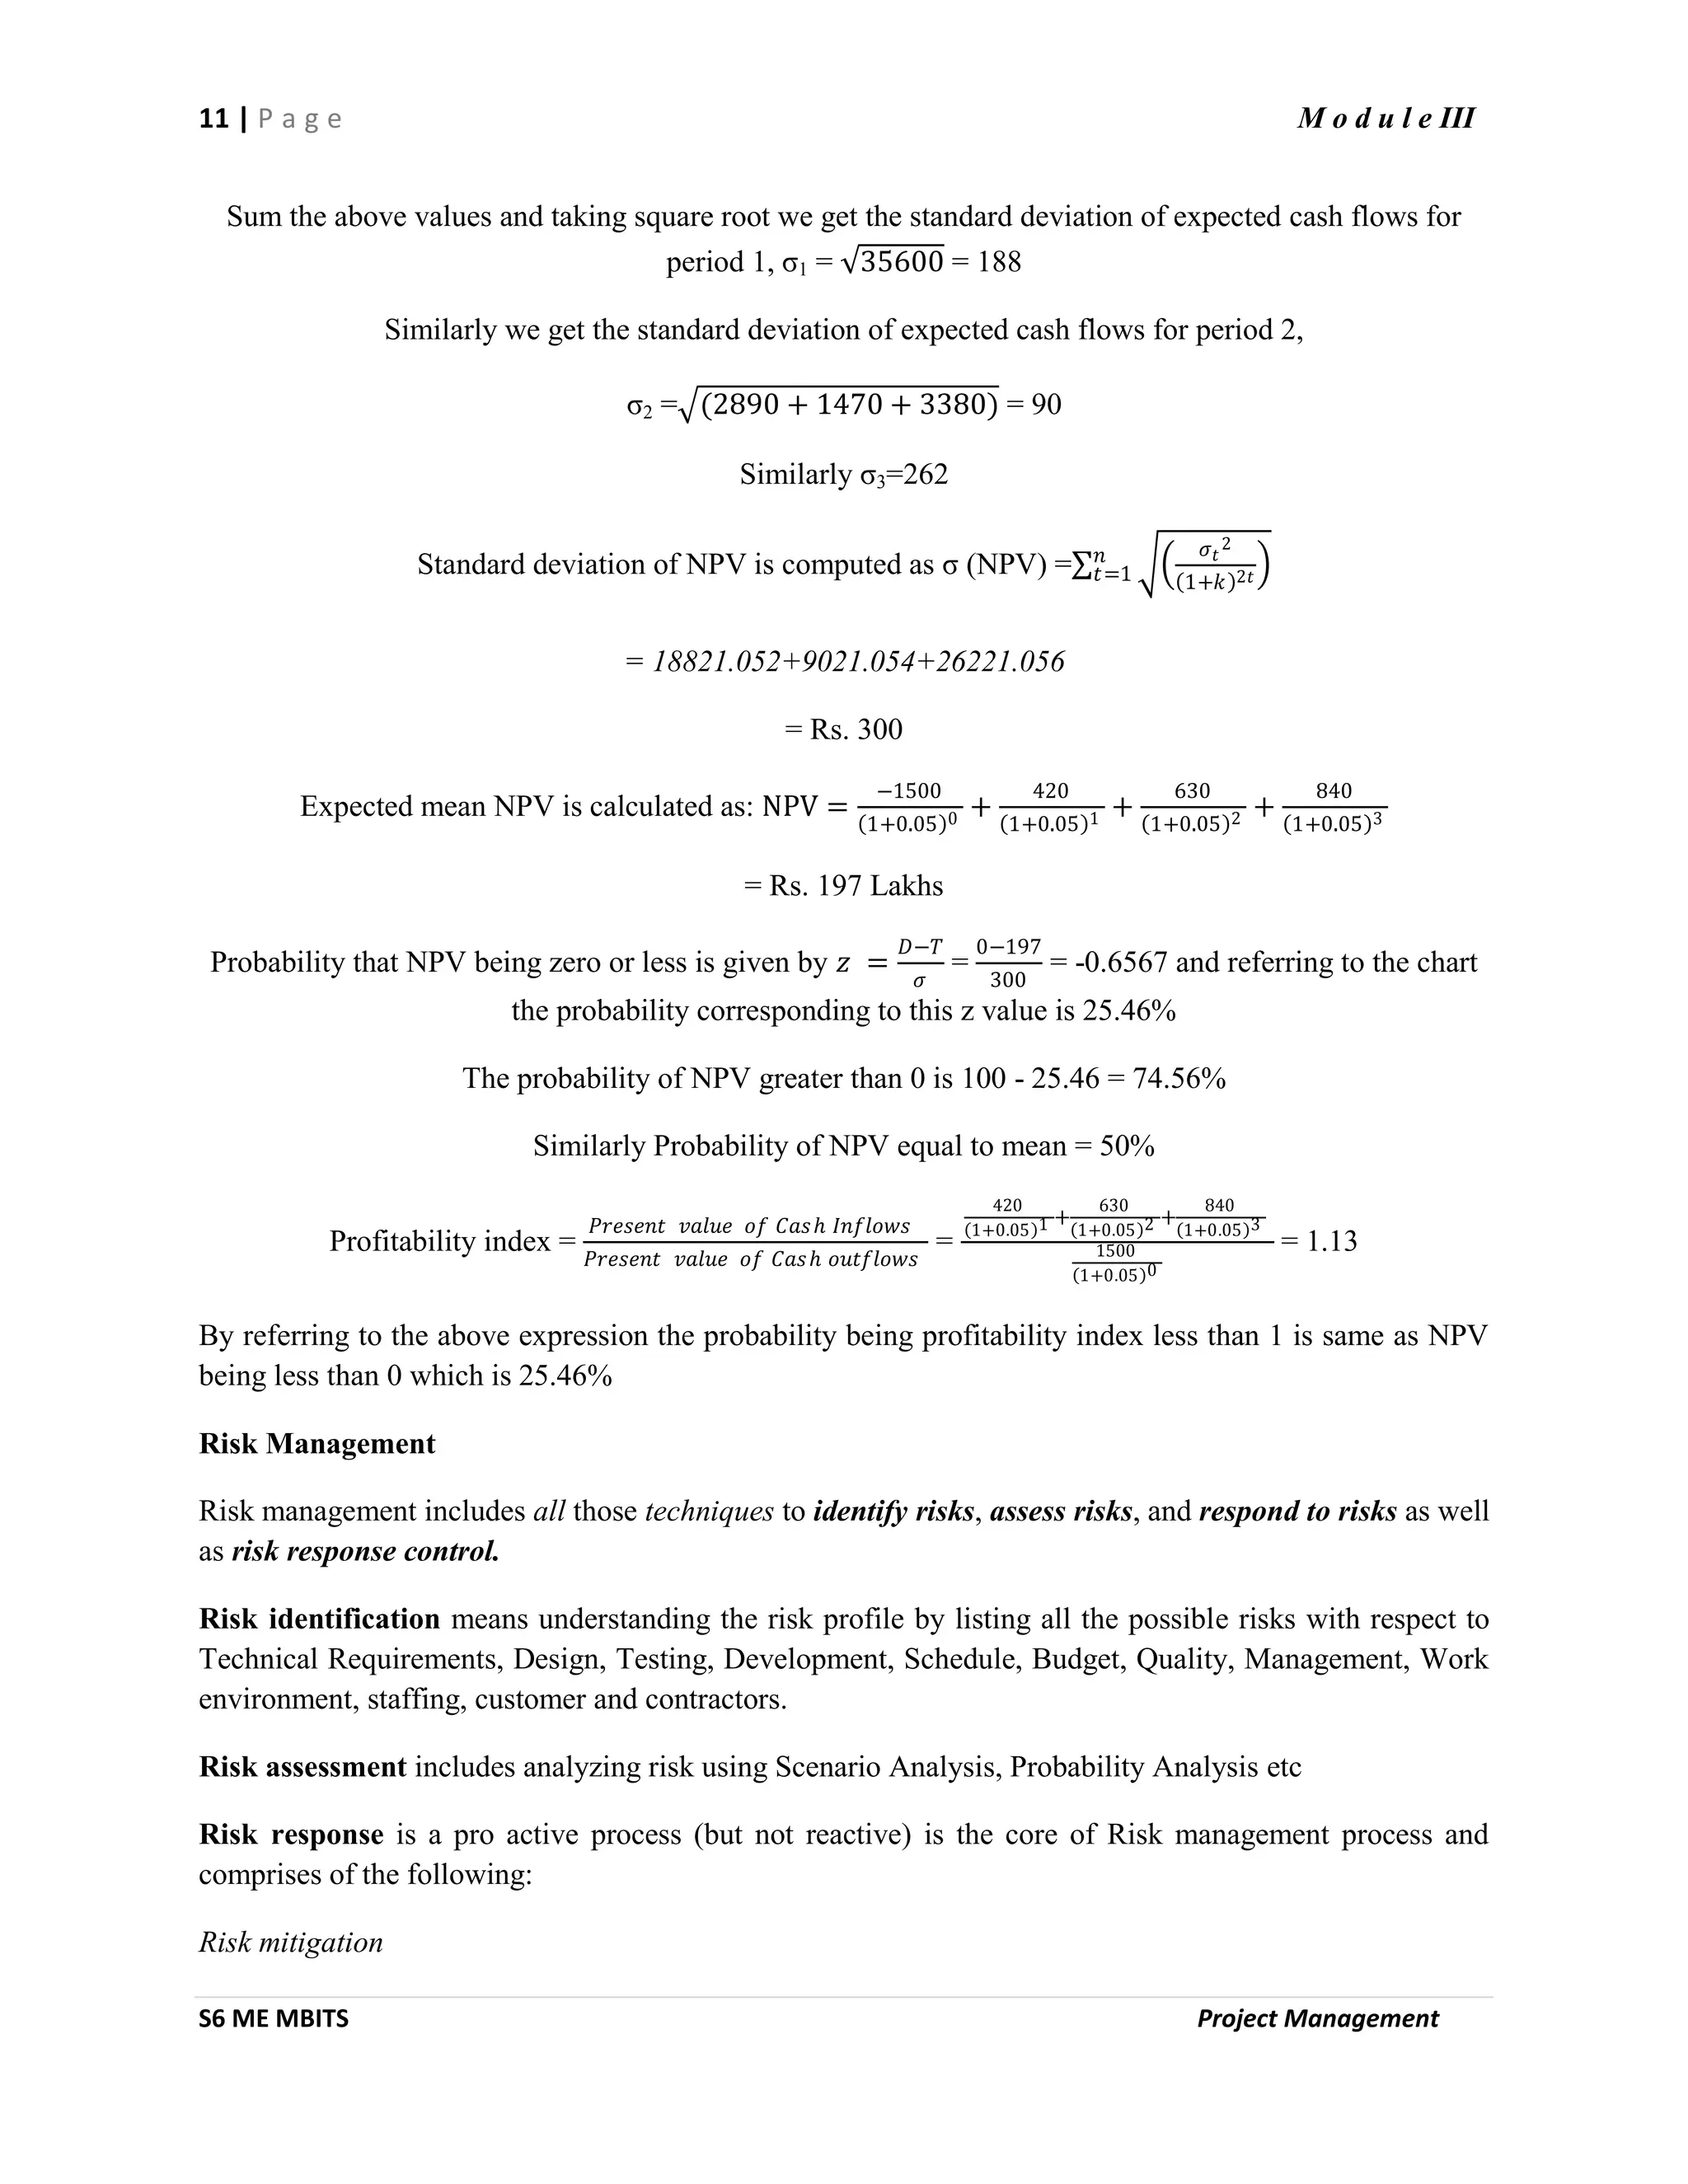
v) Standard Deviation
Standard Deviation𝜎 is the square root of the mean of the squared deviations; the deviation being the
difference between an outcome and the expected mean value of all outcomes. Note that only cash inflows
are considered for the calculations.
𝜎 = 𝑃1 (𝐶𝐹1 − 𝐶𝐹) 2 + 𝑃2(𝐶𝐹2 − 𝐶𝐹) 2 + ⋯ + 𝑃𝑛 (𝐶𝐹𝑛 − 𝐶𝐹) 2
Consider the following example:
Period
(EOY)
Cash Flows (INR Lakhs)
[Project X]
Probability
Cash Flows (INR Lakhs)
[Project Y]
Probability
0 (40000) (40000)
1 5636 0.25 40000 0.25
2 20848 0.50 20848 0.50
3 36060 0.25 1696 0.25
Rate 0.10 0.10
Economic
life (Years)
3 3
For the project X, the standard deviation is given by
𝜎 = 0.25(5636 − 20848) 2 + 0.50(20848 − 20848) 2 + 0.25(36060 − 20848) 2
= 12229.10
For the project Y, the standard deviation is given by
𝜎 = 0.25(40000 − 20848) 2 + 0.50(20848 − 20848) 2 + 0.25(1696 − 20848) 2
= 13542.51
Project Y is more risky as its standard deviation is higher when compared to Project X.
vi) Co-efficient of variation](https://image.slidesharecdn.com/ilovepdfmerged-200220114434/75/project-management-pm-note-in-mg-university-S6-sem-29-2048.jpg)


The document defines key concepts in project management including characteristics of a project, the project management process, and capital budgeting. A project has objectives, a defined timeline, uniqueness, and involves teamwork. The project management process includes identification, preparation through a feasibility study, implementation, and review. Capital budgeting involves planning, analysis, selection, financing, implementation, and review of investment projects.


