Profitability and Cost Structure Analysis: Internal Data Analysis Frameworks

More Information: http://flevy.com/browse/flevypro/profitability-and-cost-structure-analysis-internal-data-analysis-frameworks-1704 Profitability and cost structure analysis provides many invaluable insights. Obvious examples include identifying profitable products and projects and identifying key cost driving activities and resources--which lead to better strategic decisions. There are a number of business frameworks to conduct profitability and cost structure analysis. In this consulting training series, we will 4 common frameworks split into 2 categories: 1. External Data Analysis 2. Internal Data Analysis This deck will focus on Internal Data Analysis only. Got a question about the product? Email us at flevypro@flevy.com. If you cannot view the preview above this document description, go here to view the large preview instead. Source: Profitability and Cost Structure Analysis: Internal Data Analysis Frameworks PowerPoint document ABOUT FLEVYPRO FlevyPro is a subscription service for on-demand business frameworks and analysis tools. FlevyPro subscribers receive access to an exclusive library of curated business documents—business framework primers, presentation templates, Lean Six Sigma tools, and more—among other exclusive benefits.

Recommended
Recommended
More Related Content
Similar to Profitability and Cost Structure Analysis: Internal Data Analysis Frameworks
Similar to Profitability and Cost Structure Analysis: Internal Data Analysis Frameworks (20)
More from Flevy.com Best Practices
More from Flevy.com Best Practices (20)
Recently uploaded
Recently uploaded (20)
Profitability and Cost Structure Analysis: Internal Data Analysis Frameworks
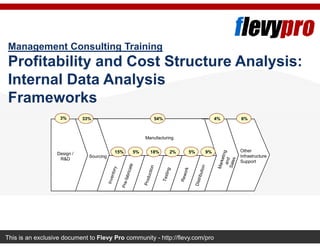
- 1. This is an exclusive document to Flevy Pro community - http://flevy.com/pro Management Consulting Training Profitability and Cost Structure Analysis: Internal Data Analysis Frameworks Other Infrastructure Support Design / R&D Sourcing Manufacturing 3% 33% 4% 6%54% 15% 5% 18% 2% 5% 9%
- 2. 2This document is an exclusive document available to Flevy Pro members - http://flevy.com/pro Contents Presentation Overview Cost Driver Analysis Activity Based Management The content on this page has been partially hidden. FlevyPro members can download the full document here: https://flevy.com/browse/flevypro/profitability-and-cost-structure-analysis-internal-data-analysis-frameworks-17 04
- 3. 3This document is an exclusive document available to Flevy Pro members - http://flevy.com/pro There are many frameworks for conducting profitability and cost structure analysis—this deck focuses on 2 such frameworks using internal data Presentation Overview Profitability and cost structure analysis provides many invaluable insights. Obvious examples include identifying profitable products and projects and identifying key cost driving activities and resources—which lead to better strategic decisions. There are a number of business frameworks to conduct profitability and cost structure analysis. In this consulting training series, we will 4 common frameworks split into 2 categories: External Data Analysis Internal Data Analysis This deck will focus on Internal Data Analysis only. The content on this page has been partially hidden. FlevyPro members can download the full document here: https://flevy.com/browse/flevypro/profitability-and-cost-structure-analysis-internal-data-analysis-frameworks-17 04
- 4. 4This document is an exclusive document available to Flevy Pro members - http://flevy.com/pro Contents Presentation Overview Cost Driver Analysis Activity Based Management The content on this page has been partially hidden. FlevyPro members can download the full document here: https://flevy.com/browse/flevypro/profitability-and-cost-structure-analysis-internal-data-analysis-frameworks-17 04
- 5. 5This document is an exclusive document available to Flevy Pro members - http://flevy.com/pro Cost driver analysis looks at the underlying cost base and identify opportunities to improve Cost Driver Analysis Overview Cost driver analysis is closely linked to Activity Based Management as it seeks to explain the main drivers of costs. Cost driver analysis seeks to identify the underlying drivers of a company’s cost base Given basic data or industry expertise, we can ‘quantify’ major costs drivers without access to internal data However, access to internal information increases the value, and potential insight, that this analysis will derive: − Also allows much better validation and comparison An understanding of the underlying cost position allows better quantification of strategic opportunities and allows clients to better anticipate strategic decisions: − Also can improve pricing and production decisions The content on this page has been partially hidden. FlevyPro members can download the full document here: https://flevy.com/browse/flevypro/profitability-and-cost-structure-analysis-internal-data-analysis-frameworks-17 04
- 6. 6This document is an exclusive document available to Flevy Pro members - http://flevy.com/pro The first step in conducting the cost value analysis is to gain a better understanding of the cost base Value Chain – Assigning Costs The first step is to assign costs to each step of a value chain We may also want to identify the major activities within each step of the value chain CLIENT VALUE CHAIN (ILLUSTRATIVE EXAMPLE) Other Infrastructure Support Design / R&D Sourcing Manufacturing 3% 33% 4% 6%54% 15% 5% 18% 2% 5% 9% The content on this page has been partially hidden. FlevyPro members can download the full document here: https://flevy.com/browse/flevypro/profitability-and-cost-structure-analysis-internal-data-analysis-frameworks-17 04
- 7. 7This document is an exclusive document available to Flevy Pro members - http://flevy.com/pro Within each stage of the value chain, we can then identify the major cost driver for the associated costs Value Chain – Cost Drivers We would clearly start our focus on the largest ‘buckets’ of costs For each value chain element or major activity, the primary cost drivers should be identified : − This requires knowledge of industry and client specific performance Analysis of cost drivers often becomes a ‘quick and dirty’ activity based costing exercise: − Analysis should focus on costs to produce and deliver relevant product(s) or service(s) under analysis − Additional costs related to other products and services should be ignored We can use clients workshops to validate the allocation of costs and the associated cost drivers The content on this page has been partially hidden. FlevyPro members can download the full document here: https://flevy.com/browse/flevypro/profitability-and-cost-structure-analysis-internal-data-analysis-frameworks-17 04
- 8. 8This document is an exclusive document available to Flevy Pro members - http://flevy.com/pro Based on our understanding of the client and its industry, we can then identify relative differences in overall costs Value Chain – Cost Drivers There are a number of generic drivers that could lead to differences in costs: – Scale – Experience – Technology – ‘Factor’ costs, e.g. raw material, labour costs – Location – Complexity – Capacity utilisation – Supply chain linkages These drivers can then be compared to competitors to identify potential structural differences in their industry The content on this page has been partially hidden. FlevyPro members can download the full document here: https://flevy.com/browse/flevypro/profitability-and-cost-structure-analysis-internal-data-analysis-frameworks-17 04
- 9. 9This document is an exclusive document available to Flevy Pro members - http://flevy.com/pro Contents Presentation Overview Cost Driver Analysis Activity Based Management The content on this page has been partially hidden. FlevyPro members can download the full document here: https://flevy.com/browse/flevypro/profitability-and-cost-structure-analysis-internal-data-analysis-frameworks-17 04
- 10. 10This document is an exclusive document available to Flevy Pro members - http://flevy.com/pro Activity Based Costing can be more useful than conventional cost systems in evaluating activity costs Activity Based Costing Overview Activity based costing evaluates the cost of activities in a company: – “Activities” are the major processes in the company associated with serving customers or with supporting the business – The cost of the activity is calculated by analysing the time and resources spent on it – Activity costs can also be assigned to products and customers, giving a better picture of product and customer profitability This information is often more useful than conventional costing information: – Conventional systems track all costs to organisation units rather than to activities – Activity based costing is particularly appropriate for evaluating the profitability impact of decisions relating to: Changing the product portfolio Re-pricing Re-engineering processes Focusing on certain customer segments The content on this page has been partially hidden. FlevyPro members can download the full document here: https://flevy.com/browse/flevypro/profitability-and-cost-structure-analysis-internal-data-analysis-frameworks-17 04
- 11. 11This document is an exclusive document available to Flevy Pro members - http://flevy.com/pro Example: which customers are profitable for a company? Process of Serving Customers This information is not automatically available—it must be calculated using activity based management. Different customers make different demands on the company: – Service level requirements: quality checks, frequency of order, information requests, etc – Product range: standard products, bespoke services, big orders/little orders To meet these demands, a company must perform activities in varying amounts: – Different types of activities cost different amounts (e.g. receiving orders vs. responding to enquiries) – Different combinations and levels of activities required by any one customer group make some groups more costly to serve than others: E.g. one group orders 2 standard items once a month, another orders 6 special items every day – Depending on the revenue collected from that customer group, it may or may not be profitable Customer requests a product / service Company take actions to satisfy the customer Actions consume resources (people time / machine capacity) Cost Object Activity Resource The content on this page has been partially hidden. FlevyPro members can download the full document here: https://flevy.com/browse/flevypro/profitability-and-cost-structure-analysis-internal-data-analysis-frameworks-17 04
- 12. 12This document is an exclusive document available to Flevy Pro members - http://flevy.com/pro Activity Based Costing differs significantly from a conventional costing approach Activity Based Costing vs. Conventional Costing Conventional Costing Activity Based Costingvs Focuses on cost centers. Focuses on business activities and corresponding activity drivers. vs Is typically limited to direct costs. Encompasses indirect overhead costs as well (if scoped accurately). vs Distinguishes between variable and fixed costs. Treats all costs as variable in the longer term.vs Uses volume as a basis for overhead allocation. No allocations—attributes overhead costs to products on the basis of resources actually consumed. vs The content on this page has been partially hidden. FlevyPro members can download the full document here: https://flevy.com/browse/flevypro/profitability-and-cost-structure-analysis-internal-data-analysis-frameworks-17 04
- 13. 13This document is an exclusive document available to Flevy Pro members - http://flevy.com/pro ABC is merely the use of a model tracing the flow of resources to products and services ABC Model ABC MODEL RESOURCES RESOURCE DRIVERS ACTIVITIES ACTIVITY DRIVERS COST OBJECTS RR RR RR RR AAAAAAAA COCOCOCOCOCOCOCO General LedgerGeneral Ledger RR ABC TRACES The cost of the resources… ... that spend time… ... doing activities… ... that are the result of… ... a customer request for a product or service The content on this page has been partially hidden. FlevyPro members can download the full document here: https://flevy.com/browse/flevypro/profitability-and-cost-structure-analysis-internal-data-analysis-frameworks-17 04
- 14. 14This document is an exclusive document available to Flevy Pro members - http://flevy.com/pro Resource drivers apportion resources’ time to activities ABC Model – Resource Drivers ABC MODEL RESOURCES RESOURCE DRIVERS ACTIVITIES ACTIVITY DRIVERS COST OBJECTS RR RR RR RR AAAAAAAA COCOCOCOCOCOCOCO General LedgerGeneral Ledger RR We identify how much time each resource pool spends on the activities it supports Account Managers Visit Customers Set-up proposal Maintain Relations 35% These percentages are known as ‘resource drivers’ 25% 40% The content on this page has been partially hidden. FlevyPro members can download the full document here: https://flevy.com/browse/flevypro/profitability-and-cost-structure-analysis-internal-data-analysis-frameworks-17 04
- 15. 15This document is an exclusive document available to Flevy Pro members - http://flevy.com/pro Activity drivers are events which initiate activities ABC Model – Activity Drivers ABC MODEL RESOURCES RESOURCE DRIVERS ACTIVITIES ACTIVITY DRIVERS COST OBJECTS RR RR RR RR AAAAAAAA COCOCOCOCOCOCOCO General LedgerGeneral Ledger RR Activity drivers trigger the use of activities by cost objects Authorization W proposals X proposals Y Proposals These are ‘activity drivers’ Product 2 Product 1 Product 3 The content on this page has been partially hidden. FlevyPro members can download the full document here: https://flevy.com/browse/flevypro/profitability-and-cost-structure-analysis-internal-data-analysis-frameworks-17 04
- 16. 16This document is an exclusive document available to Flevy Pro members - http://flevy.com/pro Useful information emerges at various levels of the model ABC Model – Insights RESOURCES RESOURCE DRIVERS ACTIVITIES ACTIVITY DRIVERS COST OBJECTS RR RR RR RR AAAAAAAA COCOCOCOCOCOCOCO RR How much do we spend on each group of people: – What is the fully loaded cost of each group? Who in the organisation spends time on these activities: – What is the value of that time? What is the total cost of activity X? What is the cost per “unit” of the activity? How much does process N cost us? Which activities are not directly supporting customers and services? – How much do they cost? Which services are most profitable/ unprofitable? What does it cost to sustain our business? The content on this page has been partially hidden. FlevyPro members can download the full document here: https://flevy.com/browse/flevypro/profitability-and-cost-structure-analysis-internal-data-analysis-frameworks-17 04
- 17. 17This document is an exclusive document available to Flevy Pro members - http://flevy.com/pro Flevy (www.flevy.com) is the marketplace for premium documents. These documents can range from Business Frameworks to Financial Models to PowerPoint Templates. Flevy was founded under the principle that companies waste a lot of time and money recreating the same foundational business documents. Our vision is for Flevy to become a comprehensive knowledge base of business documents. All organizations, from startups to large enterprises, can use Flevy— whether it's to jumpstart projects, to find reference or comparison materials, or just to learn. Contact Us Please contact us with any questions you may have about our company. • General Inquiries support@flevy.com • Media/PR press@flevy.com • Billing billing@flevy.com The content on this page has been partially hidden. FlevyPro members can download the full document here: https://flevy.com/browse/flevypro/profitability-and-cost-structure-analysis-internal-data-analysis-frameworks-17 04
- 18. 1 Flevy (www.flevy.com) is the marketplace for premium documents. These documents can range from Business Frameworks to Financial Models to PowerPoint Templates. Flevy was founded under the principle that companies waste a lot of time and money recreating the same foundational business documents. Our vision is for Flevy to become a comprehensive knowledge base of business documents. All organizations, from startups to large enterprises, can use Flevy— whether it's to jumpstart projects, to find reference or comparison materials, or just to learn. Contact Us Please contact us with any questions you may have about our company. • General Inquiries support@flevy.com • Media/PR press@flevy.com • Billing billing@flevy.com