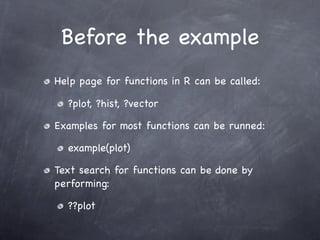
Download as KEY, PPTX

![Variables
x <- 2
x <- x^2
x
[1] 4](https://image.slidesharecdn.com/presentationrbasicteachingmodule-101212075423-phpapp01/85/Presentation-R-basic-teaching-module-5-320.jpg)
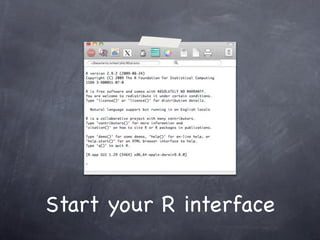
![Vectors
Many ways of generating a vector with a range of numbers:
x <- 1:10
assign(“x”, 1:10)
x <- c(1,2,3,4,5,6,7,8,9,10)
x <- seq(1,10, by=1)
x <- seq(length = 10, from=1,by=1)
x
[1] 1 2 3 4 5 6 7 8 9 10](https://image.slidesharecdn.com/presentationrbasicteachingmodule-101212075423-phpapp01/85/Presentation-R-basic-teaching-module-6-320.jpg)
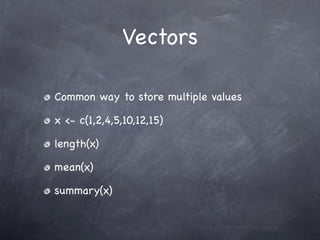
![Vectors
Vectors are indexed
x[5] + x[10]
[1] 15
x[-c(5,10)]
[1] 1 2 3 4 6 7 8 9](https://image.slidesharecdn.com/presentationrbasicteachingmodule-101212075423-phpapp01/85/Presentation-R-basic-teaching-module-8-320.jpg)
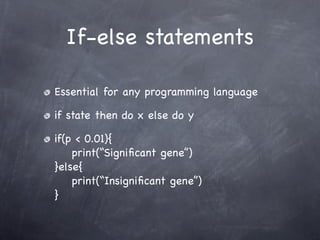
![Matrices
Common form of storing 2 dimensional data
Think about having an Excel sheet
m = matrix(1:10,2,5)
[,1] [,2] [,3] [,4] [,5]
[1,] 1 3 5 7 9
[2,] 2 4 6 8 10
summary(m)](https://image.slidesharecdn.com/presentationrbasicteachingmodule-101212075423-phpapp01/85/Presentation-R-basic-teaching-module-9-320.jpg)
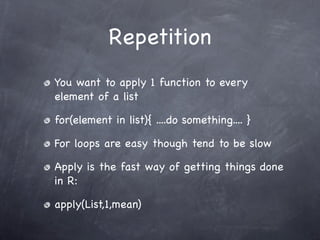
![Factors
Factors are vectors with a discrete number of
levels:
x <- factor(c(“Cancer”, “Cancer”, “Normal”,
“Normal”))
levels(x)
[1] “Cancer” “Normal”
table(x)
Cancer Normal
2 2](https://image.slidesharecdn.com/presentationrbasicteachingmodule-101212075423-phpapp01/85/Presentation-R-basic-teaching-module-10-320.jpg)
![Lists
A list can contain “anything”
Useful for storing several vectors
list(gene=”gene 1”, expression=c(5,2,3))
$gene
[1] “gene 1”
$expression
[1] 5, 2, 4](https://image.slidesharecdn.com/presentationrbasicteachingmodule-101212075423-phpapp01/85/Presentation-R-basic-teaching-module-11-320.jpg)

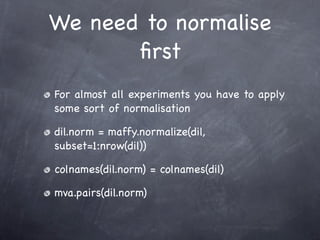
![Read file
dil = pm(Dilution)[1:2000,]
dil.ex = exprs(Dilution)[1:2000,]
rownames(dil.ex) =
row.names(probes(Dilution))[1:2000]](https://image.slidesharecdn.com/presentationrbasicteachingmodule-101212075423-phpapp01/85/Presentation-R-basic-teaching-module-29-320.jpg)
![Checking expression
Heatmap representation of expression levels
for different probes
heatmap(dil.ex.norm[1:50,])
You could apply a T-test for example to rank
to only plot the most significant probes](https://image.slidesharecdn.com/presentationrbasicteachingmodule-101212075423-phpapp01/85/Presentation-R-basic-teaching-module-33-320.jpg)
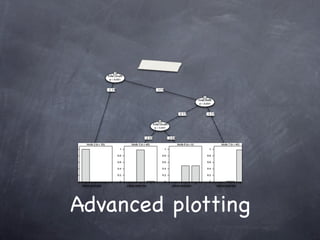
![Checking expression
Heatmap representation of expression levels
for different probes
heatmap(dil.ex.norm[1:50,])
You could apply a T-test for example to rank
to only plot the most significant probes](https://image.slidesharecdn.com/presentationrbasicteachingmodule-101212075423-phpapp01/85/Presentation-R-basic-teaching-module-34-320.jpg)
![Checking expression
You could apply a T-test for example to rank
to only plot the most significant probes
library(genefilter)
f = factor(c(1,1,2,2))
dil.exp.norm.t = rowttests(dil.exp.norm, fac=f)
heatmap(dil.exp.norm[order(dil.exp.norm.t
$dm)[1:10],])](https://image.slidesharecdn.com/presentationrbasicteachingmodule-101212075423-phpapp01/85/Presentation-R-basic-teaching-module-35-320.jpg)


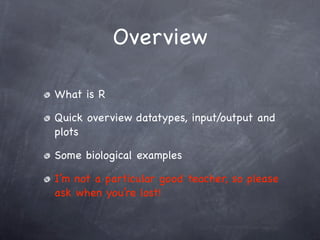
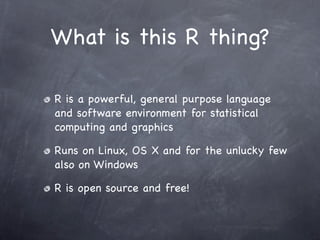
This document provides an introduction to the statistical programming language R. It outlines what R is, how to access and use its interface, and how to work with basic data types like vectors, matrices, and factors. It also demonstrates how to import and export data, perform basic plotting and graphics, and gives examples working with biological data from Affymetrix chips. The presenter encourages attendees to ask questions and notes they are not a perfect teacher.