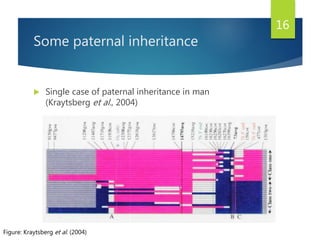
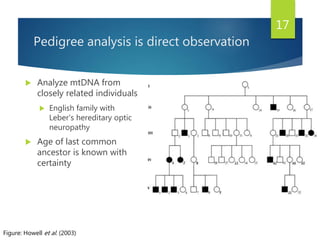
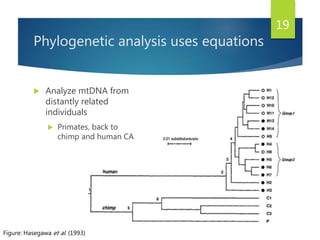
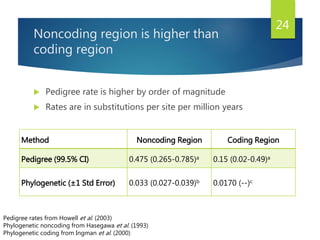
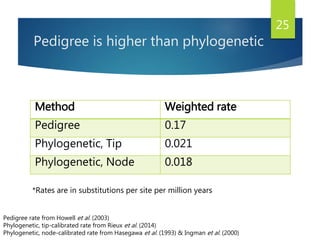
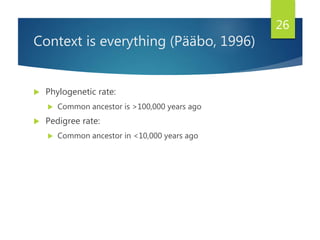
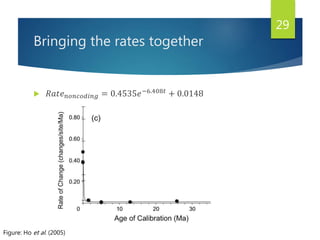
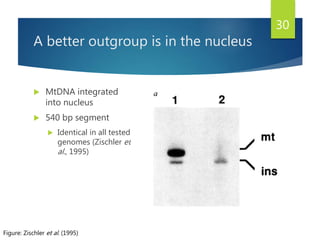
1. “Great” Grandma and
You: Methods of
Analyzing Human
MtDNA Substitution
Rate
BY SETH NELSON
THURSDAY, OCTOBER 8TH, 2015
1
2. Outline
I. Mitochondria and DNA
II. MtDNA anatomy and replication
III. Methods of finding substitution rate
IV. Improvement on current findings
V. Using the rate
2
3. I. Mitochondria
and DNA
I. MITOCHONDRIA AND
DNA
II. MTDNA ANATOMY
III. METHODS OF
FINDING
SUBSTITUTION RATE
IV. IMPROVEMENT ON
CURRENT FINDINGS
V. USING THE RATE
3
5. Using DNA for phylogenetic inference
Figure: García et al. (2011)
5
6. Why use mtDNA
More mtDNA copies than
nDNA (Robin and Wong,
1988)
Mitochondria are
inherited from mother
(Schwartz and Vissing,
2003)
High mutation rate, good
for closely related
individuals (Butler and
Levin, 1998)
Image from https://www.thermofisher.com/us/en/home/technical-resources/research-tools/image-
gallery/image-gallery-detail.2643.html
6
7. II. MtDNA
Anatomy and
Replication
I. MITOCHONDRIA AND
DNA
II. MTDNA ANATOMY
AND REPLICATION
III. METHODS OF
FINDING
SUBSTITUTION RATE
IV. IMPROVEMENT ON
CURRENT FINDINGS
V. USING THE RATE
7
8. Anatomy of mtDNA
Figure: Pakendorf and Stoneking (2005)
Transfer
RNAs
NADH
Dehydrogenase
subunits
Cytochrome c
Oxidase subunits
Cytochrome bRibosomal
RNAs
ATP
Synthase
subunits
8
9. Control region
Controls replication
No protein product
Two hypervariable
regions
Figure: Pakendorf and Stoneking (2005)
9
11. Mutations in replication of DNA
Insertion
Deletion
Frameshift
Substitution
Transition
Transversion
Figure: Sadava et al., 2011
11
12. Substitutions happen at specific rates
Substitutions per site per million years
Numerator: Number of sequence differences, only
counting substitutions
That is, no insertions, deletions, etc.
Denominator: Time since last common ancestor
between sequences of comparison
12
13. III. Methods of
Finding
Substitution
Rate
I. MITOCHONDRIA AND DNA
II. MTDNA ANATOMY
III. METHODS OF FINDING
SUBSTITUTION RATE
I. Considerations
II. Pedigree
III. Phylogenetic
IV. IMPROVEMENT ON
CURRENT FINDINGS
V. USING THE RATE
13
14. Secondary structure forms
Light strand forms loop
structure (Pereira et al., 2008)
Selective pressure on control
region
Figure: Pereira et al. (2008)
14
15. MtDNA can recombine
Mitochondria possess
recombinase activity
(Thyagarajan et al., 1996)
Does not affect substitution
rate (Kraytsberg et al., 2004)
15
Figure: Thyagarajan et al. (1996)
16. Some paternal inheritance
Single case of paternal inheritance in man
(Kraytsberg et al., 2004)
Figure: Kraytsberg et al. (2004)
16
17. Pedigree analysis is direct observation
Analyze mtDNA from
closely related individuals
English family with
Leber’s hereditary optic
neuropathy
Age of last common
ancestor is known with
certainty
Figure: Howell et al. (2003)
17
18. Less time means fewer mutations
Pedigree analysis tends to count fast mutations
Potentially overestimate substitution rate
18
19. Phylogenetic analysis uses equations
Analyze mtDNA from
distantly related
individuals
Primates, back to
chimp and human CA
Figure: Hasegawa et al. (1993)
19
21. More time means more uncertainty
Denominator more uncertain
Phylogenetic analysis counts all substitutions since
last CA
Reversions will cause undercount in mutations
Need methods of calibration
21
24. Noncoding region is higher than
coding region
Pedigree rate is higher by order of magnitude
Rates are in substitutions per site per million years
Method Noncoding Region Coding Region
Pedigree (99.5% CI) 0.475 (0.265-0.785)a 0.15 (0.02-0.49)a
Phylogenetic (±1 Std Error) 0.033 (0.027-0.039)b 0.0170 (--)c
24
Pedigree rates from Howell et al. (2003)
Phylogenetic noncoding from Hasegawa et al. (1993)
Phylogenetic coding from Ingman et al. (2000)
25. Pedigree is higher than phylogenetic
Method Weighted rate
Pedigree 0.17
Phylogenetic, Tip 0.021
Phylogenetic, Node 0.018
25
Pedigree rate from Howell et al. (2003)
Phylogenetic, tip-calibrated rate from Rieux et al. (2014)
Phylogenetic, node-calibrated rate from Hasegawa et al. (1993) & Ingman et al. (2000)
*Rates are in substitutions per site per million years
26. Context is everything (Pääbo, 1996)
Phylogenetic rate:
Common ancestor is >100,000 years ago
Pedigree rate:
Common ancestor in <10,000 years ago
26
27. IV. Improvement
on Current
Findings
I. MITOCHONDRIA AND
DNA
II. MTDNA ANATOMY
AND REPLICATION
III. METHODS OF
FINDING
SUBSTITUTION RATE
IV. IMPROVEMENT ON
CURRENT FINDINGS
V. USING THE RATE
27
28. Bringing the rates together
𝑅𝑎𝑡𝑒 𝑐𝑜𝑑𝑖𝑛𝑔 = 0.5204𝑒−2.042𝑡 + 0.0144
28
Figure: Ho et al. (2005)
29. Bringing the rates together
𝑅𝑎𝑡𝑒 𝑛𝑜𝑛𝑐𝑜𝑑𝑖𝑛𝑔 = 0.4535𝑒−6.408𝑡 + 0.0148
29
Figure: Ho et al. (2005)
30. A better outgroup is in the nucleus
MtDNA integrated
into nucleus
540 bp segment
Identical in all tested
genomes (Zischler et
al., 1995)
30
Figure: Zischler et al. (1995)
31. V. Using the Rate
I. MITOCHONDRIA AND
DNA
II. MTDNA ANATOMY
AND REPLICATION
III. METHODS OF
FINDING
SUBSTITUTION RATE
IV. IMPROVEMENT ON
CURRENT FINDINGS
V. USING THE RATE
31
32. Use in forensics
Forensic applications focus on HV1 and HV2
Romanov identification (Butler and Levin, 1998)
Tsarina, her daughters, Prince Philip were exact
matches
One mismatch for Tsar Nicholas II and relatives
“Anastasia” did not match
32
34. Unrelated to “Great” Grandma
How far back in time do we need to go to be “unrelated” to
our ancestors?
1.1% (12 bp) difference in unrelated control sequences (Piercy
et al., 1993)
Roughly 1000 generations before we are unrelated to our
ancestors
34
35. Knowing this, we look deeper
Substitution rate is effectively variable
Temporally and spacially
Allows a second look at archeological dates
Could help us understand relationships better
Methods used in mtDNA could be extended
35
Have you ever wondered how related you are to your ancestors?
Plant mtDNA is very different, as in much larger, but not necessarily more genes.
Possibly baggage from evolution
Plants have more than 150kb length
Cats are smaller, like humans around 16kb
Inherited by mainly seed parent, except in conifers (maybe all gymnosperms)
Mitochondria are present in cytoplasm of ovum, not in sperm head
Each number is a sequence polymorphism at that site that is unique to each sample beneath it.
Green fibers are mitochondria
Blue is actin filaments
Orange is nucleus
Cytochrome c oxidase: 3 subunits from mitochondria, 11 from nucleus
NADH dehydrogenase: 7 subunits from mitochondria, 37 from nucleus
ATP Synthase: 2 subunits from mitochondria, others from nucleus
All involved in electron transport chain
Origin of replication of Heavy strand
Does not contain genes
Two main area of hypervariation, mutate faster than rest of control region
Heavy strand is first replicated (high in purines, A and G)
There is some lag until light strand is synthesized
Displacement-loop structure forms
D-loop is whole control region without promoters (HSP and LSP)
Transition: purine (A ↔ G) or pyrimidine (C ↔ T)
Transversion: purine to pyrimidine or vice versa
Transition
Transition, Transversion
Both
Transversion
Transition
Sequence differences are between two sequences of comparison (for example, chimps and humans)
93 bp segment that is statistically selected for (using Tajima’s D-value)
Occurs when D-loop is single strand during replication lag
Fractions were normalized to fraction 3
Black bars: cytochrome-c oxidase activity - Gilford Response spectrophotometer
White bars: homologous DNA recombination – mitochondrial DNA recombined with plasmids
Homologous recombination between maternal mito molecules is invisible
Red is maternal sequence, blue is paternal sequence
Five generations, four females and current one
LHON affects sensation at peripheral nerves, not mitochondrial disease, but using pedigree as if it was
Circles are female, squares are male—filled shapes visibly suffer form LHON
Numbers bolded, italicized had sequences analyzed
Focus on 9 and 31
Due to brevity of pedigrees (five generations is quite a long pedigree)
Numerator is more certain, as there is more time for mutations to occur
where 𝜋 𝑋 is the frequency of nucleotide 𝑋, and 𝛼 and 𝛽 are parameters that determine transition rate and transversion rate, respectively.
Denominator is less certain
Denominator often in millions of years, with significance to maybe .5 million years
Used BEAST, Bayesian Evolutionary Analysis Sampling Trees
Hasegawa et al. calibrated with external node of last common mtDNA ancestor
Noncoding is higher than coding
Extrapolation
MtDNA mutates so quickly phylogenetic information can be wiped out by so many substitutions
Mutates very slowly since unchanged
Prince Philip’s great-grandmother was Tsarina’s sister
Is the mismatch of Anastasia outside the realm of possibility, knowing mitochondria change through generations?