
Recommended
Recommended
More Related Content
Similar to Predicting Business Confidence using News and Social Media
Similar to Predicting Business Confidence using News and Social Media (20)
Recently uploaded
Recently uploaded (20)
Predicting Business Confidence using News and Social Media
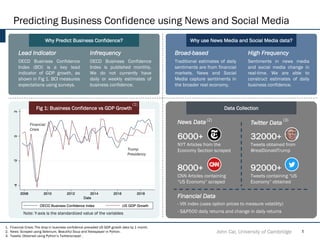
- 1. Predicting Business Confidence using News and Social Media Why Predict Business Confidence? Financial Crisis John Cai, University of Cambridge 1 Why use News Media and Social Media data? Data Collection 8000+ CNN Articles containing “US Economy” scraped 92000+ Tweets containing “US Economy” obtained 32000+ Tweets obtained from @realDonaldTrump 6000+ NYT Articles from the Economy Section scraped News Data Twitter Data Fig 1: Business Confidence vs GDP Growth 1. Financial Crisis: The drop in business confidence preceded US GDP growth data by 1 month. 2. News: Scraped using Selenium, Beautiful Soup and Newspaper in Python. 3. Tweets: Obtained using Python’s Twitterscraper . (2) (3) Trump Presidency Lead Indicator OECD Business Confidence Index (BCI) is a key lead indicator of GDP growth, as shown in Fig 1. BCI measures expectations using surveys. Infrequency OECD Business Confidence Index is published monthly. We do not currently have daily or weekly estimates of business confidence. High Frequency Sentiments in news media and social media change in real-time. We are able to construct estimates of daily business confidence. Broad-based Traditional estimates of daily sentiments are from financial markets. News and Social Media capture sentiments in the broader real economy. - VIX index (uses option prices to measure volatility) - S&P500 daily returns and change in daily returns Financial Data (1) Note: Y-axis is the standardized value of the variables
- 2. Building a Prediction Model using NLP and ML John Cai, University of Cambridge 2 1. NLTK: developed by Stanford and trained on movie reviews. VADER: Developed by Georgia Tech and trained on tweets. 2. Cross-validation using h-step ahead: Calculates MSPE by taking the actual value – forecasted value from the model. 3. Plot of Squared Prediction Error over time, to see how the relative performance of the two models varies over the test period. Use Textblob to tokenize the textual data at the words level and the sentence level. Remove stop-words and creating n-grams. NLP Perform Features Scaling with scikit-learn by standardizing all features. Set aside 20% of the data for Testing (2016-2018) and another 20% for Validation. 1. Data Pre-processing Employ VADER’s lexical and rule- based classifier and NLTK’s Naïve Bayes Classifier to obtain polarity and/or subjectivity. 2. Sentiment Analysis Compute the average and cross- sectional variance of sentiments over every month. Omit features with unit roots. 3. Feature Engineering 4. Data Preparation Employ Cross-Validation LASSO with a rolling forecast origin and fixed window (adapted for time- series). LASSO selects features with high prediction value. 5. Training the Model 0 0.1 0.2 0.3 0.4 Oct-16 Apr-17 Oct-17 Apr-18 Oct-18 Less Parsimonious More Parsimonious ML Fig 2: Test-Set Squared Error 𝜆"#$ , which corresponds to a more parsimonious model, is preferred as the model has a smaller MSPE for out-of-sample predictions (shown in Fig 2). 6. Model Selection Training subset Validation Get Mean Squared Prediction Error (MSPE) over the Test Set Cross Validation Loop Tunes hyper-parameters by minimizing the MSPE from h- step ahead forecasting over the Validation SetGives penalty terms 𝜆 𝑜𝑝𝑡 and 𝜆"#$, which allows us to select features. Training Set Test (1) (2) (3)
- 3. John Cai, University of Cambridge 3 1. LASSO selected the VADER Score rather than the NLTK Score, likely because VADER is trained on Social Media data. 2. Uncertainty is reflected in sentiment variance. In recessions, uncertainty and sentiment variance increase (Bloom, 2018). 3. Markov Switching Models would account for the structural breaks expected during recessions (Hamilton, 2010). Fig 3: Best Prediction Model ( 𝜆"#$) Fig 4: Model Evaluation Neutral BullishBearish High Error Very Low Error Low Error Limitations and ExtensionsResults and Implications 1. Twitter sentiments are most informative of BCI Twitter has the highest value in prediction compared to NYT, CNN and Trump’s Tweets. 2. Results are consistent with economic theory Variance of sentiments predicts business confidence because it is counter-cyclical (-- coefficent). Features Selected (sign of coeff) 1. Twitter Polarity Mean (+) 2. Twitter Polarity Variance (--) 3. VIX Index (--) 4. Returns (+) 5. Lagged Returns (+) 6. Lagged BCI (+) 3. Model works best during neutral and bullish periods As shown in Fig 4, the squared prediction error is much higher for bearish periods. 4. Possible extension: Markov Switching Models Performance in bearish periods could improve if Markov chains are used for structural breaks. Analyzing and Evaluating Results from the Prediction Model (1) (2) (3)