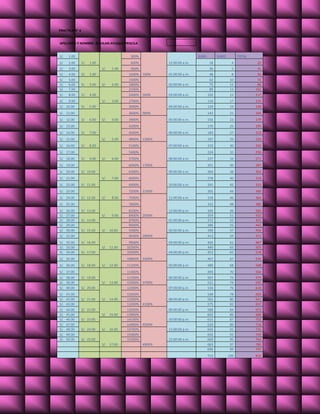
This document appears to be a student assignment containing tables and calculations. It lists amounts of money in Soles (S/.) with increasing values from S/. 1.00 to S/. 50.00. It includes calculations for sums, percentages, and totals at increasing time intervals from 12:00:00 a.m. to 12:00:00 a.m. the next day. The student's name listed is Gavilan Ayque Priscila.
IBM i Monitoring by the Dashboard LightHelpSystems
What if you could see IBM i system performance and application statuses across all partitions in a single screen? What if you only had to look in one place to see what’s happening now, what happened in the past few hours, or what happened last week or last month?
Graphical monitoring provides greater visibility, making it easier to manage your IBM i systems and applications. Ah, paradise at last!
Let our experts demonstrate how easy it is to build Robot Monitor dashboards that allow you to manage your IBM i environment with unprecedented detail and clarity. You’ll learn how to:
-Configure single- or multi-system views
-Add real-time performance widgets
-Include custom-written SQL widget data
-Show multiple metrics in a single widget
-Provide monitored data for any date or time range
-Highlight monthly summarized metrics
Get a good look at the wealth of information provided at a single glance using Robot Monitor dashboards—check it out today!