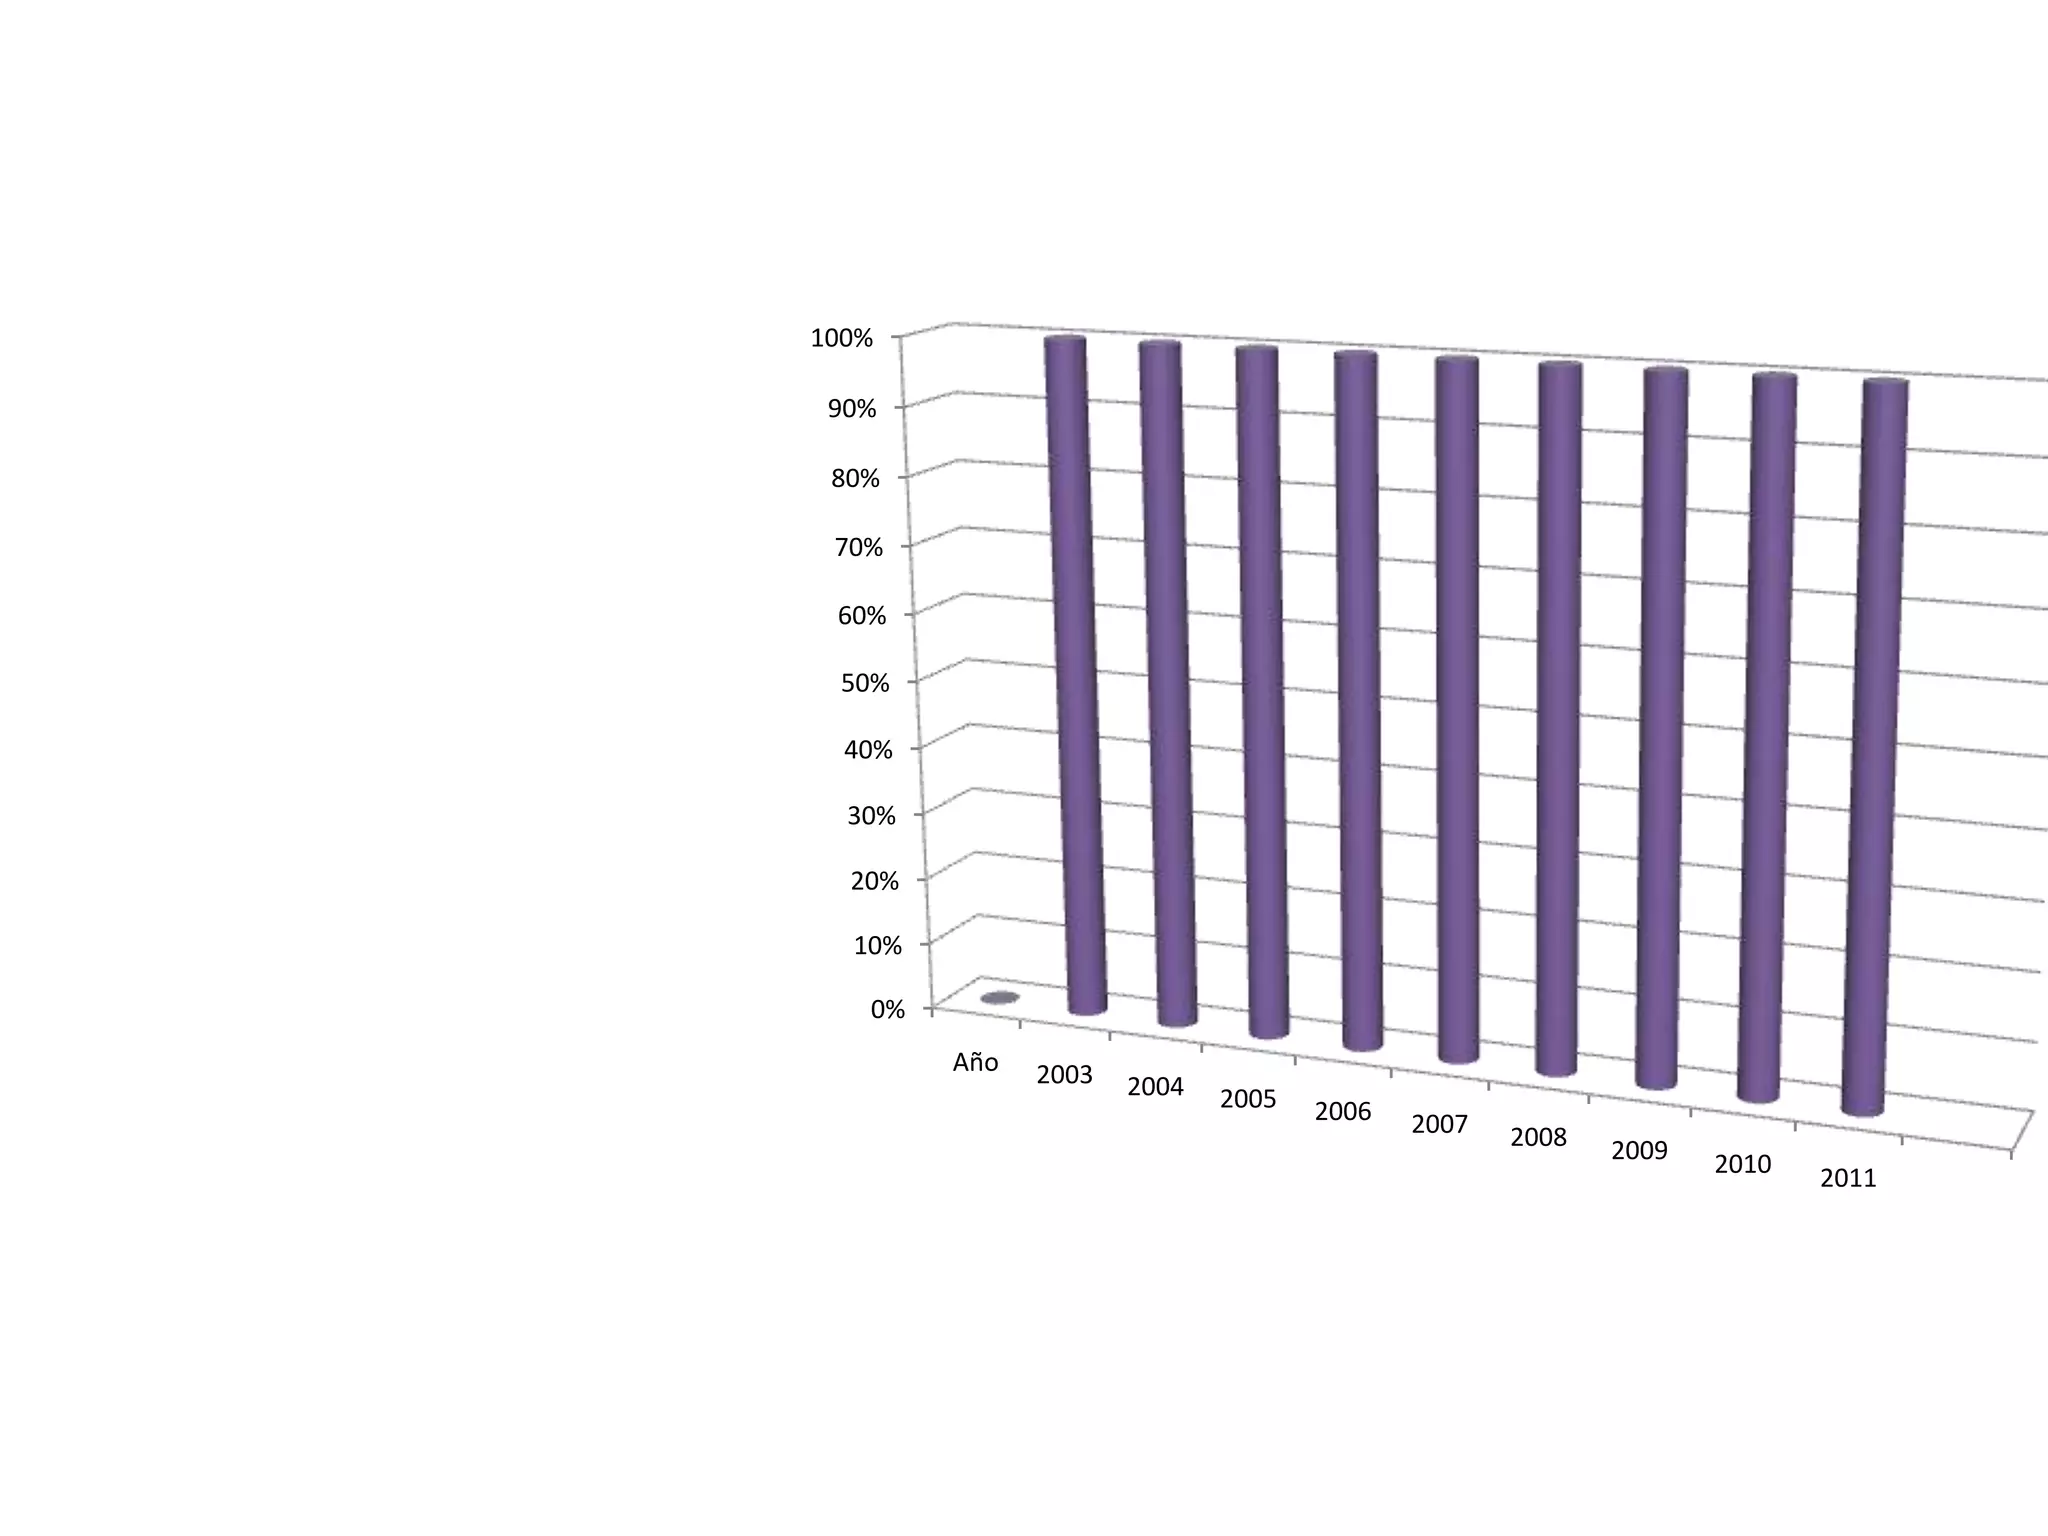
The document shows percentages ranging from 100% to 0% on the y-axis across the years 2003 to 2011 on the x-axis, indicating some variable that has decreased over time from 2003 to 2011.