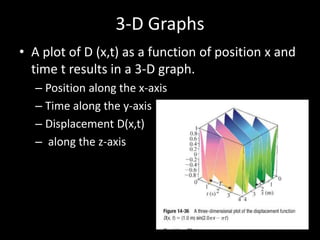
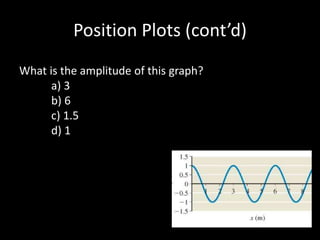
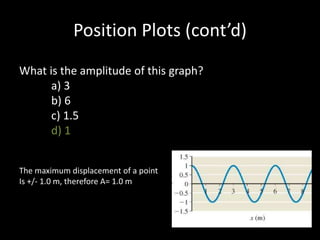
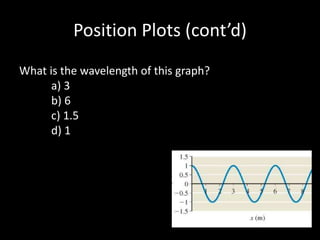
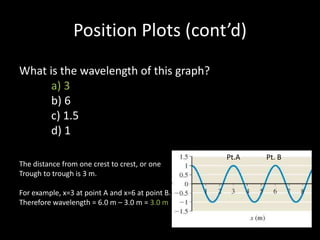
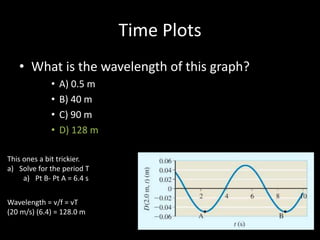
Chapter 14 Waves:
Position Plots and Time Plots
3-D Graphs
• A plot of D (x,t) as a function of position x and
time t results in a 3-D graph.
– Position along the x-axis
– Time along the y-axis
– Displacement D(x,t)
– along the z-axis
• While visually helpful, it makes it difficult to
determine the wavelength, frequency,
amplitude and phase constant
• Thus we use plots where one variable is kept
constant, and the wave f(x) is plotted against
the other variable
Position Plots
• Time is fixed; wave function is plotted as a
function of position (x)
• Shows Δd of every section of the medium at a
fixed time
• Like taking a snapshot: “Snapshot Graphs”
Position Plots (cont’d)
What is the amplitude of this graph?
a) 3
b) 6
c) 1.5
d) 1
Position Plots (cont’d)
What is the amplitude of this graph?
a) 3
b) 6
c) 1.5
d) 1
The maximum displacement of a point
Is +/- 1.0 m, therefore A= 1.0 m
Position Plots (cont’d)
What is the wavelength of this graph?
a) 3
b) 6
c) 1.5
d) 1
Position Plots (cont’d)
What is the wavelength of this graph?
a) 3
b) 6
c) 1.5
d) 1
The distance from one crest to crest, or one
Trough to trough is 3 m.
For example, x=3 at point A and x=6 at point B.
Therefore wavelength = 6.0 m – 3.0 m = 3.0 m
Pt.A Pt. B
Time Plots
• The wave function D(x,t) is plotted as a
function of time for a fixed position.
• The time plot shows how the displacement of
a given point of the medium varies with time
• “History Graphs”
Time Plots
• What is the Amplitude of this graph?
• A) 0.5 m
• B) 0.4 m
• C) 4.0 m
• D) 2.0 m
Time Plots
• What is the Amplitude of this graph?
• A) 0.5 m
• B) 0.4 m
• C) 4.0 m
• D) 2.0 m
The maximum displacement of a point
Is +/- 0.5 m. Therefore A= 0.5 m
Time Plots
• What is the wavelength of this graph?
• A) 0.5 m
• B) 40 m
• C) 90 m
• D) 128 m
Time Plots
• What is the wavelength of this graph?
• A) 0.5 m
• B) 40 m
• C) 90 m
• D) 128 m
This ones a bit trickier.
a) Solve for the period T
a) Pt B- Pt A = 6.4 s
Wavelength = v/f = vT
(20 m/s) (6.4) = 128.0 m
Position and Time Plots
• For more help/information, refer to pages
211-213 of Physics: for Scientists and
Engineers, An Interactive Approach (text)

Position and time plots learning object

  • 1.
    Chapter 14 Waves: PositionPlots and Time Plots
  • 2.
    3-D Graphs • Aplot of D (x,t) as a function of position x and time t results in a 3-D graph. – Position along the x-axis – Time along the y-axis – Displacement D(x,t) – along the z-axis
  • 3.
    • While visuallyhelpful, it makes it difficult to determine the wavelength, frequency, amplitude and phase constant • Thus we use plots where one variable is kept constant, and the wave f(x) is plotted against the other variable
  • 4.
    Position Plots • Timeis fixed; wave function is plotted as a function of position (x) • Shows Δd of every section of the medium at a fixed time • Like taking a snapshot: “Snapshot Graphs”
  • 5.
    Position Plots (cont’d) Whatis the amplitude of this graph? a) 3 b) 6 c) 1.5 d) 1
  • 6.
    Position Plots (cont’d) Whatis the amplitude of this graph? a) 3 b) 6 c) 1.5 d) 1 The maximum displacement of a point Is +/- 1.0 m, therefore A= 1.0 m
  • 7.
    Position Plots (cont’d) Whatis the wavelength of this graph? a) 3 b) 6 c) 1.5 d) 1
  • 8.
    Position Plots (cont’d) Whatis the wavelength of this graph? a) 3 b) 6 c) 1.5 d) 1 The distance from one crest to crest, or one Trough to trough is 3 m. For example, x=3 at point A and x=6 at point B. Therefore wavelength = 6.0 m – 3.0 m = 3.0 m Pt.A Pt. B
  • 9.
    Time Plots • Thewave function D(x,t) is plotted as a function of time for a fixed position. • The time plot shows how the displacement of a given point of the medium varies with time • “History Graphs”
  • 10.
    Time Plots • Whatis the Amplitude of this graph? • A) 0.5 m • B) 0.4 m • C) 4.0 m • D) 2.0 m
  • 11.
    Time Plots • Whatis the Amplitude of this graph? • A) 0.5 m • B) 0.4 m • C) 4.0 m • D) 2.0 m The maximum displacement of a point Is +/- 0.5 m. Therefore A= 0.5 m
  • 12.
    Time Plots • Whatis the wavelength of this graph? • A) 0.5 m • B) 40 m • C) 90 m • D) 128 m
  • 13.
    Time Plots • Whatis the wavelength of this graph? • A) 0.5 m • B) 40 m • C) 90 m • D) 128 m This ones a bit trickier. a) Solve for the period T a) Pt B- Pt A = 6.4 s Wavelength = v/f = vT (20 m/s) (6.4) = 128.0 m
  • 14.
    Position and TimePlots • For more help/information, refer to pages 211-213 of Physics: for Scientists and Engineers, An Interactive Approach (text)