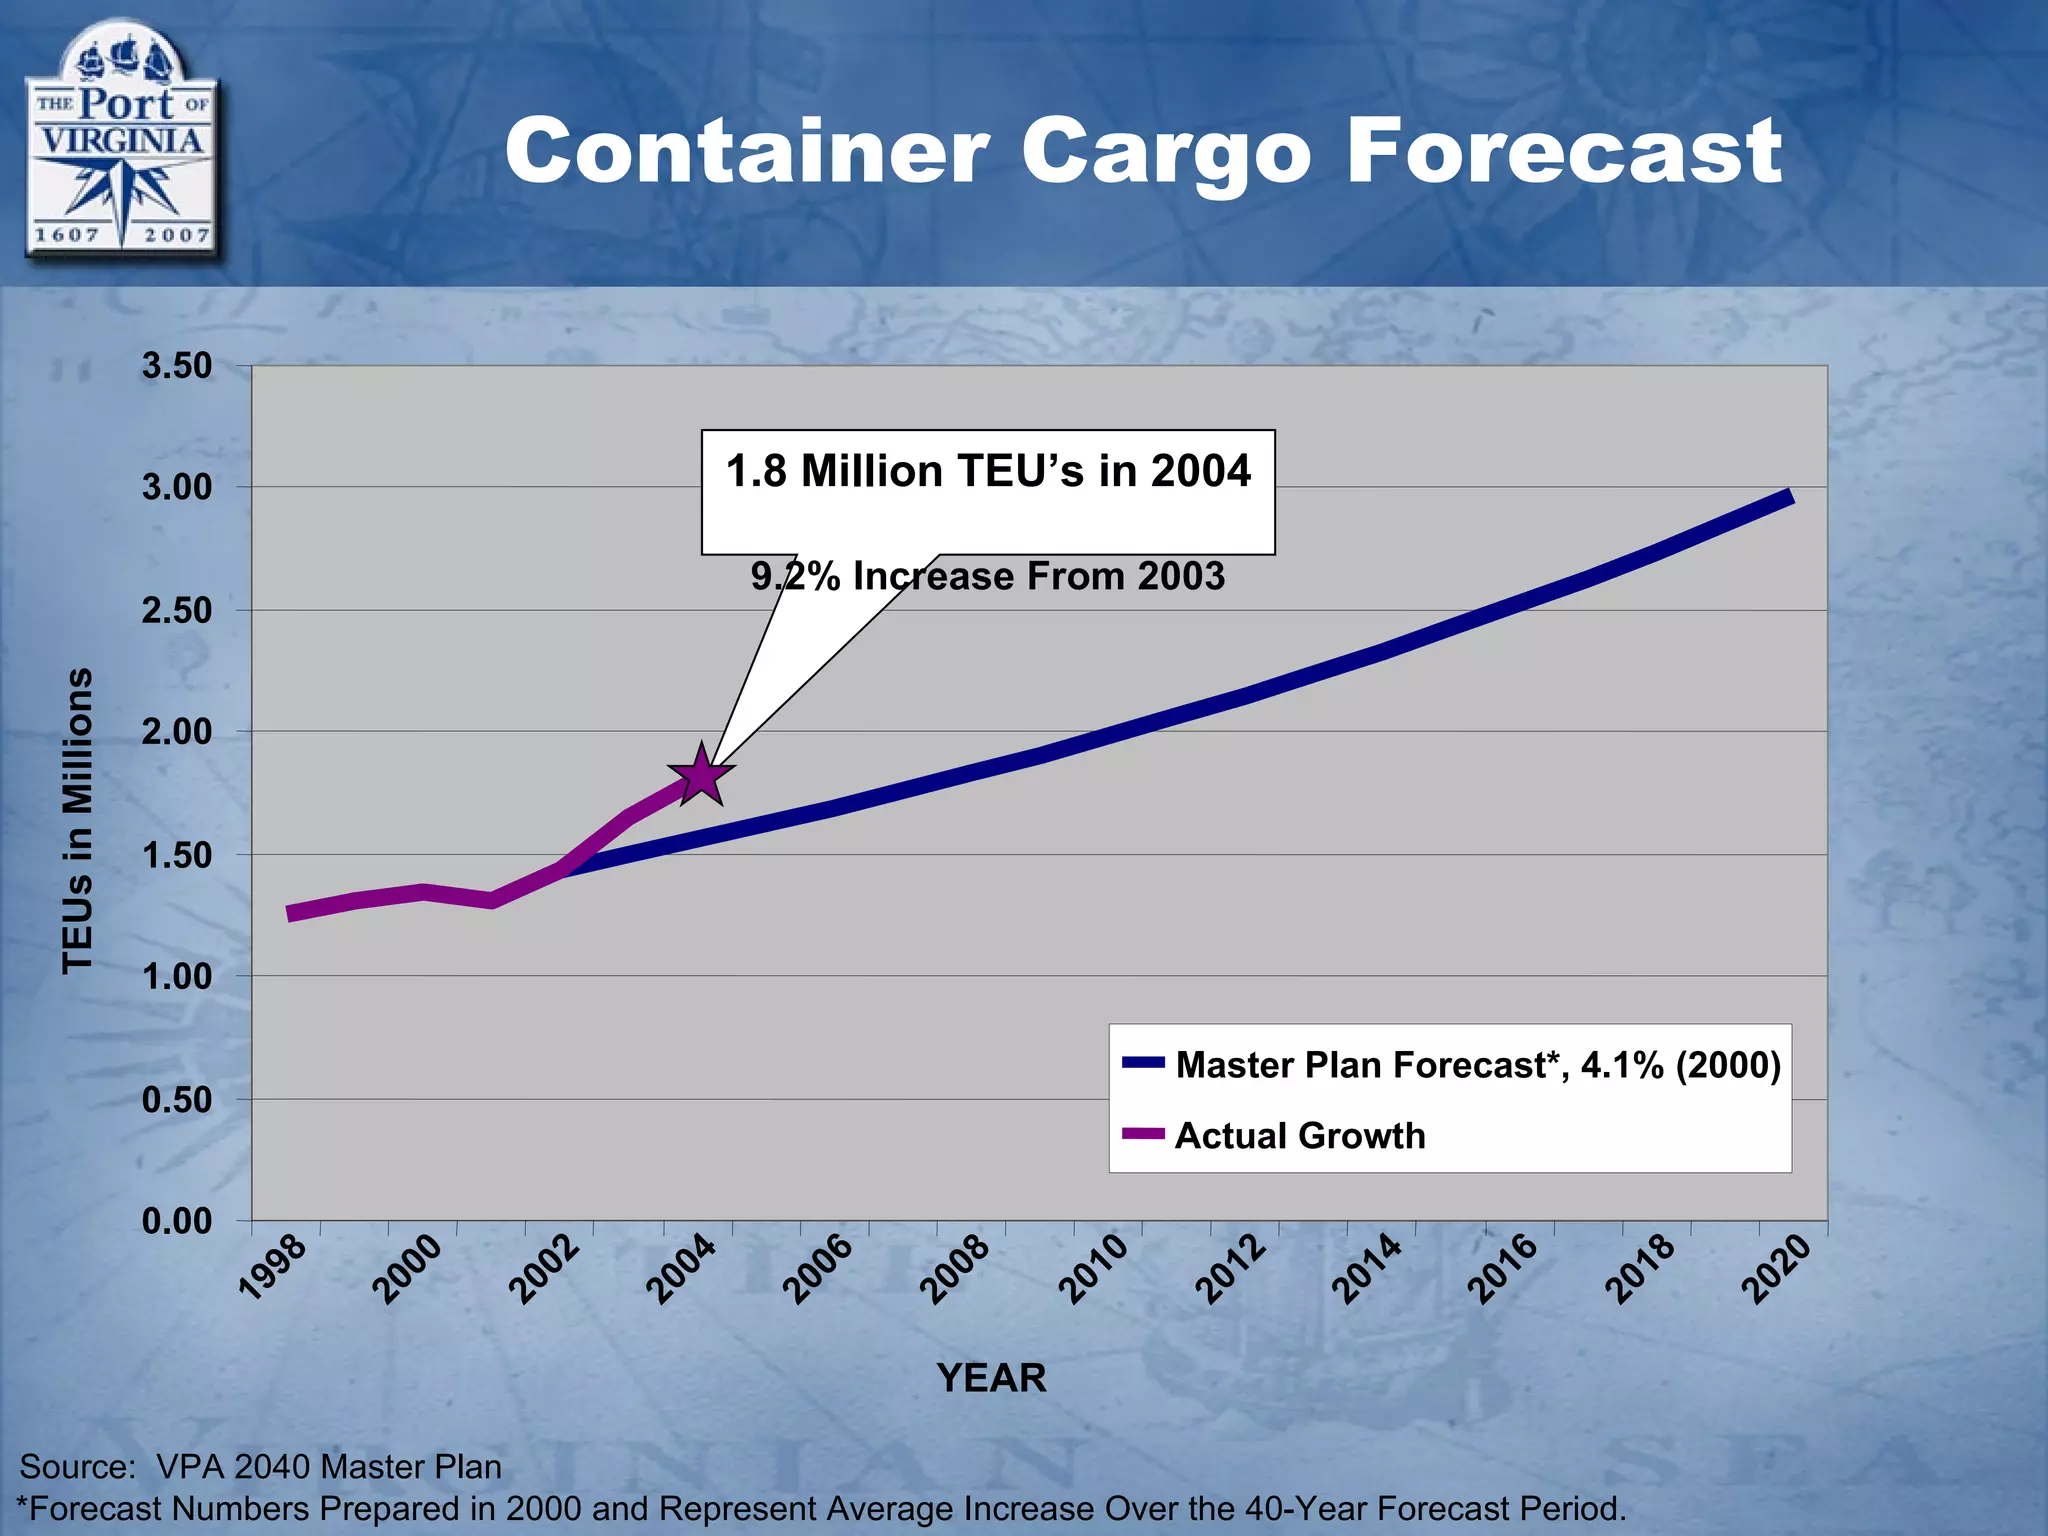
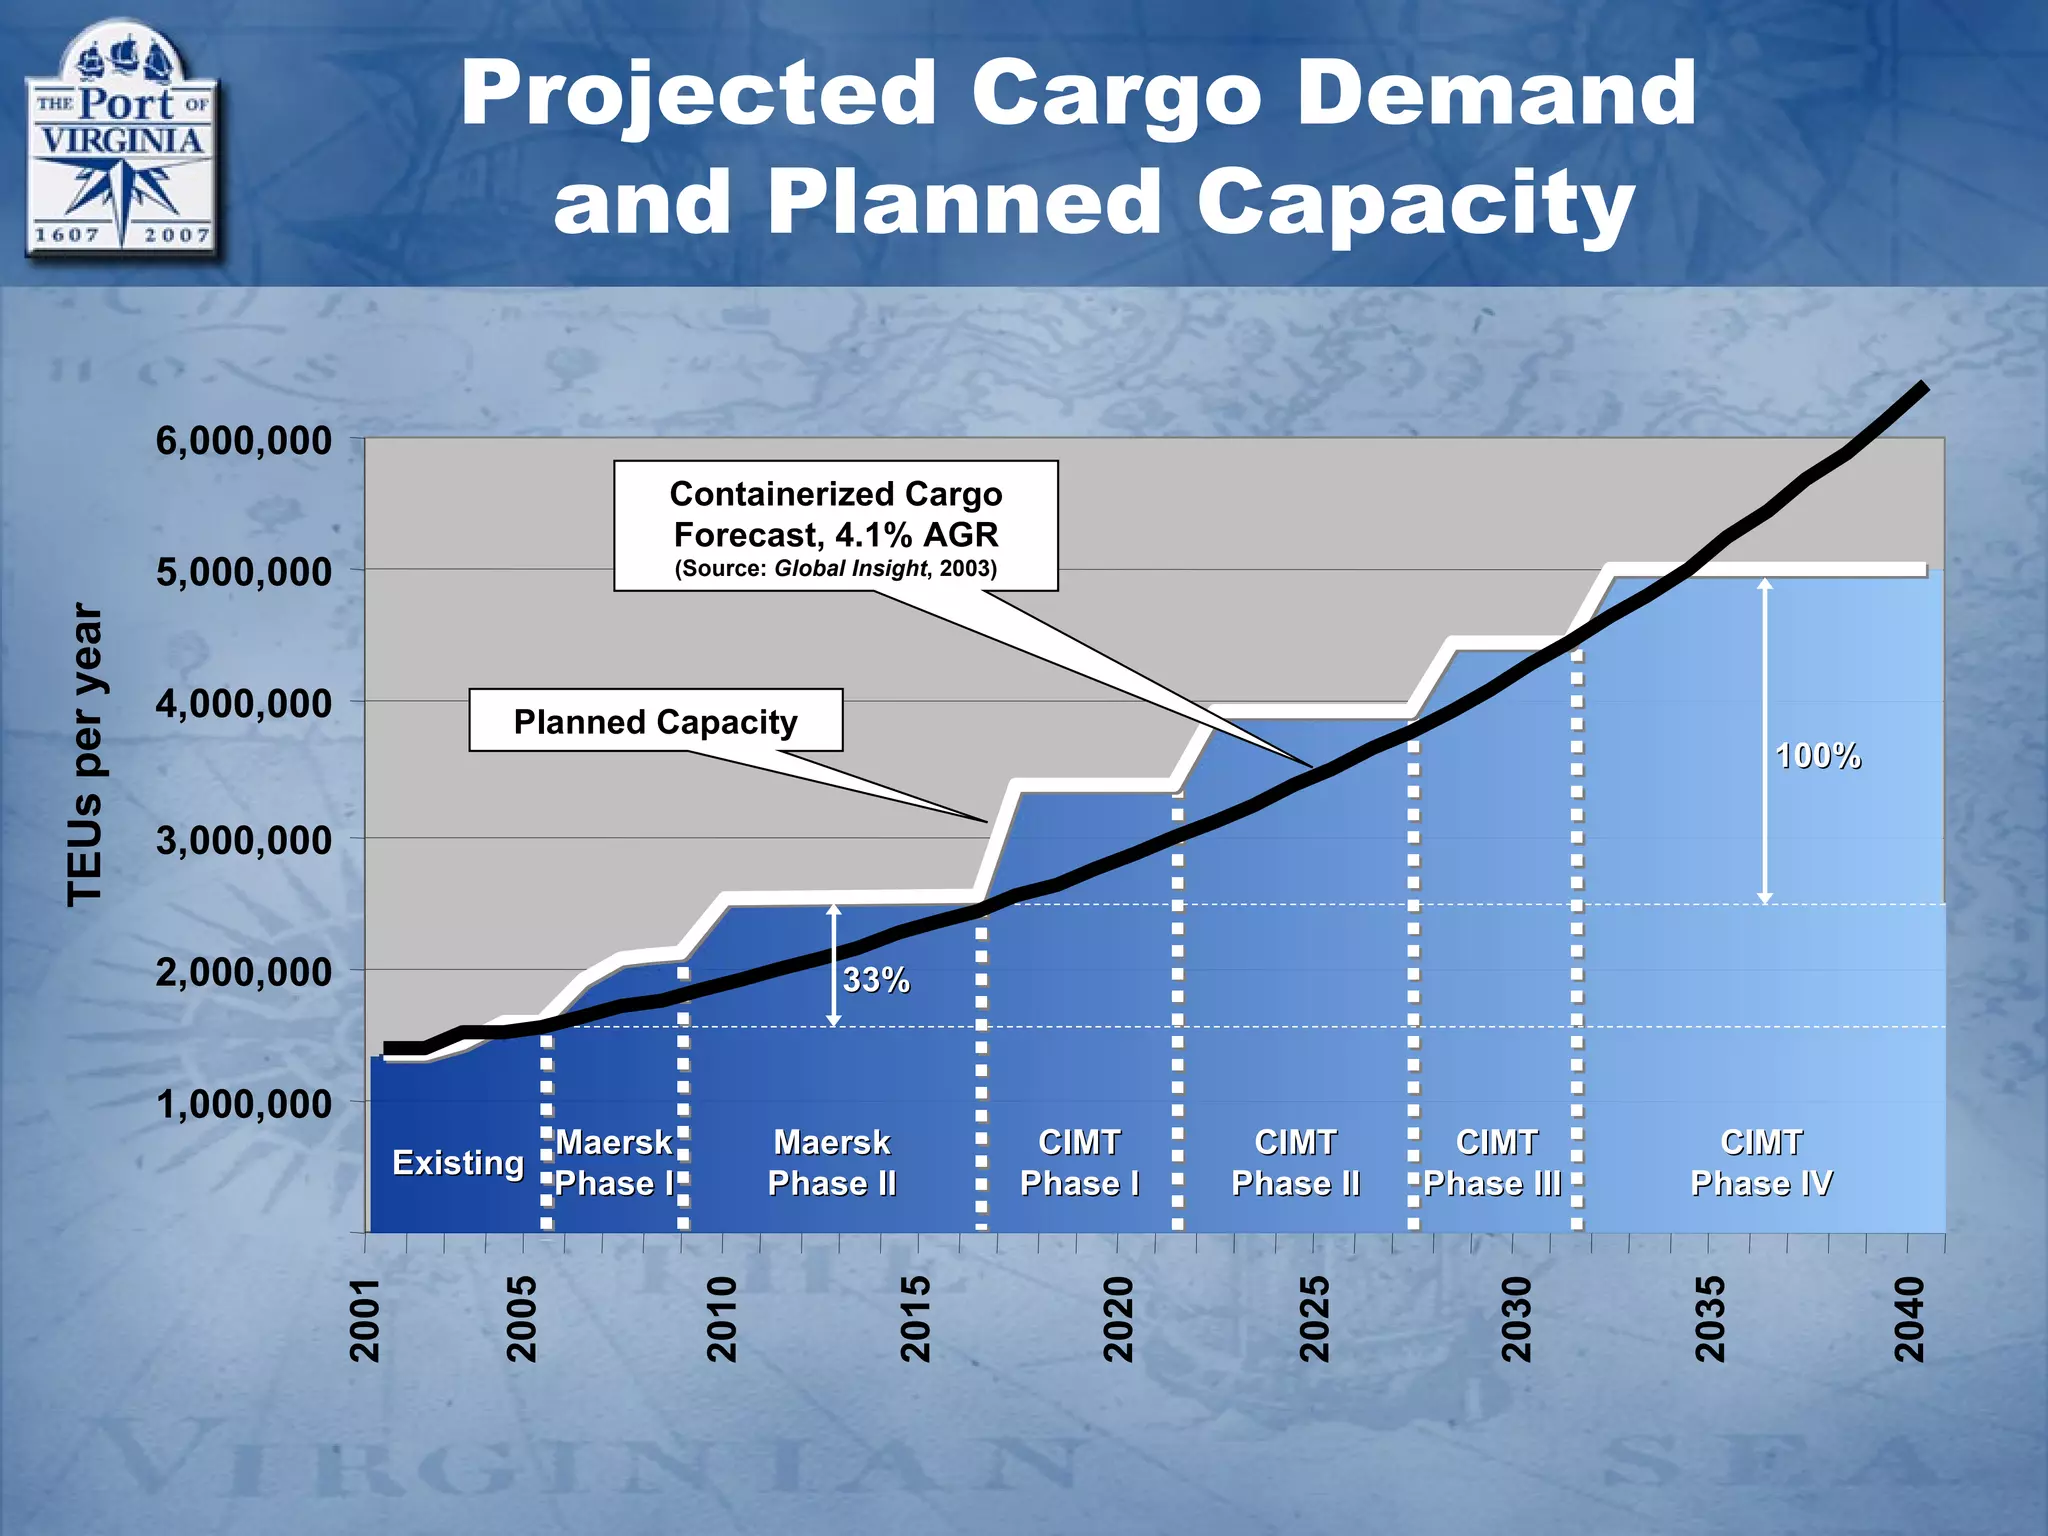
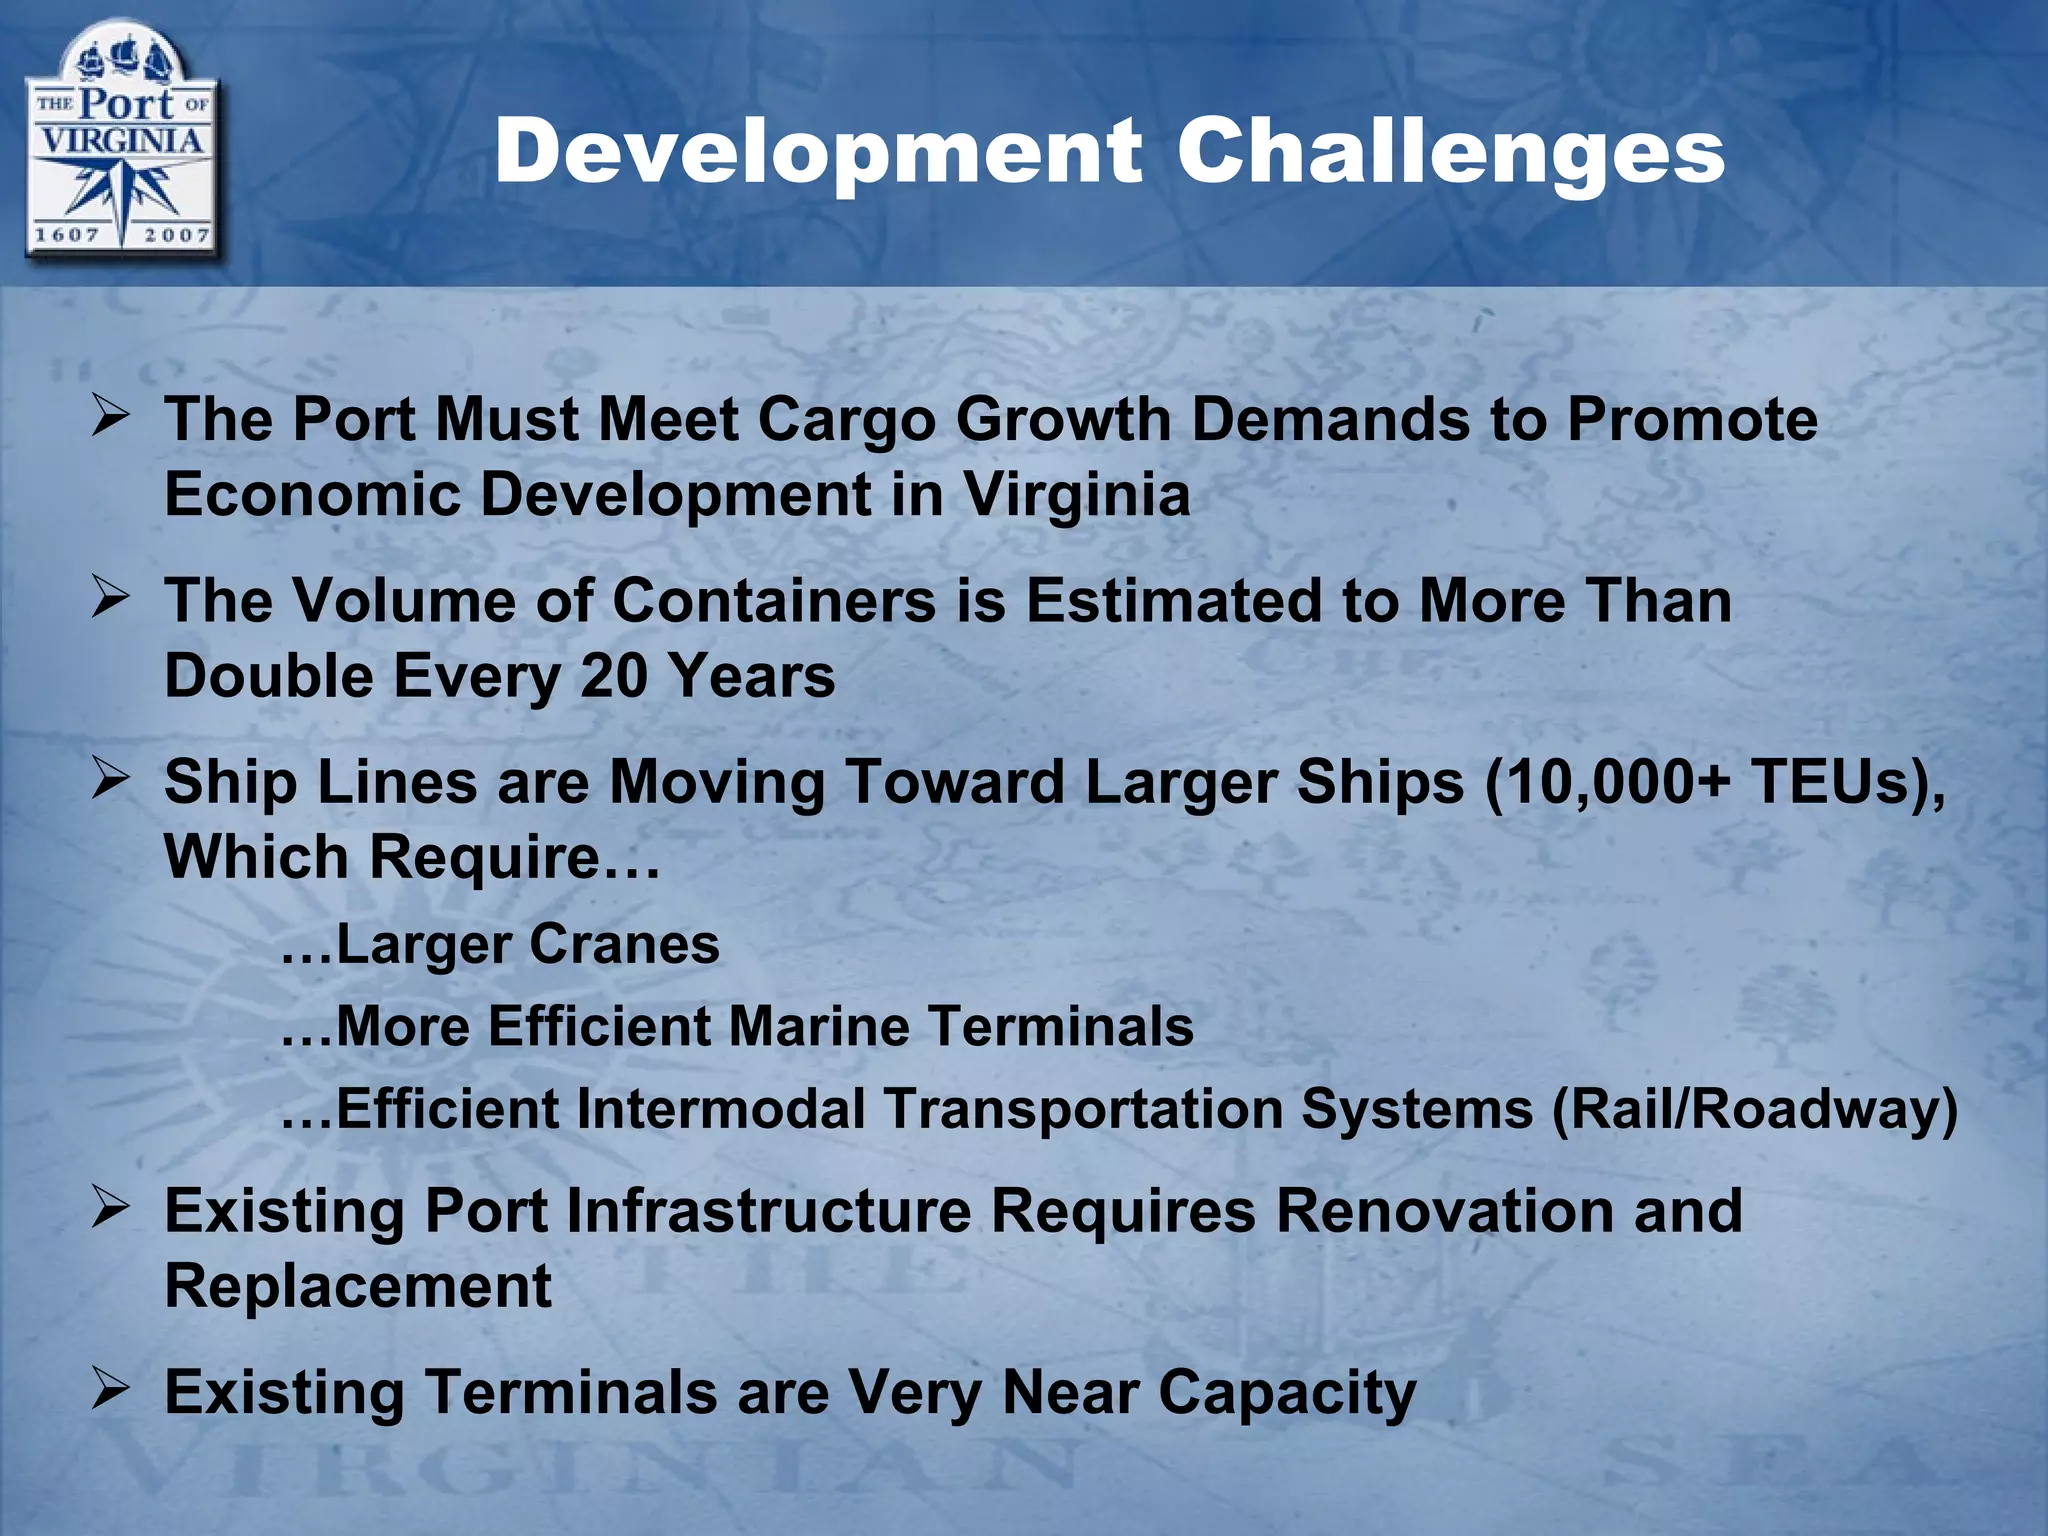
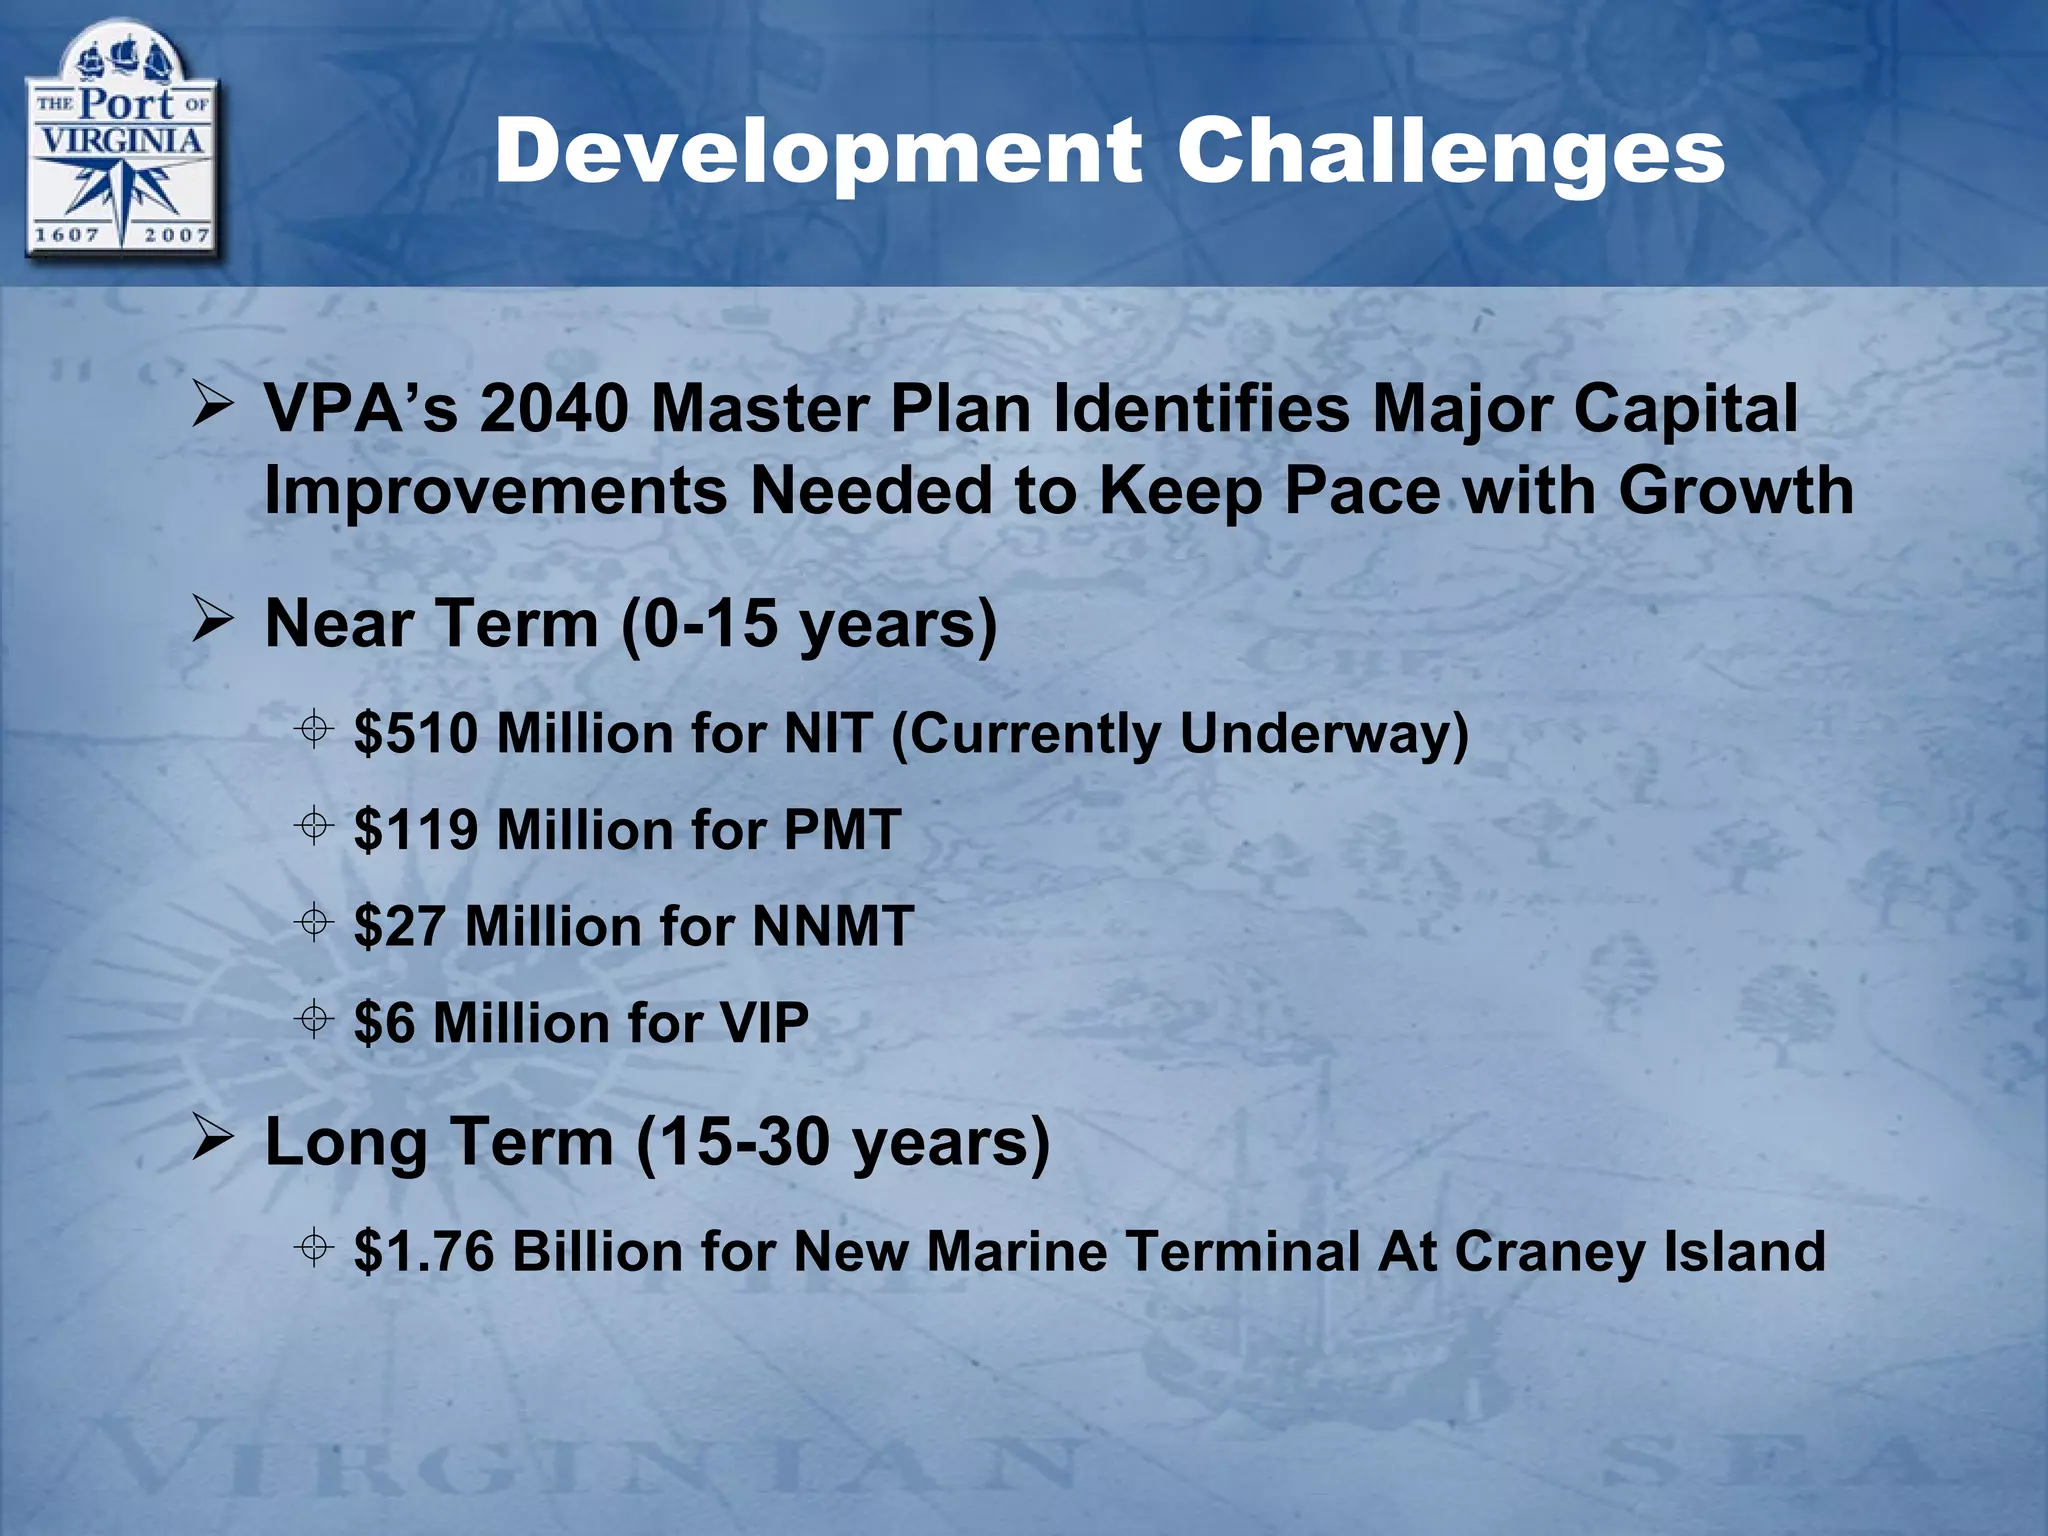
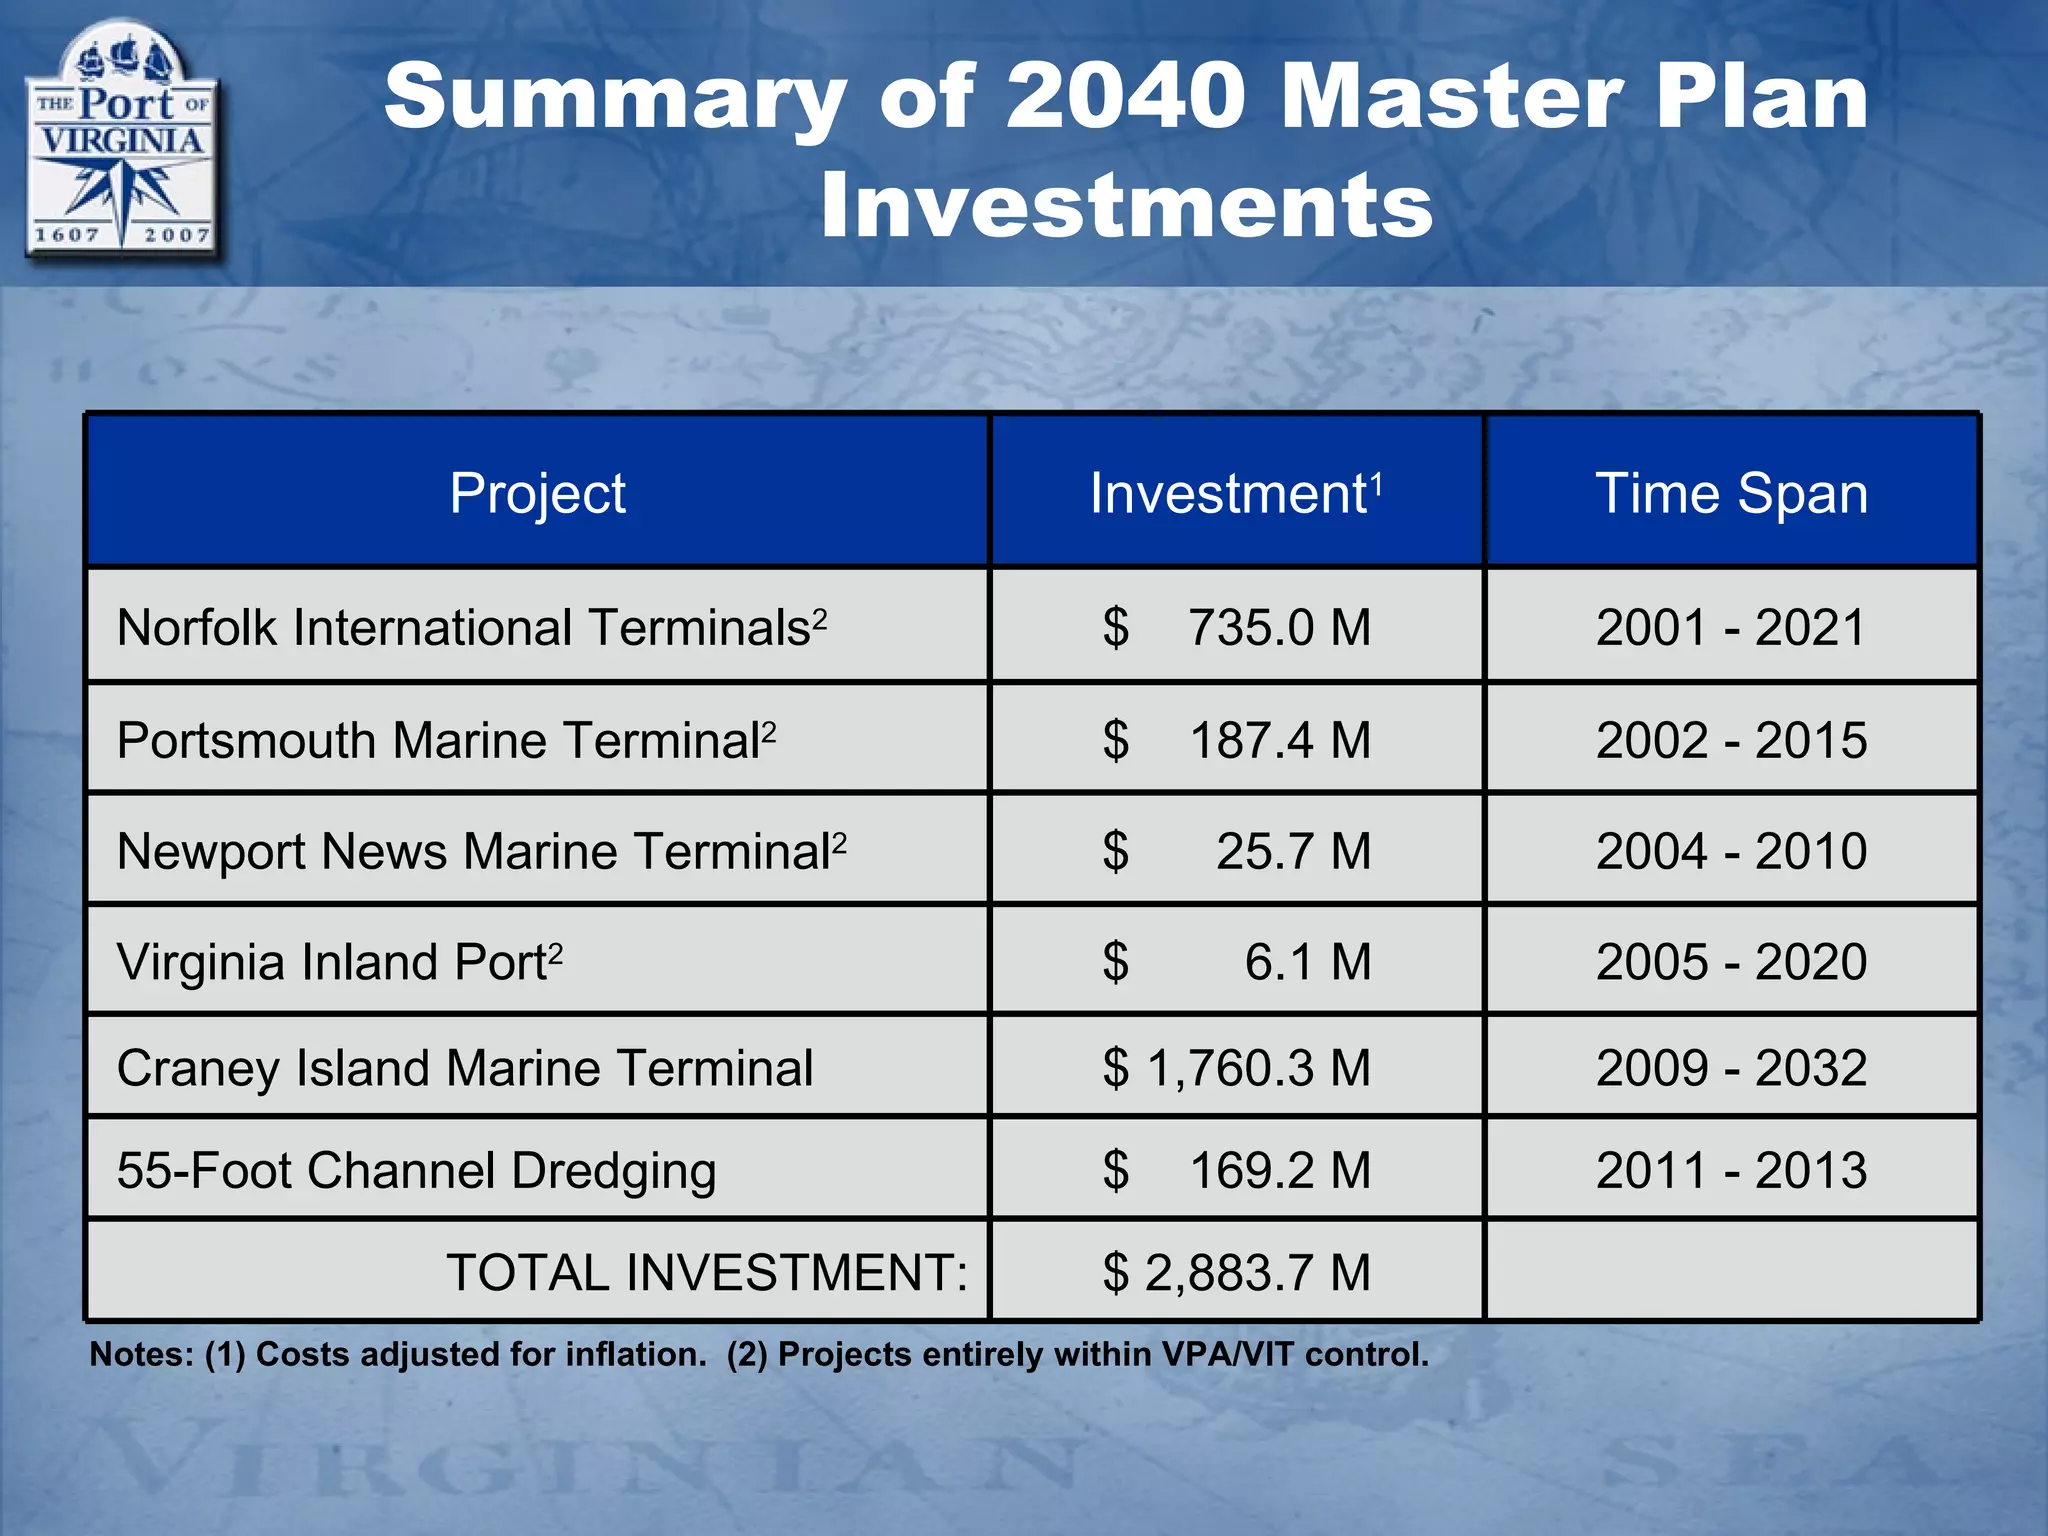
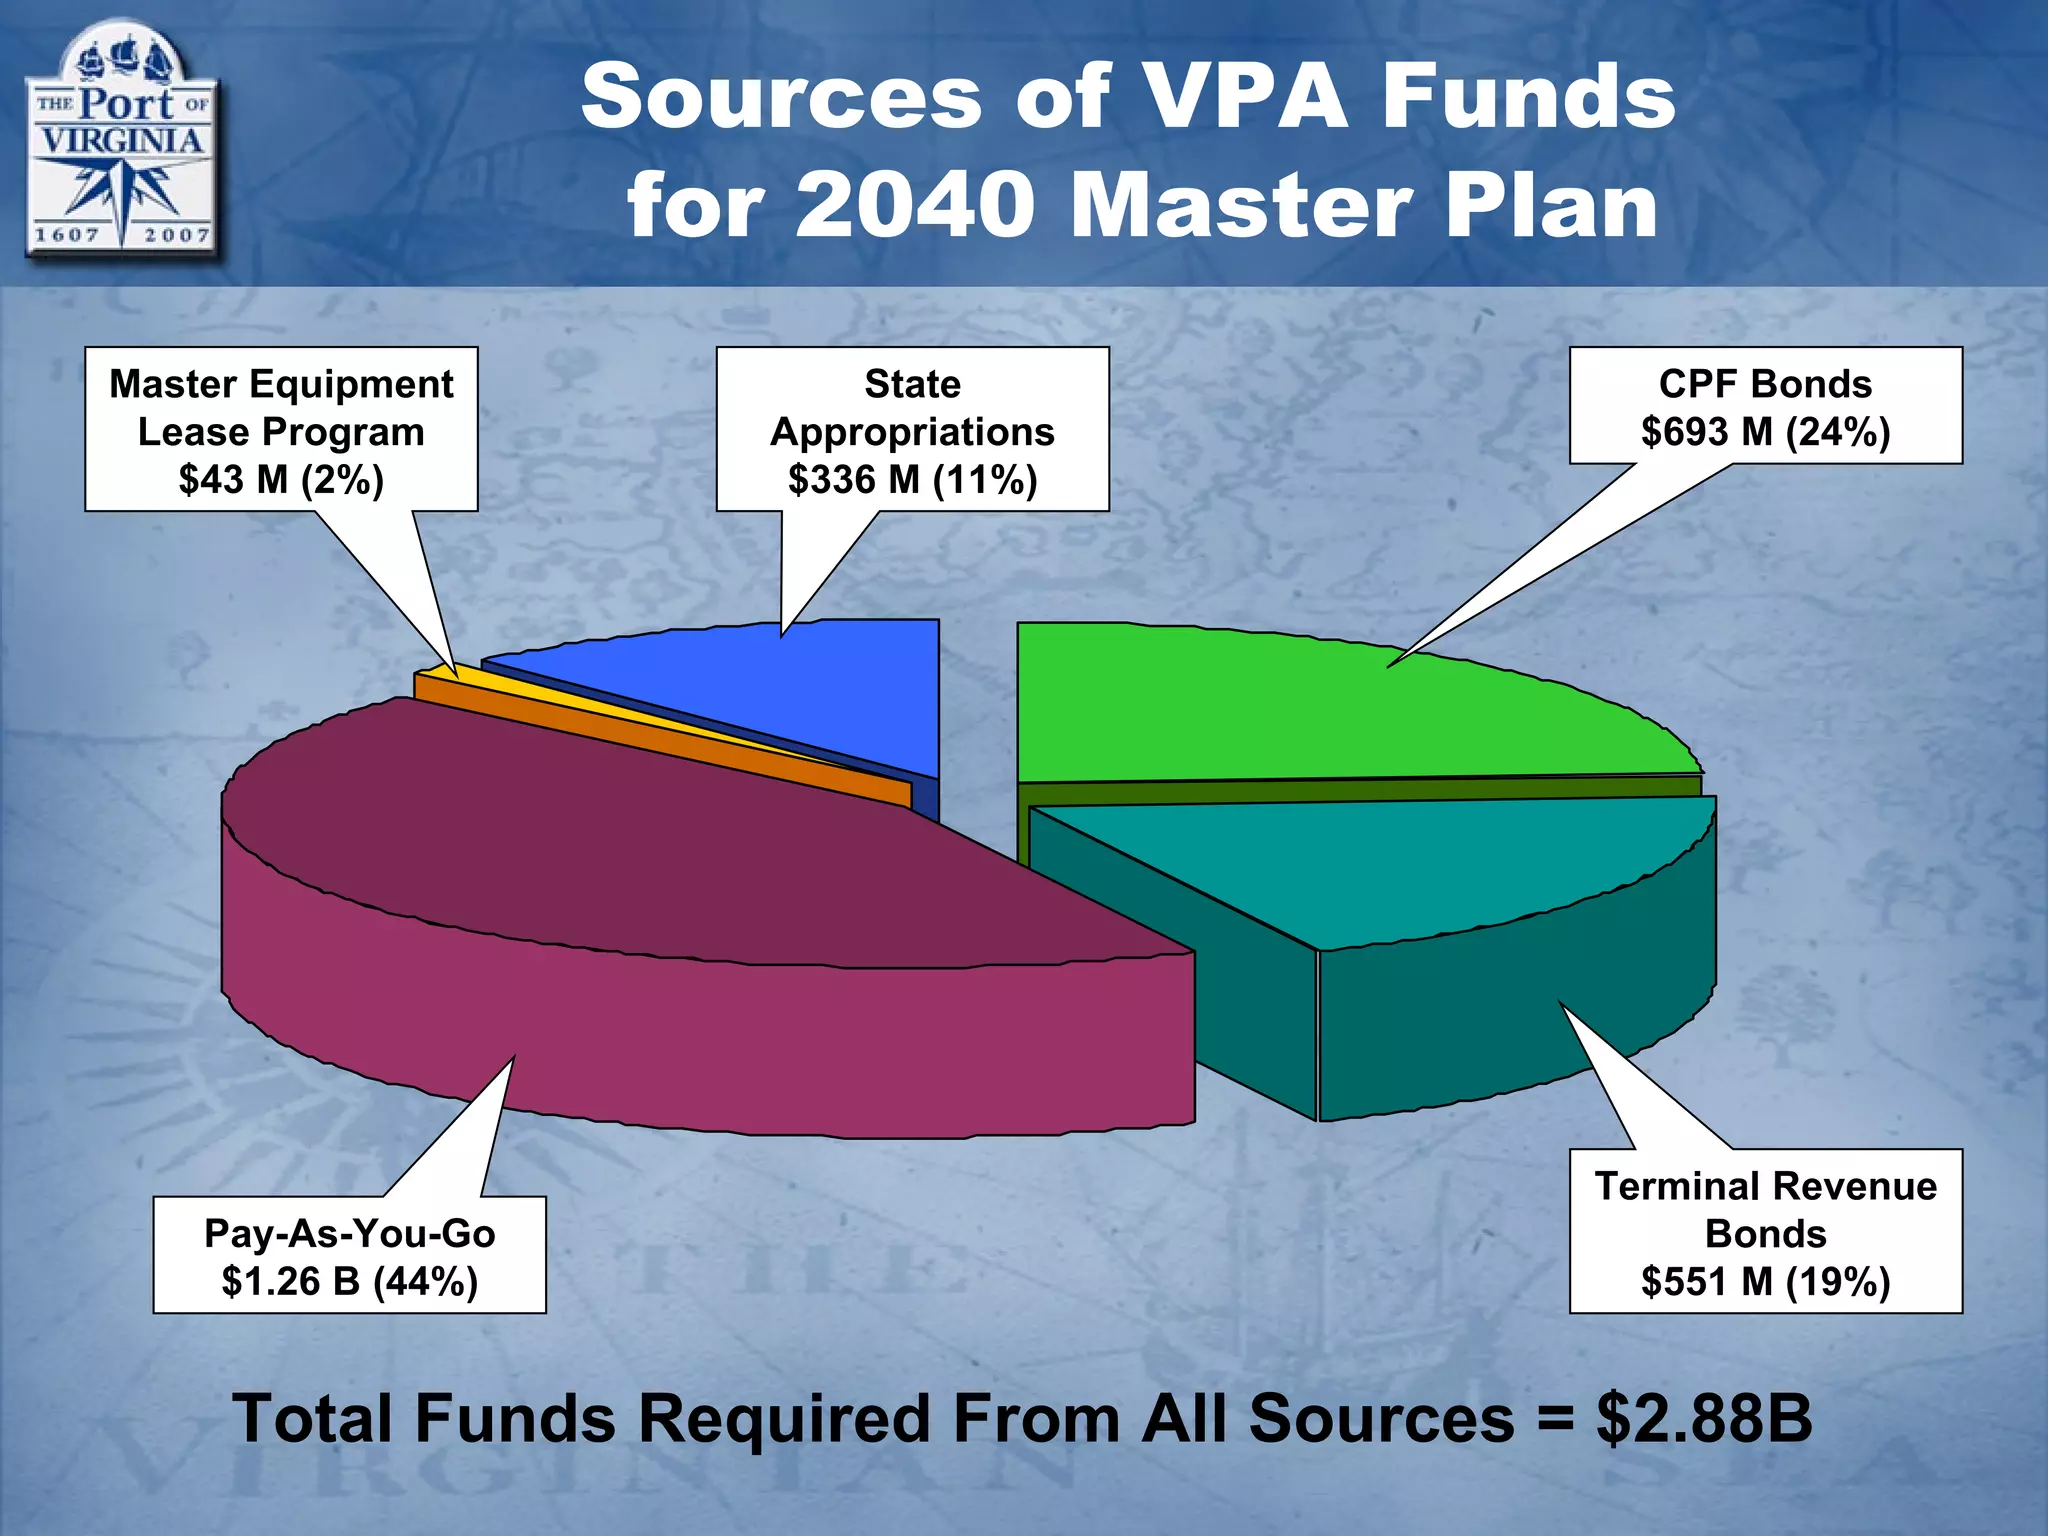
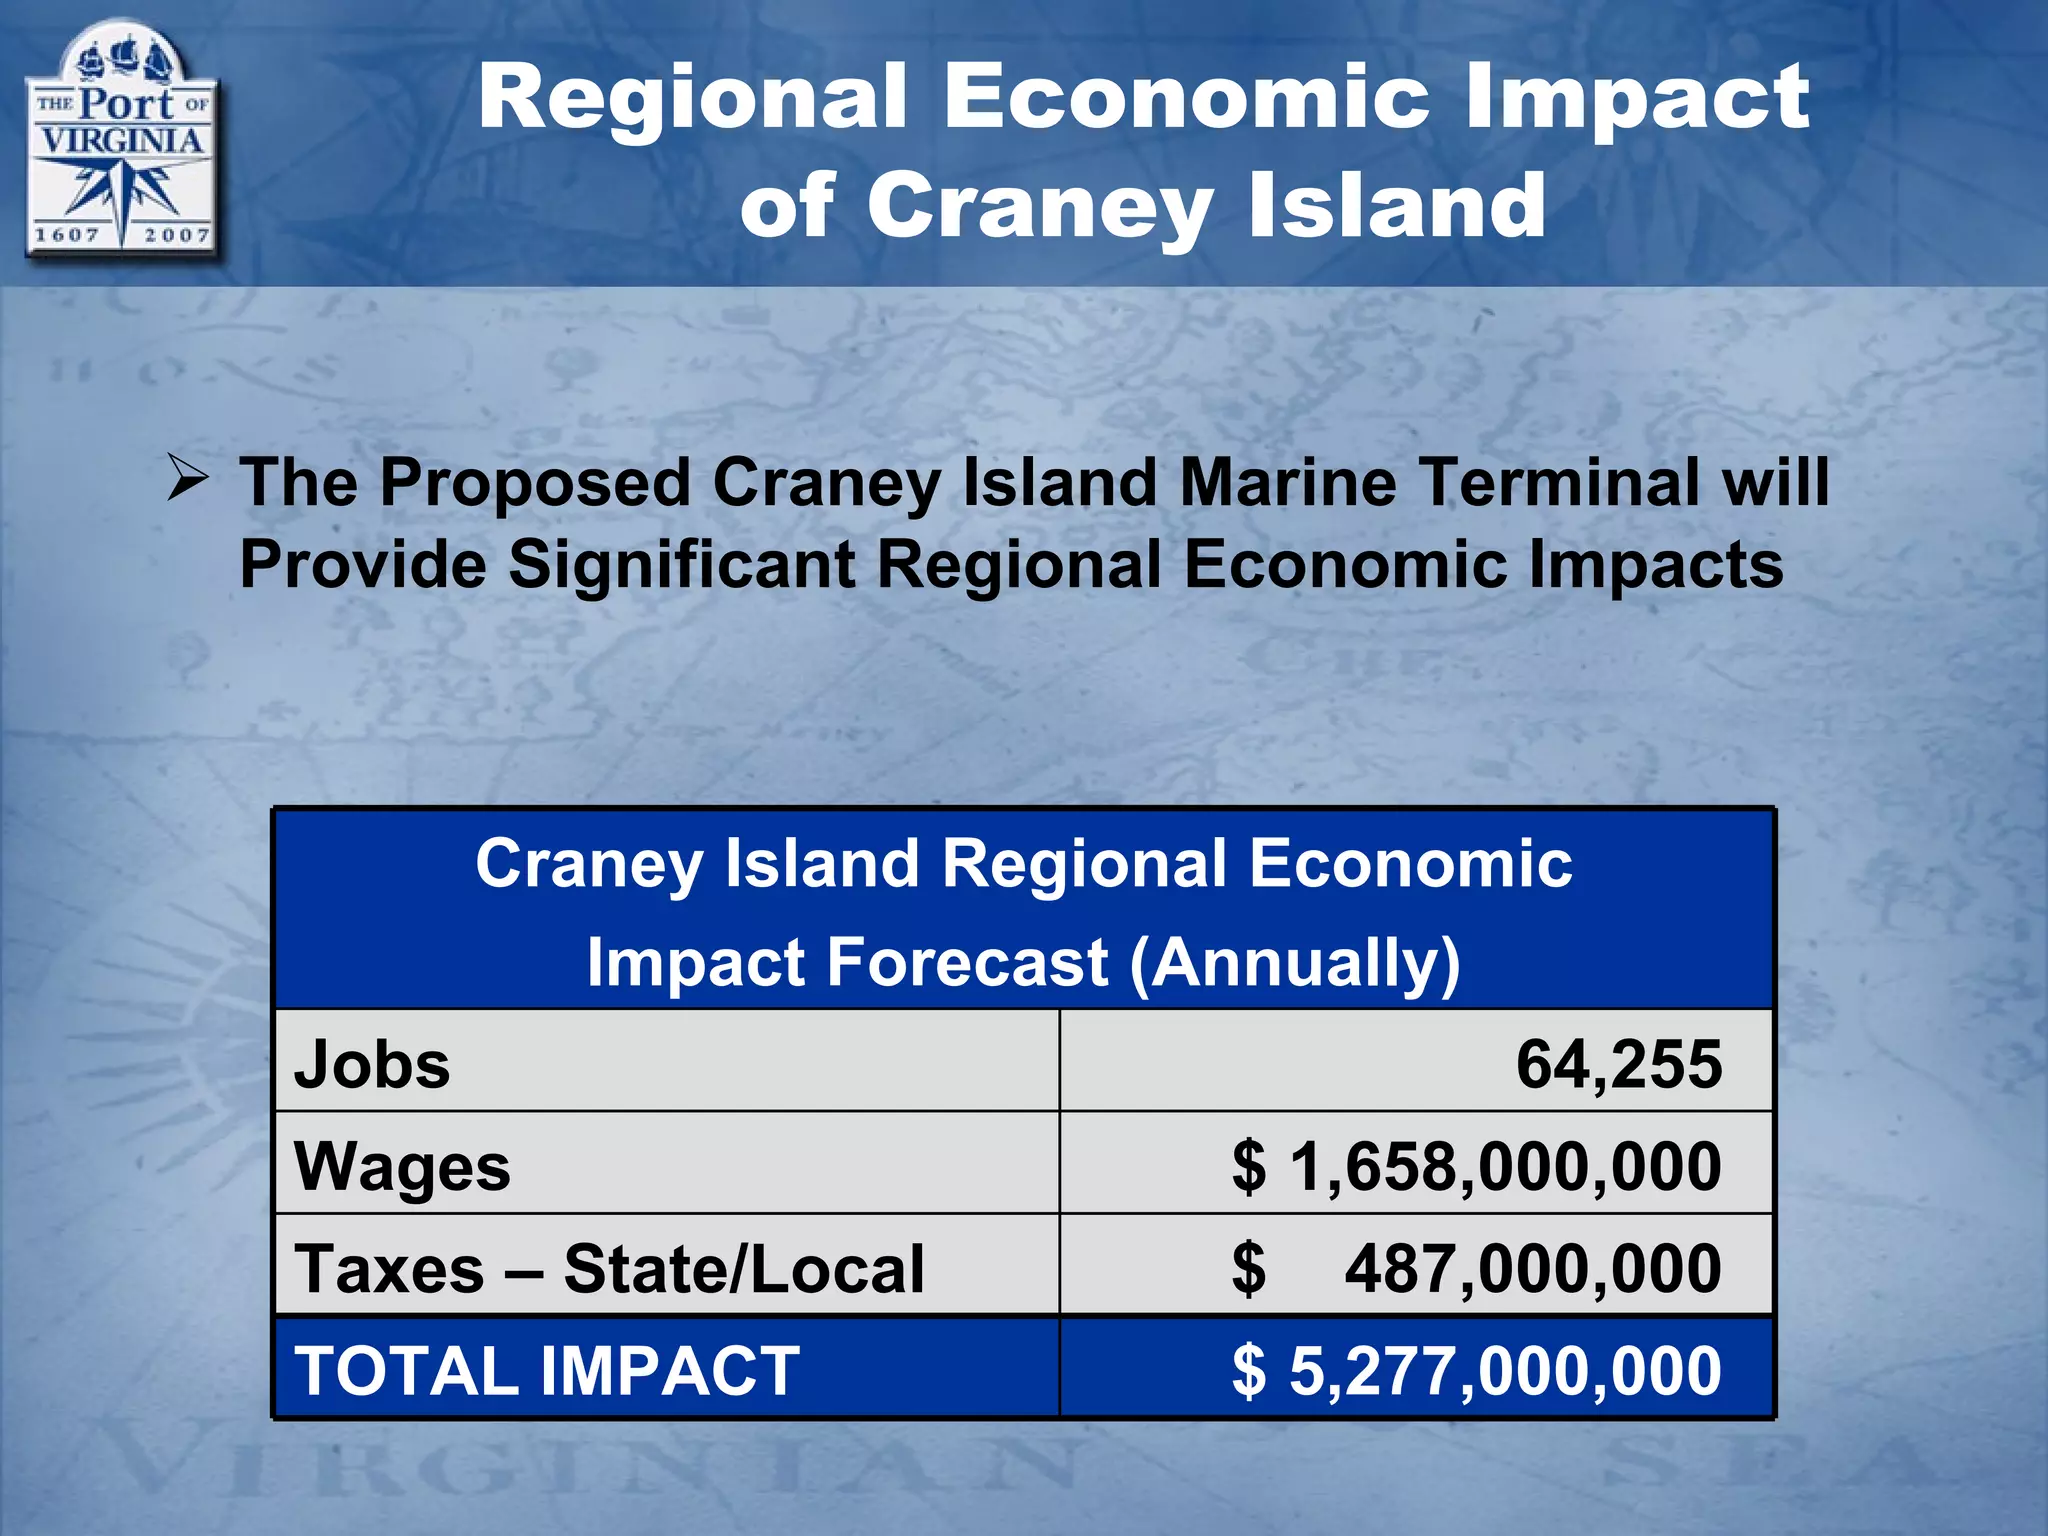
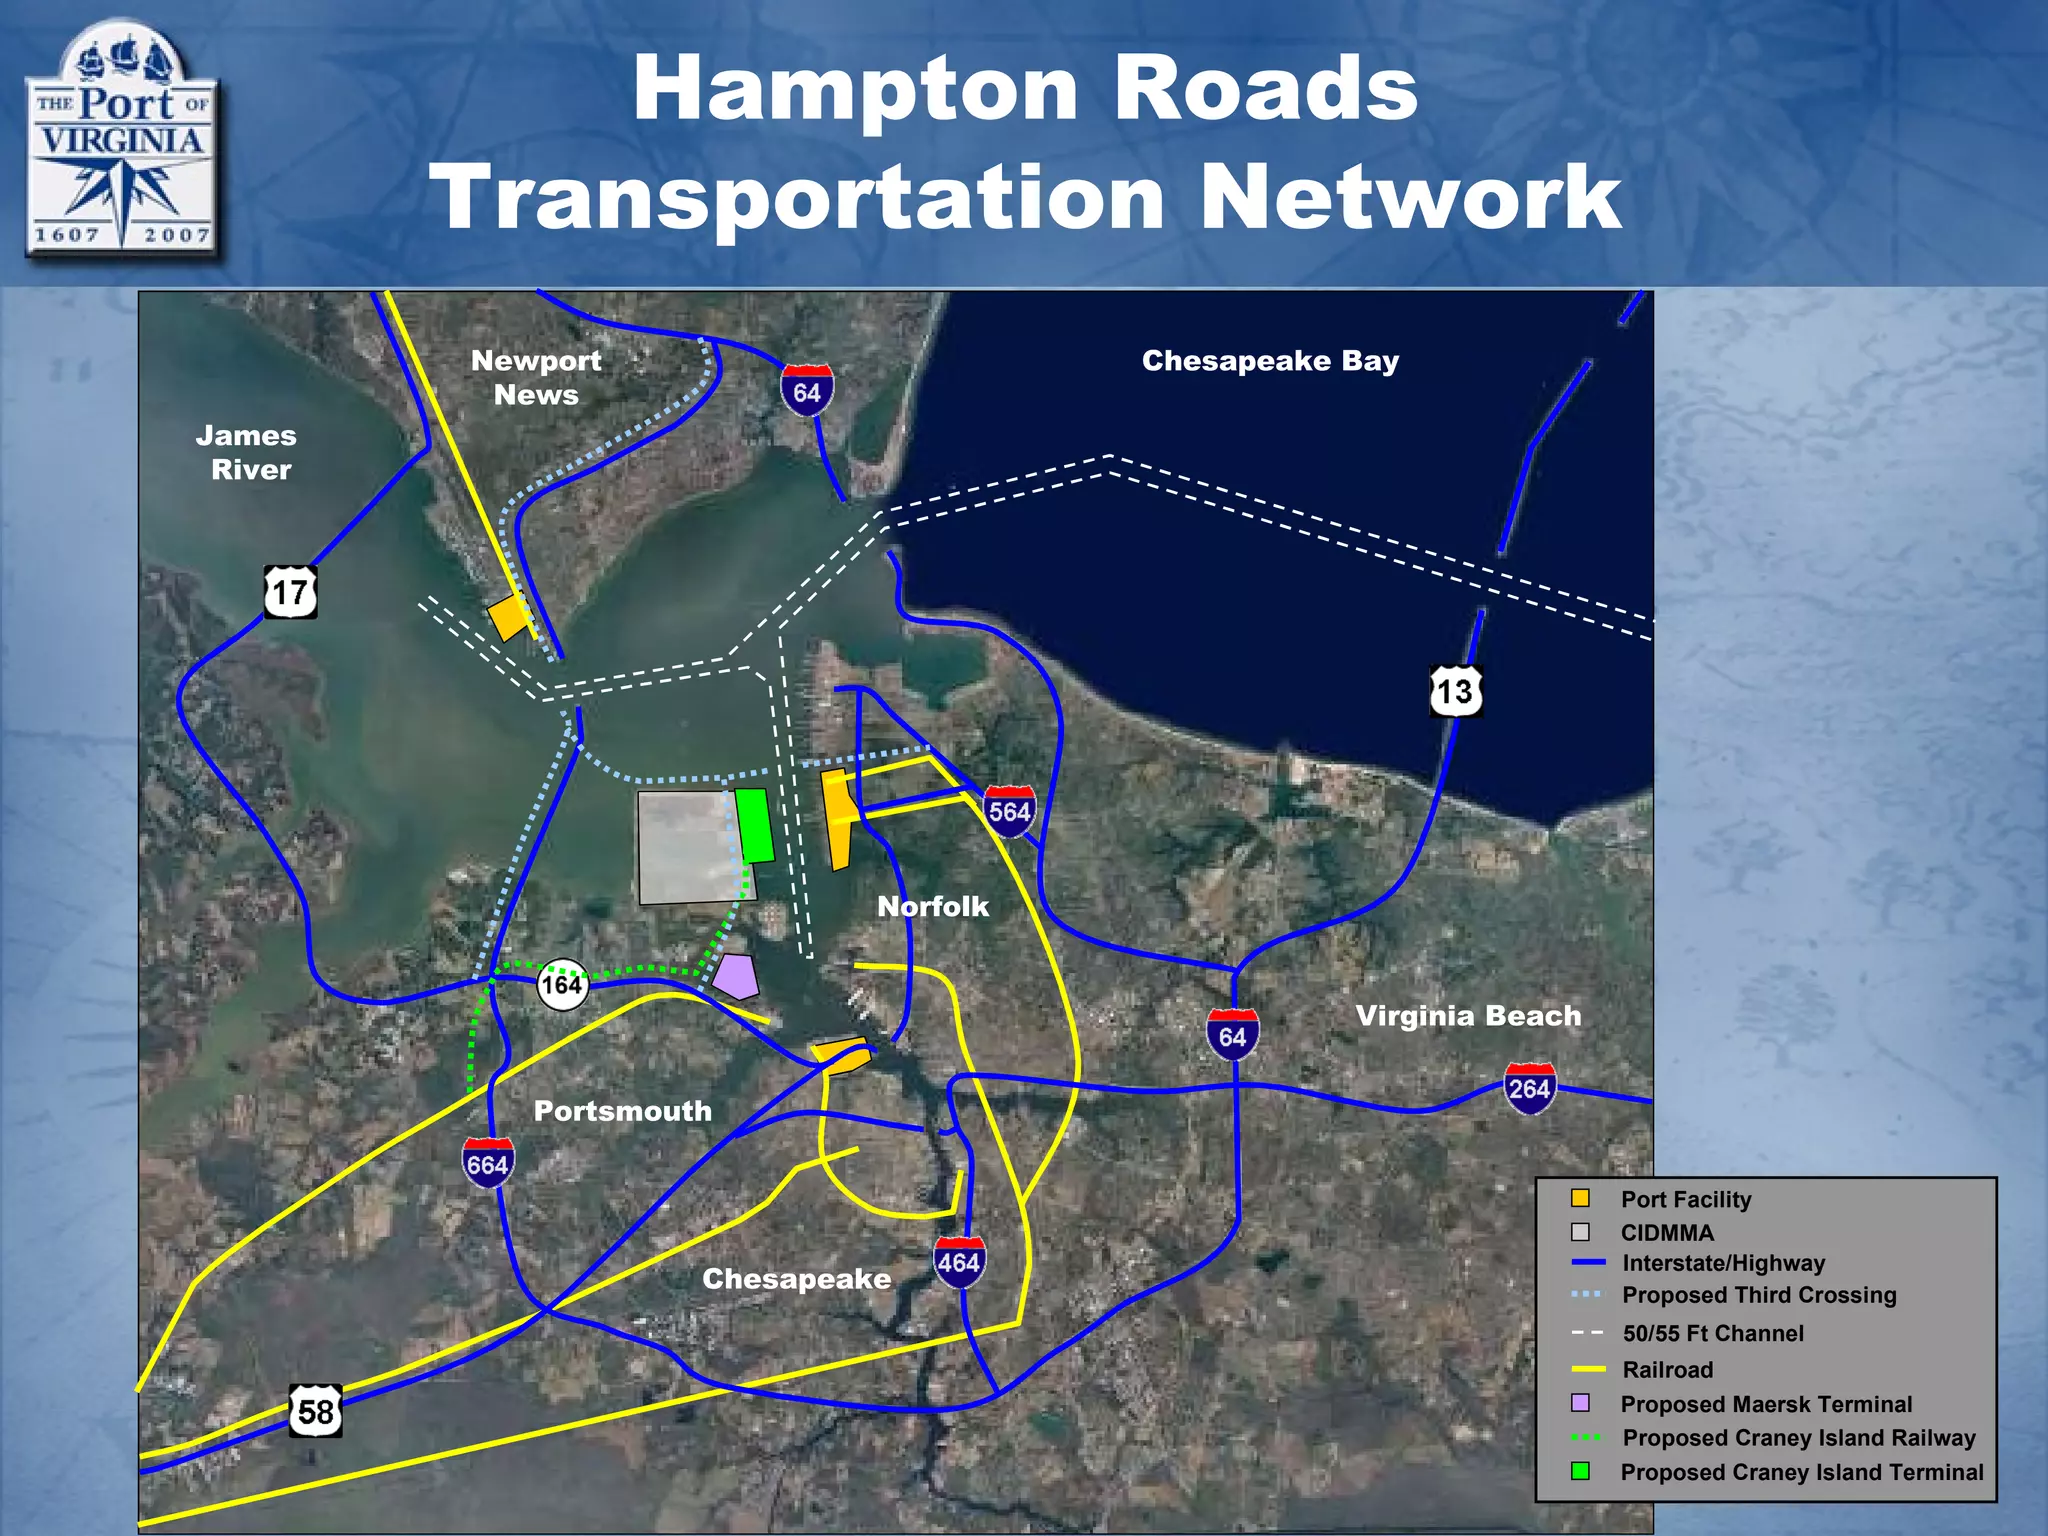
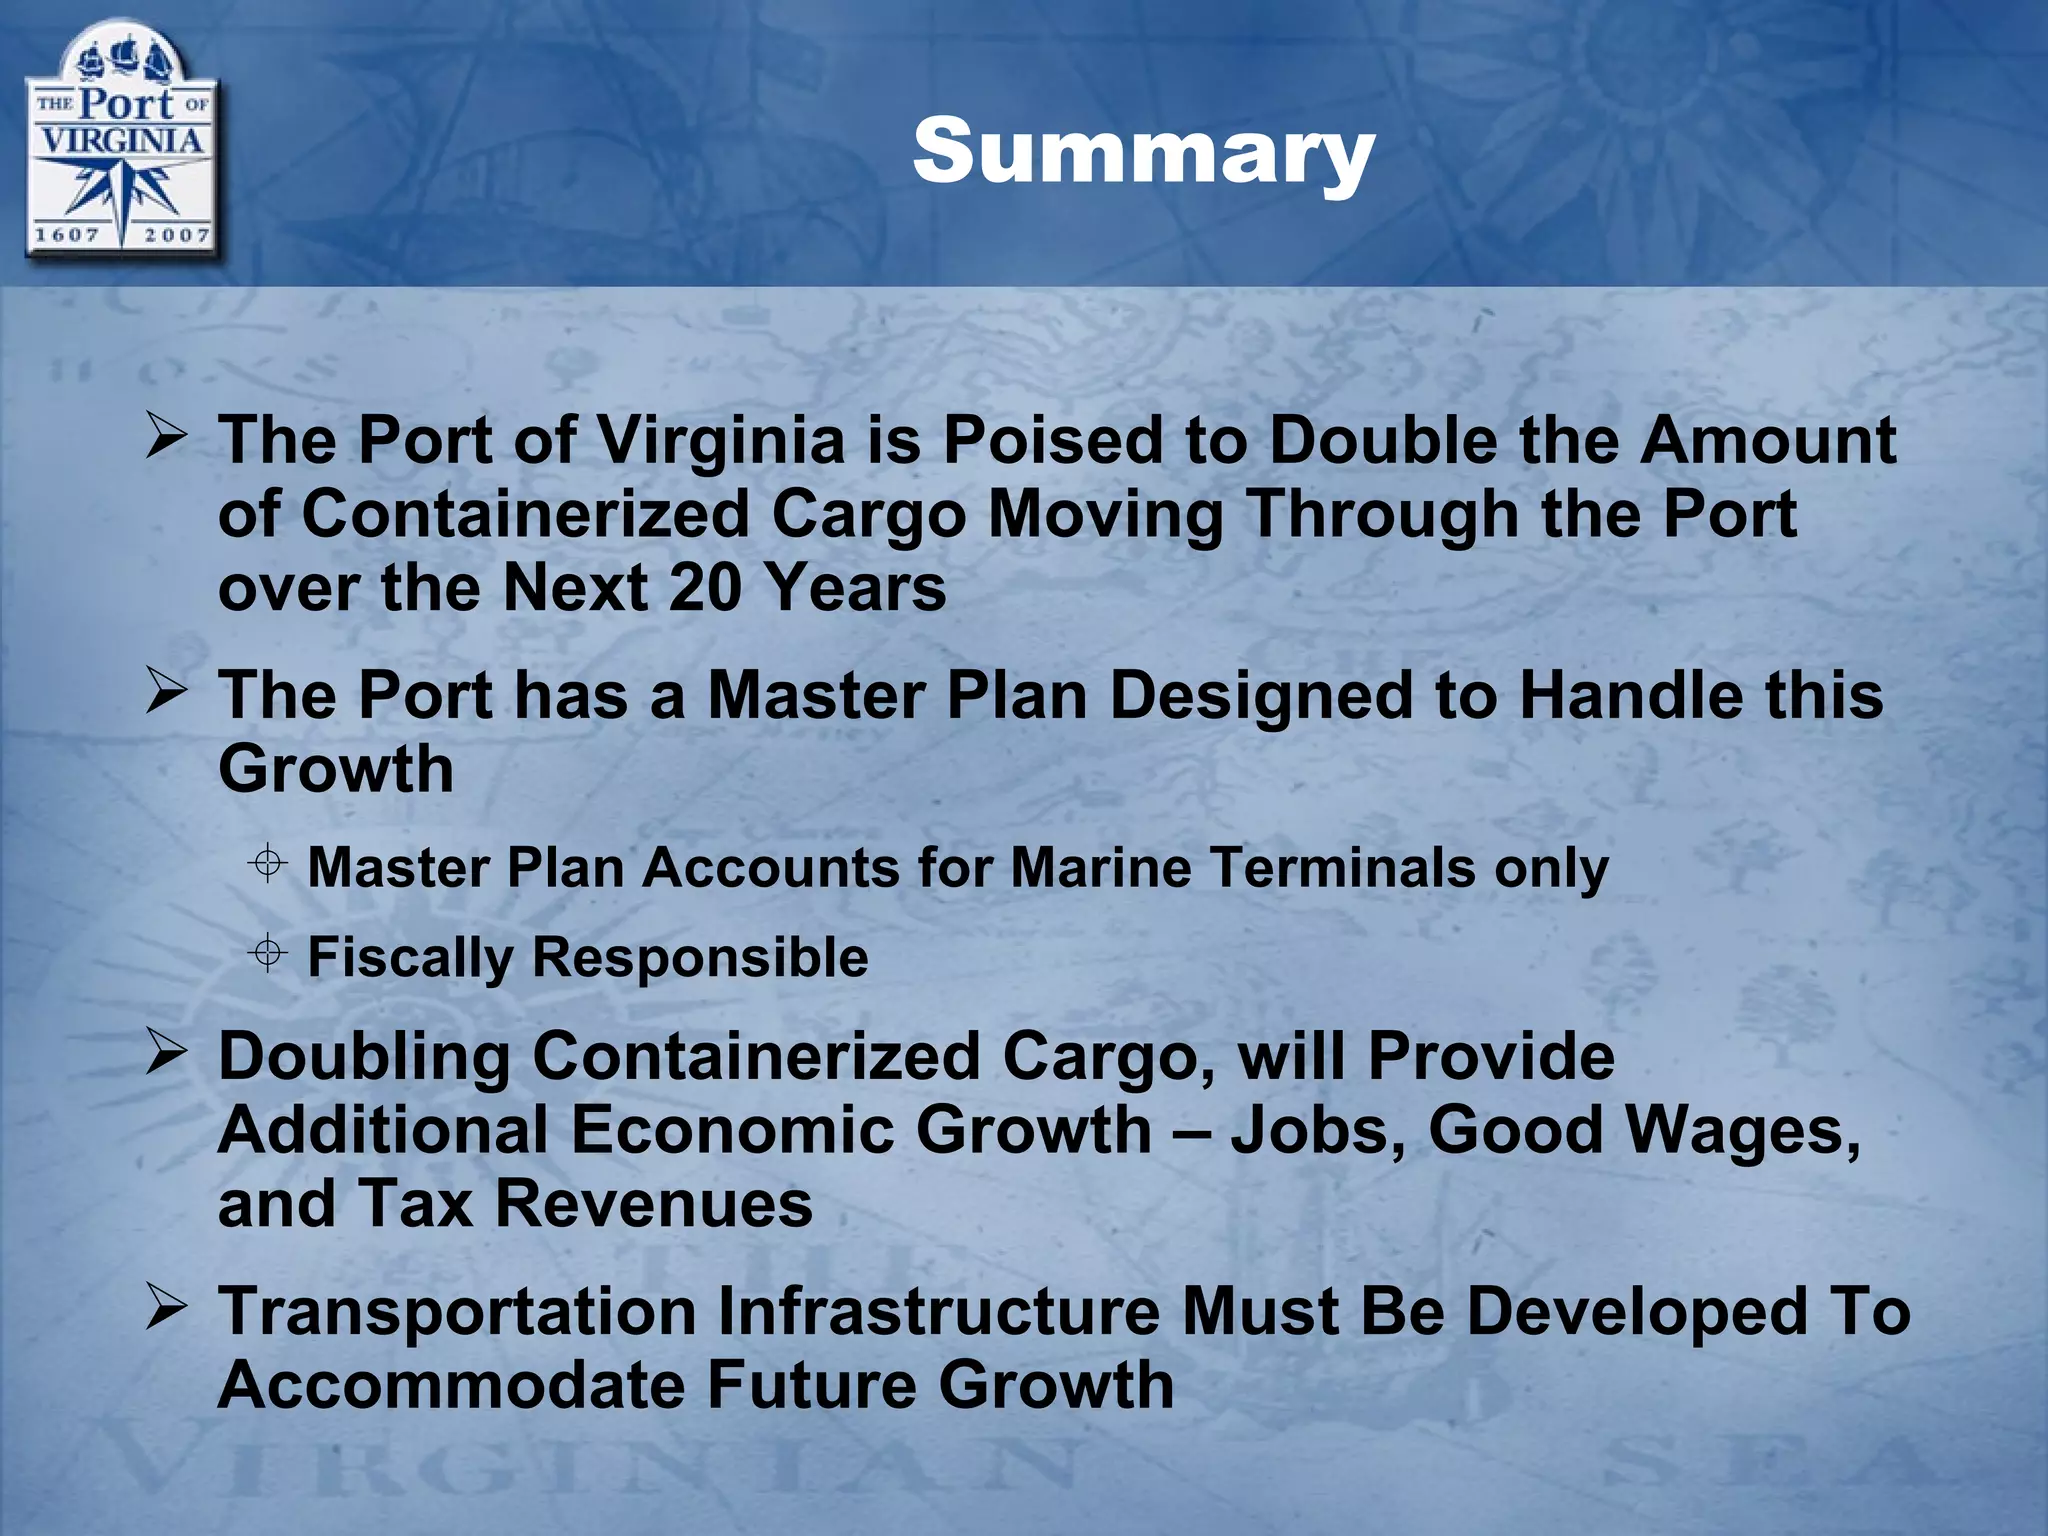
The Port of Virginia – Meeting Future Needs Today


      The Virginia Port Authority
The 2040 Master Plan and Intermodal Connectivity


                        May 9, 2005
The Port of Virginia
                  Jamestown 1607
   Godspeed
                      Discovery
  Length = 68’
                   Length = 49’ 6”
                   20 tons (1 TEU)


                     Hapag-Lloyd Columbo Express
Susan Constant      Length = 1,099’    Width = 141’
 Length = 116’              8,750 TEU Ship
The Port of Virginia

 First Ship Sails from Jamestown with Export
  Cargo
   Year is 1607
   No Dredging Required
   No Highway Required
   No Railroad Required
   Small Landside Facilities Required (Wooden
    Pier)
 Low Financial Investment
 By 1630 Tobacco Exports to Europe
   1,500,000 lbs = 750 Tons = 50 TEUs!
Fast Forward 400 Years


 2004 The Port of Virginia Handled 1,810,000 TEUs
 2003 First 8,000 TEU Vessel Sets Sail
 Require Considerable Dredging
 Require Major Interstate Highways
 Require Major Railroads
 Require Considerable Port Infrastructure
Agenda


 The Port of Virginia
 Ports 101
 The VPA 2040 Master Plan
 Summary
The Port of Virginia

 The Virginia Port Authority (VPA)
   An Agency of the Commonwealth
   Fosters and Stimulates the Commerce of the
    Commonwealth
   Engages in Promoting, Developing, Constructing,
    Equipping, Maintaining and Operating the Harbors
    and Seaports Within the Jurisdiction of the
    Commonwealth

 Virginia International Terminals (VIT)
   A Virginia Non-Stock, Non-Profit Operating Affiliate of
    the Virginia Port Authority
   Operates the Terminals Owned by the Commonwealth
Economic Impact of The Port


          1999 Economic Impact Study*
               165,000 Port and Port-Related Jobs
               $762.5 Million in Business Revenues
               $60.7 Million in State and Local Taxes

          2003 Bureau of Economic Statistics Report
               The Port Plays a Part in Over 180,000 Jobs
               Salary and Wages in Excess of $5 Billion


*Source: Martin Associates
Distribution of Ship Calls
                        at The Port of Virginia
        More Than 75 Steamship Lines Serve the Port
        Sailings to Over 250 Ports in 100 Overseas Locations

   The Port of Virginia is within a
    1-day drive of over 2/3 of the
    U.S. population and 301,000
        manufacturing firms


                                                           780
                          The Port
                         of Virginia                       468                    832
                                                                            364
                            780                     208


                                       260      The Port of Virginia is within
                                               750 miles of 60% of the nation’s
                                                 total personal income and
                                                                                        52
                                                   consumer expenditures

*Many services call more than one tradelane.
U.S. National Gateways
  Vancouver, BC

                    90% of Containerized
Seattle/Tacoma
                  Trade Moves Through 10
                    North American Port
                         Gateways


                                                                               New York/
                                                                               New Jersey
  Oakland
                                           The Port of Virginia is the
                                             7th Largest Gateway


  Los Angeles/
  Long Beach
                                                                           Charleston
                                                                         Savannah


                                           Houston                         Miami
U.S. Cargo Trends


 44% of U.S. Import Cargo Comes into the Port of
  Los Angeles/Long Beach
       Transported to Mid-West via Rail and Truck
 West Coast Port Congestion Has Diverted Cargo
  to East Coast Ports via All-Water Route
 VPA Experienced Major Growth in Asia Trade
  Lanes in 2004
       SE Asia         19.6%
       NE Asia         22.8%
VPA Containerized Trade
                                           by Region

       450,000
                                                                                                              Percentage Share of Total
       400,000            30.1%

       350,000                                                        27.3%
TEUs


       300,000

       250,000

       200,000

       150,000                                                                            11.1%
                                                                                                                                        10.0%
       100,000                        6.4%                                        5.8%
        50,000   3.1%                                                                             3.9%

                                                0.3%     0.6%                                                  0.2%          1.0%


                                                                                                                                         S AMERICA
                                                                       N EUROPE
                                                          C AMERICA


                                                                                  INDIA


                                                                                           MED


                                                                                                                              OCEANIA
                 AFRICA


                           NE ASIA


                                      SE ASIA


                                                 CARIB


                                                                                                                 N AMERICA
Source: PIERS Trade Data, 2004                                                                     MID EAST
The Intermodal Gateway

 The 1.81 Million TEUs
  Exported/Imported From
  the Port of Virginia in 2004
  Were Transported to
  Inland Markets Using:

    Barges (12% of TEUs)

    Rail     (22% of TEUs)

    Trucks (66% of TEUs)
The Port of Virginia Cargo Origins and Destinations


 Origins and
  Destinations
  Throughout the

  Mid-Atlantic &
  Mid-West

 Over 55% of
  Cargo Enters
                                                                CONTAINER VOLUME
  or Leaves                                                         1 - 1,000
                                                                    1,001 - 2,500

  the State                                                         2,501 - 7,500
                                                                    7,501 - 15,000
                                                                    15,001 - 45,000
Agenda


 The Port of Virginia
 Ports 101
 The VPA 2040 Master Plan
 Summary
Ports 101

        20’
                                      Port Capacity and
                                       Productivity is Often
                                       Measured in TEUs
One 20’ container = 1 TEU             TEU Stands for
                    40’
                                       “Twenty Foot
                                       Equivalent Unit”
                                      Original Containers
                                       Were 20’ Long
One 40’ container = 2 TEU
              53’                     Today, Most Cargo is
                                       Moved in 40’
                                       Containers

Typical over the road truck
On-Dock Operations

 Container Vessel Arrives at VPA Marine Terminals Using Deep
  Water Navigation Channels in the Hampton Roads Harbor
On-Dock Operations

 Containers are Unloaded  New Cranes at NIT South Terminal are
  from the Ship Using       the Largest, Fastest, and Most Efficient
  Specialized Cranes        Container Cranes in the World
Live Gate System
        With Straddle Carrier

 Containers are Picked-Off the Wharf by Specialized
  “Straddle Carrier” Vehicles
Live Gate System
              With Straddle Carrier
 Straddle Carriers Transfer    Transport & Location of Each
  the Box to the Container       Container is Tracked Using Highly
  Yard for Temporary Storage     Sophisticated Electronic Systems
Live Gate System
              With Straddle Carrier
 Straddle Carriers Remove the    A “Live Gate” Operation Allows
  Container from Storage and       Just-In-Time Scheduling of
  Load it onto Trucks              Trucks Picking-Up Containers
Gate Operations

 Trucks are Processed at the Gate Interchange for Cargo
  Validation and a Special Roadability Safety Check
Gate Operations

 Trucks are Processed at the VPA  Increased Security Since 9/11
  Port Police Security Gate before  All Port Police are Sworn Law
  Exiting the Terminal               Enforcement Officers
Agenda


 The Port of Virginia
 Ports 101
 The VPA 2040 Master Plan
 Summary
Container Cargo Forecast

                     3.50


                     3.00                               1.8 Million TEU’s in 2004

                                                         9.2% Increase From 2003
                     2.50
  TEUs in Millions


                     2.00


                     1.50


                     1.00

                                                                              Master Plan Forecast*, 4.1% (2000)
                     0.50
                                                                              Actual Growth

                     0.00
                              98


                                     00


                                            02


                                                   04


                                                           06


                                                                         10


                                                                                12


                                                                                       14


                                                                                                16


                                                                                                       18


                                                                                                              20
                                                                  08
                            19


                                   20


                                          20


                                                 20


                                                         20


                                                                       20


                                                                              20


                                                                                     20


                                                                                              20


                                                                                                     20


                                                                                                            20
                                                                20


                                                                  YEAR

Source: VPA 2040 Master Plan
*Forecast Numbers Prepared in 2000 and Represent Average Increase Over the 40-Year Forecast Period.
Projected Cargo Demand
                                        and Planned Capacity

                6,000,000
                                                      Containerized Cargo
                                                      Forecast, 4.1% AGR
                5,000,000                             (Source: Global Insight, 2003)
TEUs per year


                4,000,000                 Planned Capacity
                                                                                                                                100%

                3,000,000


                2,000,000                                            33%


                1,000,000
                                                Maersk           Maersk                 CIMT       CIMT       CIMT        CIMT
                                   Existing
                                                Phase I          Phase II              Phase I    Phase II   Phase III   Phase IV
                            2001


                                         2005


                                                          2010


                                                                          2015


                                                                                           2020


                                                                                                     2025


                                                                                                                 2030


                                                                                                                         2035


                                                                                                                                       2040
Development Challenges

 The Port Must Meet Cargo Growth Demands to Promote
  Economic Development in Virginia
 The Volume of Containers is Estimated to More Than
  Double Every 20 Years
 Ship Lines are Moving Toward Larger Ships (10,000+ TEUs),
  Which Require…
      …Larger Cranes
      …More Efficient Marine Terminals
      …Efficient Intermodal Transportation Systems (Rail/Roadway)
 Existing Port Infrastructure Requires Renovation and
  Replacement
 Existing Terminals are Very Near Capacity
Development Challenges

 VPA’s 2040 Master Plan Identifies Major Capital
  Improvements Needed to Keep Pace with Growth
 Near Term (0-15 years)
    $510 Million for NIT (Currently Underway)
    $119 Million for PMT
    $27 Million for NNMT
    $6 Million for VIP

 Long Term (15-30 years)
    $1.76 Billion for New Marine Terminal At Craney Island
Summary of 2040 Master Plan
                        Investments


                       Project                                  Investment1              Time Span

 Norfolk International Terminals2                               $     735.0 M            2001 - 2021

 Portsmouth Marine Terminal2                                    $     187.4 M            2002 - 2015

 Newport News Marine Terminal2                                  $       25.7 M           2004 - 2010

 Virginia Inland Port2                                          $         6.1 M          2005 - 2020

 Craney Island Marine Terminal                                  $ 1,760.3 M              2009 - 2032

 55-Foot Channel Dredging                                       $     169.2 M            2011 - 2013

                      TOTAL INVESTMENT:                         $ 2,883.7 M
Notes: (1) Costs adjusted for inflation. (2) Projects entirely within VPA/VIT control.
Sources of VPA Funds
                      for 2040 Master Plan
Master Equipment            State              CPF Bonds
 Lease Program          Appropriations        $693 M (24%)
   $43 M (2%)            $336 M (11%)


                                            Terminal Revenue
    Pay-As-You-Go                                Bonds
     $1.26 B (44%)                            $551 M (19%)


     Total Funds Required From All Sources = $2.88B
Norfolk International Terminals
       Wharf Renovation
Norfolk International Terminals
          New Cranes
Norfolk International Terminals
    Elevating Girder Crane
Norfolk International Terminals
     Backlands Renovation
Craney Island Marine Terminal
      Terminal Build-Out
Schedule to Meet Forecasted Need


 Feasibility Study (1999 – 2005)
              PED (2005 – 2007)
Dike Construction (2007 – 2009)
        Rapid Fill (2009 – 2011)
           Phase I (2012 – 2016)
          Phase II (2019 – 2022)
         Phase III (2026 – 2028)
         Phase IV (2028 – 2032)
                                             08


                                                            14


                                                                      18


                                                                                     24


                                                                                                    30
                                   04

                                        06


                                                  10

                                                       12


                                                                 16


                                                                           20

                                                                                22


                                                                                          26

                                                                                               28


                                                                                                         32

                                                                                                              34
                             02
                                   20

                                        20

                                             20

                                                  20

                                                       20

                                                            20
                                                                 20

                                                                      20

                                                                           20

                                                                                20

                                                                                     20

                                                                                          20

                                                                                               20

                                                                                                    20

                                                                                                         20

                                                                                                              20
                            20
Regional Economic Impact
              of Craney Island

 The Proposed Craney Island Marine Terminal will
  Provide Significant Regional Economic Impacts


        Craney Island Regional Economic
            Impact Forecast (Annually)
   Jobs                                 64,255
   Wages                       $ 1,658,000,000
   Taxes – State/Local         $ 487,000,000
   TOTAL IMPACT                $ 5,277,000,000
Hampton Roads
         Transportation Network
         Newport                        Chesapeake Bay
          News
James
 River


                              Norfolk


                                                   Virginia Beach


            Portsmouth


                                                                    Port Facility
                                                                    CIDMMA
                                                                    Interstate/Highway
                     Chesapeake                                     Proposed Third Crossing
                                                                    50/55 Ft Channel
                                                                    Railroad
                                                                    Proposed Maersk Terminal
                                                                    Proposed Craney Island Railway
                                                                    Proposed Craney Island Terminal
Agenda


 The Port of Virginia
 Ports 101
 The VPA 2040 Master Plan
 Summary
Summary


 The Port of Virginia is Poised to Double the Amount
  of Containerized Cargo Moving Through the Port
  over the Next 20 Years
 The Port has a Master Plan Designed to Handle this
  Growth
    Master Plan Accounts for Marine Terminals only
    Fiscally Responsible
 Doubling Containerized Cargo, will Provide
  Additional Economic Growth – Jobs, Good Wages,
  and Tax Revenues
 Transportation Infrastructure Must Be Developed To
  Accommodate Future Growth
Port Of Virginia 101

Port Of Virginia 101

  • 1.
    The Port ofVirginia – Meeting Future Needs Today The Virginia Port Authority The 2040 Master Plan and Intermodal Connectivity May 9, 2005
  • 2.
    The Port ofVirginia Jamestown 1607 Godspeed Discovery Length = 68’ Length = 49’ 6” 20 tons (1 TEU) Hapag-Lloyd Columbo Express Susan Constant Length = 1,099’ Width = 141’ Length = 116’ 8,750 TEU Ship
  • 3.
    The Port ofVirginia  First Ship Sails from Jamestown with Export Cargo  Year is 1607  No Dredging Required  No Highway Required  No Railroad Required  Small Landside Facilities Required (Wooden Pier)  Low Financial Investment  By 1630 Tobacco Exports to Europe  1,500,000 lbs = 750 Tons = 50 TEUs!
  • 4.
    Fast Forward 400Years  2004 The Port of Virginia Handled 1,810,000 TEUs  2003 First 8,000 TEU Vessel Sets Sail  Require Considerable Dredging  Require Major Interstate Highways  Require Major Railroads  Require Considerable Port Infrastructure
  • 5.
    Agenda  The Portof Virginia  Ports 101  The VPA 2040 Master Plan  Summary
  • 7.
    The Port ofVirginia  The Virginia Port Authority (VPA)  An Agency of the Commonwealth  Fosters and Stimulates the Commerce of the Commonwealth  Engages in Promoting, Developing, Constructing, Equipping, Maintaining and Operating the Harbors and Seaports Within the Jurisdiction of the Commonwealth  Virginia International Terminals (VIT)  A Virginia Non-Stock, Non-Profit Operating Affiliate of the Virginia Port Authority  Operates the Terminals Owned by the Commonwealth
  • 9.
    Economic Impact ofThe Port  1999 Economic Impact Study* 165,000 Port and Port-Related Jobs $762.5 Million in Business Revenues $60.7 Million in State and Local Taxes  2003 Bureau of Economic Statistics Report The Port Plays a Part in Over 180,000 Jobs Salary and Wages in Excess of $5 Billion *Source: Martin Associates
  • 10.
    Distribution of ShipCalls at The Port of Virginia  More Than 75 Steamship Lines Serve the Port  Sailings to Over 250 Ports in 100 Overseas Locations The Port of Virginia is within a 1-day drive of over 2/3 of the U.S. population and 301,000 manufacturing firms 780 The Port of Virginia 468 832 364 780 208 260 The Port of Virginia is within 750 miles of 60% of the nation’s total personal income and 52 consumer expenditures *Many services call more than one tradelane.
  • 11.
    U.S. National Gateways Vancouver, BC 90% of Containerized Seattle/Tacoma Trade Moves Through 10 North American Port Gateways New York/ New Jersey Oakland The Port of Virginia is the 7th Largest Gateway Los Angeles/ Long Beach Charleston Savannah Houston Miami
  • 12.
    U.S. Cargo Trends 44% of U.S. Import Cargo Comes into the Port of Los Angeles/Long Beach  Transported to Mid-West via Rail and Truck  West Coast Port Congestion Has Diverted Cargo to East Coast Ports via All-Water Route  VPA Experienced Major Growth in Asia Trade Lanes in 2004  SE Asia  19.6%  NE Asia  22.8%
  • 13.
    VPA Containerized Trade by Region 450,000 Percentage Share of Total 400,000 30.1% 350,000 27.3% TEUs 300,000 250,000 200,000 150,000 11.1% 10.0% 100,000 6.4% 5.8% 50,000 3.1% 3.9% 0.3% 0.6% 0.2% 1.0% S AMERICA N EUROPE C AMERICA INDIA MED OCEANIA AFRICA NE ASIA SE ASIA CARIB N AMERICA Source: PIERS Trade Data, 2004 MID EAST
  • 14.
    The Intermodal Gateway The 1.81 Million TEUs Exported/Imported From the Port of Virginia in 2004 Were Transported to Inland Markets Using:  Barges (12% of TEUs)  Rail (22% of TEUs)  Trucks (66% of TEUs)
  • 15.
    The Port ofVirginia Cargo Origins and Destinations  Origins and Destinations Throughout the Mid-Atlantic & Mid-West  Over 55% of Cargo Enters CONTAINER VOLUME or Leaves 1 - 1,000 1,001 - 2,500 the State 2,501 - 7,500 7,501 - 15,000 15,001 - 45,000
  • 16.
    Agenda  The Portof Virginia  Ports 101  The VPA 2040 Master Plan  Summary
  • 17.
    Ports 101 20’  Port Capacity and Productivity is Often Measured in TEUs One 20’ container = 1 TEU  TEU Stands for 40’ “Twenty Foot Equivalent Unit”  Original Containers Were 20’ Long One 40’ container = 2 TEU 53’  Today, Most Cargo is Moved in 40’ Containers Typical over the road truck
  • 20.
    On-Dock Operations  ContainerVessel Arrives at VPA Marine Terminals Using Deep Water Navigation Channels in the Hampton Roads Harbor
  • 21.
    On-Dock Operations  Containersare Unloaded  New Cranes at NIT South Terminal are from the Ship Using the Largest, Fastest, and Most Efficient Specialized Cranes Container Cranes in the World
  • 22.
    Live Gate System With Straddle Carrier  Containers are Picked-Off the Wharf by Specialized “Straddle Carrier” Vehicles
  • 23.
    Live Gate System With Straddle Carrier  Straddle Carriers Transfer  Transport & Location of Each the Box to the Container Container is Tracked Using Highly Yard for Temporary Storage Sophisticated Electronic Systems
  • 24.
    Live Gate System With Straddle Carrier  Straddle Carriers Remove the  A “Live Gate” Operation Allows Container from Storage and Just-In-Time Scheduling of Load it onto Trucks Trucks Picking-Up Containers
  • 25.
    Gate Operations  Trucksare Processed at the Gate Interchange for Cargo Validation and a Special Roadability Safety Check
  • 26.
    Gate Operations  Trucksare Processed at the VPA  Increased Security Since 9/11 Port Police Security Gate before  All Port Police are Sworn Law Exiting the Terminal Enforcement Officers
  • 27.
    Agenda  The Portof Virginia  Ports 101  The VPA 2040 Master Plan  Summary
  • 28.
    Container Cargo Forecast 3.50 3.00 1.8 Million TEU’s in 2004 9.2% Increase From 2003 2.50 TEUs in Millions 2.00 1.50 1.00 Master Plan Forecast*, 4.1% (2000) 0.50 Actual Growth 0.00 98 00 02 04 06 10 12 14 16 18 20 08 19 20 20 20 20 20 20 20 20 20 20 20 YEAR Source: VPA 2040 Master Plan *Forecast Numbers Prepared in 2000 and Represent Average Increase Over the 40-Year Forecast Period.
  • 29.
    Projected Cargo Demand and Planned Capacity 6,000,000 Containerized Cargo Forecast, 4.1% AGR 5,000,000 (Source: Global Insight, 2003) TEUs per year 4,000,000 Planned Capacity 100% 3,000,000 2,000,000 33% 1,000,000 Maersk Maersk CIMT CIMT CIMT CIMT Existing Phase I Phase II Phase I Phase II Phase III Phase IV 2001 2005 2010 2015 2020 2025 2030 2035 2040
  • 30.
    Development Challenges  ThePort Must Meet Cargo Growth Demands to Promote Economic Development in Virginia  The Volume of Containers is Estimated to More Than Double Every 20 Years  Ship Lines are Moving Toward Larger Ships (10,000+ TEUs), Which Require… …Larger Cranes …More Efficient Marine Terminals …Efficient Intermodal Transportation Systems (Rail/Roadway)  Existing Port Infrastructure Requires Renovation and Replacement  Existing Terminals are Very Near Capacity
  • 31.
    Development Challenges  VPA’s2040 Master Plan Identifies Major Capital Improvements Needed to Keep Pace with Growth  Near Term (0-15 years)  $510 Million for NIT (Currently Underway)  $119 Million for PMT  $27 Million for NNMT  $6 Million for VIP  Long Term (15-30 years)  $1.76 Billion for New Marine Terminal At Craney Island
  • 32.
    Summary of 2040Master Plan Investments Project Investment1 Time Span Norfolk International Terminals2 $ 735.0 M 2001 - 2021 Portsmouth Marine Terminal2 $ 187.4 M 2002 - 2015 Newport News Marine Terminal2 $ 25.7 M 2004 - 2010 Virginia Inland Port2 $ 6.1 M 2005 - 2020 Craney Island Marine Terminal $ 1,760.3 M 2009 - 2032 55-Foot Channel Dredging $ 169.2 M 2011 - 2013 TOTAL INVESTMENT: $ 2,883.7 M Notes: (1) Costs adjusted for inflation. (2) Projects entirely within VPA/VIT control.
  • 33.
    Sources of VPAFunds for 2040 Master Plan Master Equipment State CPF Bonds Lease Program Appropriations $693 M (24%) $43 M (2%) $336 M (11%) Terminal Revenue Pay-As-You-Go Bonds $1.26 B (44%) $551 M (19%) Total Funds Required From All Sources = $2.88B
  • 36.
  • 37.
  • 38.
    Norfolk International Terminals Elevating Girder Crane
  • 39.
  • 41.
    Craney Island MarineTerminal Terminal Build-Out
  • 42.
    Schedule to MeetForecasted Need Feasibility Study (1999 – 2005) PED (2005 – 2007) Dike Construction (2007 – 2009) Rapid Fill (2009 – 2011) Phase I (2012 – 2016) Phase II (2019 – 2022) Phase III (2026 – 2028) Phase IV (2028 – 2032) 08 14 18 24 30 04 06 10 12 16 20 22 26 28 32 34 02 20 20 20 20 20 20 20 20 20 20 20 20 20 20 20 20 20
  • 43.
    Regional Economic Impact of Craney Island  The Proposed Craney Island Marine Terminal will Provide Significant Regional Economic Impacts Craney Island Regional Economic Impact Forecast (Annually) Jobs 64,255 Wages $ 1,658,000,000 Taxes – State/Local $ 487,000,000 TOTAL IMPACT $ 5,277,000,000
  • 44.
    Hampton Roads Transportation Network Newport Chesapeake Bay News James River Norfolk Virginia Beach Portsmouth Port Facility CIDMMA Interstate/Highway Chesapeake Proposed Third Crossing 50/55 Ft Channel Railroad Proposed Maersk Terminal Proposed Craney Island Railway Proposed Craney Island Terminal
  • 45.
    Agenda  The Portof Virginia  Ports 101  The VPA 2040 Master Plan  Summary
  • 46.
    Summary  The Portof Virginia is Poised to Double the Amount of Containerized Cargo Moving Through the Port over the Next 20 Years  The Port has a Master Plan Designed to Handle this Growth  Master Plan Accounts for Marine Terminals only  Fiscally Responsible  Doubling Containerized Cargo, will Provide Additional Economic Growth – Jobs, Good Wages, and Tax Revenues  Transportation Infrastructure Must Be Developed To Accommodate Future Growth

Editor's Notes

  • #14 China accounts for over half of U.S. Containerized trade. Top six world regions account for 86% of total.
  • #29 VPA Projects a 9% Growth in 2005.