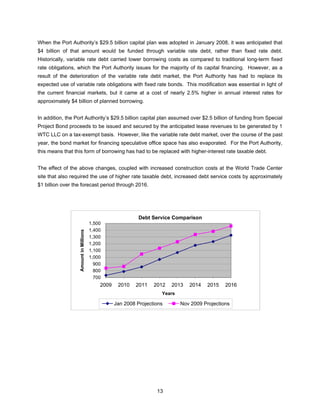
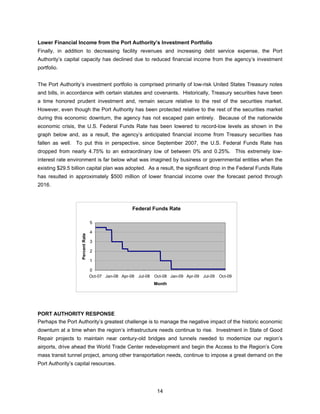
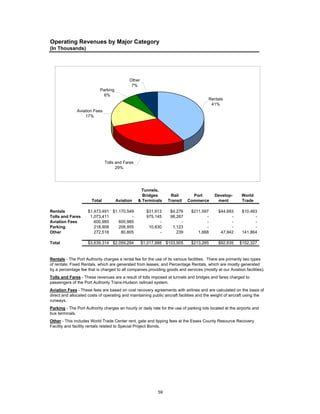
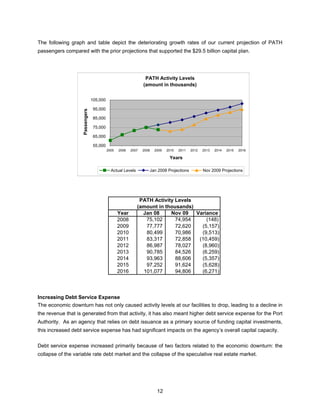
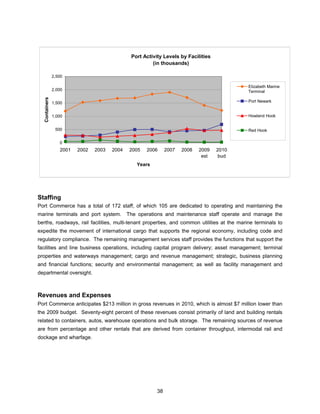
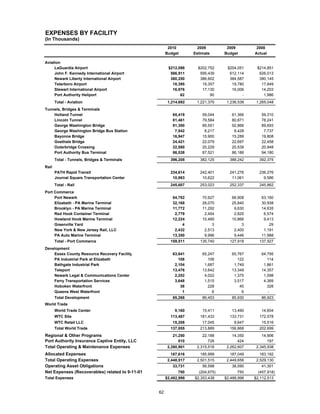
2. APPENDIX A:
AGENCY OVERVIEW
Mission
To identify and meet the critical transportation infrastructure needs of the
bistate region’s businesses, residents, and visitors: providing the highest
quality, most efficient transportation and port commerce facilities and
services that move people and goods within the region, providing access to
the rest of the nation and to the world, while strengthening the economic
competitiveness of the New York-New Jersey Metropolitan Region.
3. TABLE OF CONTENTS
Message from the Chairman and Executive Director………………………..……………….. 3
Impact of the Economic Downturn on the Port Authority...………………...…………………. 5
2010 Budget Summary…………………………………………………………..………….…… 17
2010 Budget Summary by Line Department………………………………..……..………….. 27
a. Aviation…………………………………………………………………………… 29
b. PATH……………………………………………………………………………… 33
c. Port Commerce………………………………………………………………….. 37
d. Tunnels, Bridges and Terminals………………………..……………………… 41
e. Development, Real Estate and ARC………………………………………….. 45
f. World Trade Center……………………………………………………………… 48
2010 Budget Schedules.…………………………………………..…………………..………...51
a. Summary of 2010 Budget………………………………………………………. 53
b. Sources…………………………………………………………………………… 56
c. Uses………………………………………………………………………………. 60
d. Changes in Net Assets, Consolidated Statement of Net Assets,
Information on P.A. Operations by Facility, Revenues and Reserves,
and Assets & Liabilities………………………………………………………… 67
e. Outstanding Obligations and Financing………………………………………. 73
f. Staffing……………………………………………….…………………………… 76
g. Activity Highlights……………………………………………………………….. 78
2010 Capital Plan Project List………………………………………………………………….. 81
a. Summary by Departments……………………………………………………… 83
b. Sorted by Department, Facility and Program………………………………… 84
Appendix A: Agency Overview……………………………………………...……………… 101
Appendix B: Budget Process and Financial Policies.……………………..……………... 105
Appendix C: Agency Goals, Projects, Outcomes and Deliverables…...…….………… 110
Appendix D: Glossary…………………………………………………………….…………. 111
1
4. The Government Finance Officers Association of the United States and Canada (GFOA)
presented a Distinguished Budget Presentation Award to Port Authority of New York & New
Jersey, New York for its annual budget for the fiscal year beginning January 1, 2009. In order
to receive this award, a governmental unit must publish a budget document that meets program
criteria as a policy document, as an operations guide, as a financial plan, and as a
communications device. This award is valid for a period of one year only. We believe our current
budget continues to conform to program requirements, and we are submitting it to GFOA to
determine its eligibility for another award.
2
5. MESSAGE FROM THE CHAIRMAN AND
EXECUTIVE DIRECTOR
Dear Governors,
We respectfully present the 2010 Budget of The Port Authority of New York and New Jersey. The pages
that follow describe a $6.3 billion budget that responds to the historic recession while maintaining
investments in the region’s most critical priorities.
Like all public agencies, the Port Authority has been hit hard by the economic downturn. When consumer
spending is down and unemployment is up, there are fewer goods being shipped and trucked, fewer
people commuting to jobs that no longer exist and fewer people flying to destinations that are no longer
affordable.
As a result, activity levels at all Port Authority facilities are projected to be significantly lower in 2010 than
was projected less than two years ago when we adopted the current ten-year capital plan. Passenger
traffic is expected to be 10 percent lower at our airports than our original projections and 11.8 percent
lower on the PATH system. At our bridges and tunnels, vehicular traffic is expected to be 6.1 percent
lower, and at our ports, cargo volume is expected to be 15.6 percent lower. This decline in activity levels
has led to a significant deterioration in the agency’s operating revenues. In addition, the economic
downturn has forced the agency to incur higher debt service expense and earn lower financial income.
As a result of these factors, the Port Authority’s capital capacity for the 2007-2016 plan period has
decreased by $5 billion – from $29.5 billion to $24.5 billion. To ensure the Port Authority meets its critical
priorities but also lives within its means, we have taken aggressive action to control operating expenses
and prioritize capital projects.
Zero-Growth Operating Budget and Headcount Reduction. Last year, the Port Authority introduced a
zero-growth operating budget and kept the agency’s headcount flat. This year, the agency will go even
further, implementing the agency’s second straight zero-growth operating budget and cutting authorized
positions down to the lowest level in 40 years. This will require, among other cost control measures,
reducing the agency’s authorized positions by 150, cutting the external consulting budget by 32 percent,
decreasing overtime by 20 percent, and closing Port Authority-funded operations such as the Ramada
Hotel at JFK Airport.
Prioritization and Deferral of Capital Projects. In addition to belt-tightening on the operating side of
the budget, the Port Authority has had to make difficult choices to live within its means on the capital side
of the budget. As the agency’s capital capacity has shrunk, so must its capital expenditures. In order to
3
6. ensure that the Port Authority meets its most critical spending obligations, such as investing in state of
good repair projects, the agency has had to defer certain discretionary spending items. The decision to
defer these projects has not been made lightly, but these choices are necessary to make certain we can
afford our most urgent priorities.
As a result of this financial discipline, the 2010 Budget calls for no increases in tolls and fares.
We believe our 2010 Budget meets the region’s significant infrastructure challenges, but we can do so
only because of aggressive efforts to control operating expenses and defer important, but discretionary,
capital projects. That is something we must and will continue to do going forward to weather this
economic storm.
We look forward to working with you and the public as the Port Authority implements its 2010 Budget.
Sincerely,
Anthony R. Coscia Christopher O. Ward
Chairman Executive Director
4
7. IMPACT OF THE ECONOMIC DOWNTURN ON
THE PORT AUTHORITY
In order to give the Port Authority’s 2010 Budget and long-term planning efforts greater context, this
section details the significant challenges confronting the Port Authority today and in the future, and how
the agency is responding. The first section, “Effect of the Economic Downturn,” summarizes the
economic downturn’s overall impact on the Port Authority’s net revenues and long-term capital capacity.
The second section, “Port Authority Revenues and Capital Capacity Hit Hard by Recession,” breaks down
the three principal causes of the decline in the agency’s capital capacity: reduced activity levels at the
agency’s facilities, increased debt service expense, and lower financial income. The final section, “Port
Authority Response,” discusses the ongoing need for transportation and infrastructure investment
throughout the region and the kinds of actions the Port Authority is taking in order to meet those needs
while weathering the financial storm.
EFFECT OF THE ECONOMIC DOWNTURN
While the Port Authority’s economic condition remains fundamentally sound, the global and national
economic downturn has had a significant impact on the agency – most reflected in the loss of net
operating revenues (gross operating revenue less operating expenses) and the decline of the agency’s
long-term capital capacity. In less than two years, the Port Authority’s ten-year capital capacity, from
2007 to 2016, has shrunk by $5 billion – from $29.5 billion, when the agency’s Capital Plan was updated
in January 2008, to $24.5 billion today. On the operating side of the budget, the Port Authority’s net
income from operations is expected to be negative $39 million in 2010 – a decline of $197 million from the
2009 Budget.
The Port Authority has taken a variety of measures over the past year to mitigate the impacts of the
economic downturn – such as a zero-growth operating budget, reduced headcount and prioritization of
capital spending. However, further actions will be required as the impact of the economic downturn
continues to be felt. From an operating perspective, the downturn has required the Port Authority for the
second straight year to operate on a zero-growth budget, to reduce headcount to the lowest level in 40
years and to curtail certain operations that can no longer be maintained in such a financially constrained
environment.
From a capital budget perspective, the current fiscal context has forced a variety of difficult decisions
regarding the allocation of constrained capital resources. This will result in a greater concentration on
State of Good Repair projects over the near term, and the deferral of certain discretionary capital projects
beyond the 2016 end date to the current Port Authority ten-year Capital Plan. In addition, the agency’s
reduced capital capacity will require continued prioritization and reassessment in the months and years
ahead.
5
8. Detailed below are the main factors that have contributed to the agency’s current capital capacity
challenge, as well as a description of the actions the Port Authority has taken to ensure that, despite the
economic downturn, the agency continues to live within its means.
PORT AUTHORITY REVENUES AND CAPITAL CAPACITY HIT HARD BY RECESSION
The historic recession of the past two years has affected the Port Authority as follows: (1) declining
revenue due to falling activity levels at our bridges and tunnels, airports, PATH, and ports; (2) increasing
debt service due to the collapse of the variable rate debt market and the real estate finance market; (3)
lower financial income due to the historic drop in the U.S. Federal Funds rate, which drives the agency’s
financial return given our investments in U.S. Treasury obligations. These impacts are explained in detail
below.
Declining Revenue
Activity levels in all Port Authority businesses – aviation passenger volume, container movements, vehicle
crossings, PATH ridership – began to slow in 2008 and further erode in 2009. These declines have been
driven by an interrelated set of global, national and regional economic forces – leading to an historic
recession, second in magnitude only to the 1930’s Great Depression. As a consequence, the regional
unemployment rate has more than doubled since 2007, reaching 9.4% as of September 2009 with
national unemployment rising into double digits. Based on forecasts from Economy.com, the region will
lose 156,000 jobs by the end of 2009 compared with 2008, with an additional decline of 72,000 in 2010.
These economic forces translate directly into declining Port Authority revenue. When consumer spending
is down and unemployment is up, there are fewer goods being shipped and trucked, fewer people
commuting to jobs that no longer exist and fewer people flying to destinations that are no longer
affordable. Thus toll and fare revenue is down, as is revenue derived from flight fees, airport parking and
concessions, and container and other Port-related fees, among other facility revenue sources. As a
result, projected net operating revenues over the current capital plan period (2007-2016) have declined
by approximately $1.8 billion. The following graphs and tables show the key economic drivers that have
led to declining activity levels and compare the projected activity levels that supported the Port Authority’s
ten-year $29.5 billion capital capacity as of January 2008 versus $24.5 billion in capital capacity as of
today. These figures are based on actual results and revised projections as of November 2009.
Aviation
A steep climb in jet fuel prices in the first half of 2008, the slowdown in global GDP, and the drop in
domestic consumer spending all contributed to the 2.6% decline in aviation passenger traffic for 2008 at
our airports. Even as jet fuel prices stabilized, a continuation of the national and global recession led to a
further decline of 3.2% for 2009. Most significantly as it relates to the agency’s current capital capacity
challenge, the Port Authority is now projecting a 10% decline in passenger traffic in 2010 as compared to
6
9. the agency’s 2010 projection made in January 2008, which was used to form the basis of the agency’s
original $29.5 billion plan.
Aviation - Drivers
2005 2006 2007 2008 2009 2010
12.0
10.0
8.0
6.0
4.0
2.0
0.0
-2.0
-4.0
-6.0
GDP - Western Europe GDP - U.S. Unemployment Rate - Port Authority Aviation
(% Chg)* (% Chg)* U.S. * Passengers
(% Chg)
* Global Insight, October 2009
The following graph and table depict the lower growth rates under our current projection of passenger
traffic at our airports compared with the prior projections that supported the $29.5 billion capital plan.
Aviation Activity Levels
(amount in thousands)
130,000
125,000
Passengers
120,000
115,000
110,000
105,000
100,000
95,000
2005 2006 2007 2008 2009 2010 2011 2012 2013 2014 2015 2016
Years
Actual Levels Jan 2008 Projections Nov 2009 Projections
7
10. Aviation Activity Levels
(amount in thousands)
Year Jan 08 Nov 09 Variance
2008 110,453 106,214 (4,239)
2009 112,392 102,847 (9,545)
2010 115,072 103,588 (11,484)
2011 117,997 105,961 (12,036)
2012 121,134 108,603 (12,531)
2013 124,068 111,186 (12,882)
2014 125,853 114,163 (11,690)
2015 127,619 117,417 (10,202)
2016 129,398 120,770 (8,628)
Port Commerce
As GDP has fallen in nearly every region of the world, the volume of trade handled at our marine facilities
has declined – 1% in 2008 and a projected 13% drop in 2009. Most significantly as it relates to the
agency’s current capital capacity challenge, the Port Authority is now projecting a 15.6% decline in cargo
volume in 2010 as compared to the agency’s 2010 projection made in January 2008, which was used to
form the basis of the agency’s original $29.5 billion plan.
Port Commerce - Drivers
2005 2006 2007 2008 2009 2010
15.0
10.0
5.0
0.0
-5.0
-10.0
-15.0
-20.0
GDP - World Total Trade in Goods - U.S. Port Authority Containers
(% Chg)* (% Chg)* (% Chg)
* Global Insight, October 2009
The following graph and table depict the deteriorating growth rates of our current projection of containers
at our marine terminals compared with the prior projections that supported the $29.5 billion capital plan.
8
11. Port Commerce Activity Levels
(amount in thousands)
4,700
4,200
Containers
3,700
3,200
2,700
2,200
2005 2006 2007 2008 2009 2010 2011 2012 2013 2014 2015 2016
Years
Actual Levels Jan 2008 Projections Nov 2009 Projections
Port Commerce Activity Levels
(amount in thousands)
Year Jan 08 Nov 09 Variance
2008 2,942 3,069 127
2009 3,090 2,670 (420)
2010 3,244 2,724 (520)
2011 3,406 2,832 (574)
2012 3,577 2,960 (617)
2013 3,755 3,115 (640)
2014 3,943 3,272 (671)
2015 4,140 3,620 (520)
2016 4,326 3,901 (425)
Tunnels, Bridges and Terminals
The fall in regional employment, particularly employment in Manhattan office space, lower consumer
spending, and the drop in international trade combined to drive down vehicular crossings over the Port
Authority controlled bridges and tunnels. Total vehicular crossings fell by 2.6% in 2008, with autos and
trucks declining by 2.8% and 1.5%, respectively. With the continuation of the recession, crossings are
expected to decline by an additional 1.7% for 2009, with autos 1.1% lower and trucks – a key revenue
driver – 9.5% lower. Most significantly as it relates to the agency’s current capital capacity challenge, the
Port Authority is now projecting a 6.1% decline in passenger traffic in 2010 as compared to the agency’s
2010 projection made in January 2008, which was used to form the basis of the agency’s original $29.5
billion plan.
9
12. TB&T - Drivers
2005 2006 2007 2008 2009 2010
15.0
10.0
5.0
0.0
-5.0
-10.0
-15.0
-20.0
Office Employment - Recreation Spending - Total Trade in Goods - Total Port Authority
Region (% Chg)** U.S. (% Chg)* U.S. Vehicular Crossings
(% Chg)* (% Chg)
* Global Insight, October 2009
** Economy.com, September 2009
The following graph and table depict the deteriorating growth rates of our current projection of vehicular
activity at our tunnels and bridges compared with the prior projections that supported the $29.5 billion
capital plan.
TB&T Activity Levels
(amount in thousands)
145,000
140,000
Vehicles
135,000
130,000
125,000
120,000
2005 2006 2007 2008 2009 2010 2011 2012 2013 2014 2015 2016
Years
Actual Levels Jan 2008 Projections Nov 2009 Projections
10
13. TB&T Activity Levels
(amount in thousands)
Year Jan 08 Nov 09 Variance
2008 126,009 123,725 (2,284)
2009 127,648 121,646 (6,002)
2010 129,998 122,125 (7,873)
2011 132,353 122,800 (9,553)
2012 133,665 124,024 (9,641)
2013 135,375 124,427 (10,948)
2014 137,380 125,665 (11,715)
2015 139,425 126,792 (12,633)
2016 140,296 128,549 (11,747)
PATH Rail Transit
Regional employment is also a major driver of passenger volumes on the PATH system. PATH bucked
the trend in 2008, rising 4.7% to 75 million, compared with 2007 levels, partly reflecting the switch to
transit caused by the huge rise in gas prices in the first half of 2008. However, the decline in regional
jobs has now taken its toll on ridership, with the PATH system expecting a decline of 3.1% in 2009. Most
significantly as it relates to the agency’s current capital capacity challenge, the Port Authority is now
projecting an 11.8% decline in passenger traffic in 2010 as compared to the agency’s 2010 projection
made in January 2008, which was used to form the basis of the agency’s original $29.5 billion plan.
PATH - Drivers
2005 2006 2007 2008 2009 2010
12.0
10.0
8.0
6.0
4.0
2.0
0.0
-2.0
-4.0
Regional Employment PATH Passengers
(%Chg)** (%Chg)
** Economy.com, September 2009
11
14. The following graph and table depict the deteriorating growth rates of our current projection of PATH
passengers compared with the prior projections that supported the $29.5 billion capital plan.
PATH Activity Levels
(amount in thousands)
105,000
95,000
Passengers
85,000
75,000
65,000
55,000
2005 2006 2007 2008 2009 2010 2011 2012 2013 2014 2015 2016
Years
Actual Levels Jan 2008 Projections Nov 2009 Projections
PATH Activity Levels
(amount in thousands)
Year Jan 08 Nov 09 Variance
2008 75,102 74,954 (148)
2009 77,777 72,620 (5,157)
2010 80,499 70,986 (9,513)
2011 83,317 72,858 (10,459)
2012 86,987 78,027 (8,960)
2013 90,785 84,526 (6,259)
2014 93,963 88,606 (5,357)
2015 97,252 91,624 (5,628)
2016 101,077 94,806 (6,271)
Increasing Debt Service Expense
The economic downturn has not only caused activity levels at our facilities to drop, leading to a decline in
the revenue that is generated from that activity, it has also meant higher debt service expense for the Port
Authority. As an agency that relies on debt issuance as a primary source of funding capital investments,
this increased debt service expense has had significant impacts on the agency’s overall capital capacity.
Debt service expense increased primarily because of two factors related to the economic downturn: the
collapse of the variable rate debt market and the collapse of the speculative real estate market.
12
15. When the Port Authority’s $29.5 billion capital plan was adopted in January 2008, it was anticipated that
$4 billion of that amount would be funded through variable rate debt, rather than fixed rate debt.
Historically, variable rate debt carried lower borrowing costs as compared to traditional long-term fixed
rate obligations, which the Port Authority issues for the majority of its capital financing. However, as a
result of the deterioration of the variable rate debt market, the Port Authority has had to replace its
expected use of variable rate obligations with fixed rate bonds. This modification was essential in light of
the current financial markets, but it came at a cost of nearly 2.5% higher in annual interest rates for
approximately $4 billion of planned borrowing.
In addition, the Port Authority’s $29.5 billion capital plan assumed over $2.5 billion of funding from Special
Project Bond proceeds to be issued and secured by the anticipated lease revenues to be generated by 1
WTC LLC on a tax-exempt basis. However, like the variable rate debt market, over the course of the past
year, the bond market for financing speculative office space has also evaporated. For the Port Authority,
this means that this form of borrowing has had to be replaced with higher-interest rate taxable debt.
The effect of the above changes, coupled with increased construction costs at the World Trade Center
site that also required the use of higher rate taxable debt, increased debt service costs by approximately
$1 billion over the forecast period through 2016.
Debt Service Comparison
1,500
1,400
Amount in Millions
1,300
1,200
1,100
1,000
900
800
700
2009 2010 2011 2012 2013 2014 2015 2016
Years
Jan 2008 Projections Nov 2009 Projections
13
16. Lower Financial Income from the Port Authority’s Investment Portfolio
Finally, in addition to decreasing facility revenues and increasing debt service expense, the Port
Authority’s capital capacity has declined due to reduced financial income from the agency’s investment
portfolio.
The Port Authority’s investment portfolio is comprised primarily of low-risk United States Treasury notes
and bills, in accordance with certain statutes and covenants. Historically, Treasury securities have been
a time honored prudent investment and, remain secure relative to the rest of the securities market.
However, even though the Port Authority has been protected relative to the rest of the securities market
during this economic downturn, the agency has not escaped pain entirely. Because of the nationwide
economic crisis, the U.S. Federal Funds Rate has been lowered to record-low levels as shown in the
graph below and, as a result, the agency’s anticipated financial income from Treasury securities has
fallen as well. To put this in perspective, since September 2007, the U.S. Federal Funds Rate has
dropped from nearly 4.75% to an extraordinary low of between 0% and 0.25%. This extremely low-
interest rate environment is far below what was imagined by business or governmental entities when the
existing $29.5 billion capital plan was adopted. As a result, the significant drop in the Federal Funds Rate
has resulted in approximately $500 million of lower financial income over the forecast period through
2016.
Federal Funds Rate
5
4
Percent Rate
3
2
1
0
Oct-07 Jan-08 Apr-08 Jul-08 Oct-08 Jan-09 Apr-09 Jul-09 Oct-09
Month
PORT AUTHORITY RESPONSE
Perhaps the Port Authority’s greatest challenge is to manage the negative impact of the historic economic
downturn at a time when the region’s infrastructure needs continue to rise. Investment in State of Good
Repair projects to maintain near century-old bridges and tunnels needed to modernize our region’s
airports, drive ahead the World Trade Center redevelopment and begin the Access to the Region’s Core
mass transit tunnel project, among other transportation needs, continue to impose a great demand on the
Port Authority’s capital resources.
14
17. To ensure the Port Authority meets its critical priorities but also lives within its means, the agency has
taken aggressive action to control operating expenses and prioritize capital spending.
Zero-Growth Operating Budget and Headcount Reduction
Last year, the Port Authority introduced a zero-growth operating budget and kept the agency’s headcount
flat. These initiatives built on the agency’s efforts since 2004 that had reduced headcount by nearly 400
positions and kept the rate of operating budget growth significantly below the rate of inflation. This year,
the agency will go even further, implementing the agency’s second straight zero-growth operating budget
and cutting authorized positions down to the lowest level in 40 years. That will require reducing the
agency’s authorized positions by 150, cutting the external consulting budget by 32%, decreasing overtime
by 20%, and closing Port Authority-funded operations such as the Ramada Hotel at JFK Airport which
given the significantly lower air traffic and need for substantial renovation, would result in losses of $1
million per month if it were to remain open.
Prioritization and Deferral of Capital Projects
In addition to fiscal discipline on the operating side of the budget, the Port Authority has had to make
difficult choices to live within its means on the capital side of the budget. As the agency’s capital capacity
has shrunk from $29.5 billion to $24.5 billion, so must its capital expenditures. In order to ensure that the
Port Authority meets its most critical spending obligations such as investing in State of Good Repair
projects, the agency has had to defer certain discretionary spending items, even though these items
remain critical to the region’s growth.
Projects like the Bus Garage for the Port Authority Bus Terminal that will act as a traffic reliever to the
Lincoln Tunnel and adjacent Manhattan streets must be deferred beyond the 2007-2016 capital plan
period. Funding for the replacement of the LaGuardia Central Terminal Building and Newark Liberty
International Airport’s Terminal A has been restricted to only planning dollars, allowing these projects to
advance as funding becomes available. Similarly, funding for Stewart Airport’s modernization, while still
committed over the long-term, has been slowed as well. In addition, the replacement of the Lincoln
Tunnel Helix must be restaged to ensure that we maintain its structural integrity while deferring its full
replacement beyond 2016.
The decision to defer these projects has not been made lightly; and the agency is committed to
completing these projects over the long term. But given the economic downturn and the significant
impact it has had on the Port Authority's capital capacity, they were difficult choices that had to be made
to live within our means.
15
18. Ongoing Prioritization and Austerity Required
Despite the significant actions that the Port Authority has already taken to ensure its budget reflects the
new economic and fiscal realities, if we are to continue to live within our means, we must continue to
make sure our operating budget is as lean as possible, make adjustments where necessary and continue
to prioritize capital spending in recognition of a rapidly shifting economic landscape.
16
21. 2010 BUDGET SUMMARY
2010 Operating Budget Highlights
Despite the continuing decline in activity levels, the Port Authority’s overall fiscal condition remains sound
due in large part to numerous cost-cutting measures taken in anticipation of the economic downturn.
That fiscal discipline continues in the agency’s 2010 Budget. Major highlights of the Port Authority's 2010
operating budget include:
• Zero growth in operating expenses for the second consecutive year. The agency’s operating
expense growth has been well below inflation for several consecutive years:
o 2010: 0%
o 2009: 0%
o 2008: 0.9%
o 2007: 1.1%
• Cutting authorized position levels by 150 to a total of 6,977 compared to 7,127 in 2009 – the
lowest level in 40 years. On top of previous headcount reductions dating back to 2004, the
Port Authority has reduced non-police, mostly professional and managerial positions by 507
or nearly 9%.
• Cutting overtime by 20% or $24 million.
• Cutting the use of external consultants by 32% or $15 million.
• Closing the Ramada Plaza Hotel at JFK International Airport. Given significantly lower air
traffic and need for substantial renovation, keeping the Ramada Hotel open would have
resulted in losses of $1 million per month.
• Investing $444 million in security operating costs while implementing innovative patrol tactics
and improved deployment of public safety resources.
• Providing $226 million in municipal rent payments and payments of amounts in lieu of taxes
to cities, counties and municipalities under various property agreements.
• Committing $21 million toward on-going activities for the Clean Air Program at our port
facilities, and to reducing greenhouse gas emissions, promoting environmental protection,
and conserving energy.
19
22. 2010 Capital Budget Highlights
The 2010 capital budget totals $3.1 billion and includes:
• $1.6 billion - World Trade Center redevelopment
• $504 million - ARC Tunnel project
• $180 million - Advancing the JFK flight delay reduction program
• $175 million - New PATH rail car purchases and signal system
• $70 million - Dredging Program at Port Authority Ports
• $21 million – Planning for the modernization of the Central Terminal Building at La Guardia
Airport and Terminal A at Newark Liberty International Airport.
• $17 million – Completing a permanent ferry terminal in Hoboken, NJ.
• $16 million – Stewart International Airport modernization
• $15 million - Holland Tunnel rehabilitation of ventilation system
• $ 9 million - Continued planning efforts for the new Goethals Bridge
The capital budget also includes $326 million for essential security projects to protect the agency’s
facilities infrastructure and install state-of-the-art surveillance and detection equipment such as:
• $63 million - PATH tunnel mitigation project
• $15 million - In-line baggage screening for all airports
Combined with the $444 million in security operating costs, in 2010, the Port Authority will spend a total of
$770 million on security-related expenditures in, bringing the agency’s total investment in security to $5.2
billion since the terrorist attacks on September 11, 2001.
20
23. Sources of Funds
The Port Authority is a self-sustaining agency that relies upon its own creditworthiness to access the
capital markets to raise the necessary funds for the acquisition, operations and investment of its facilities.
It is not dependent on state or local taxes from New York or New Jersey and has no power to levy its own
taxes or assessments. The agency generally funds its operating and capital expenditures through
revenues generated by its facilities, the issuance of bonds, notes and other obligations, receipt of grants,
insurance proceeds and other contributions, financial income earned on its investments, and the
collection of Passenger Facility Charges (PFCs) at its airports.
Sources of Funds
$6.3 Billion
PFCs
3%
Grants and
Contributions
9% Gross
Operating
Financial
Revenues
Income
58%
1%
Bonds, Notes
and Other
29%
Tolls and
Fares
30%
Aviation
Fees
Rentals 17%
42%
Parking
Other 6%
5%
21
24. Uses of Funds
The 2010 Budget totals $6.3 billion and provides for $2.5 billion in expenses to operate the agency’s
facilities, $3.1 billion in capital expenditures to build and improve upon the region’s transportation capacity
and rebuild the World Trade Center site, $689 million for debt service on the agency’s outstanding bonds,
notes and other obligations, and $44 million for other expenditures, which are deferred and amortized in
future periods.
Uses of Funds
$6.3 Billion
Debt Service:
Operations and
Reserves
11%
Deferred Exp &
Other
1%
Operating
Capital Expenses
Expenditures 39%
49%
Security
Regional 18%
1% Rent
State of Debt
13%
Good Expense
Mandatory
Repair 4%
27%
19%
Management
Services
System 1 4%
Operatio ns
Security Enhancing
33%
10% 21%
Maint enance
Revenue 1 8%
Producing
22%
22
25. Net Income
The decline in activity levels at Port Authority facilities has caused 2010 revenues to be lower by $76
million, compared with the 2009 budget. These declining revenues, combined with increased interest
expense and lower financial income, result in an anticipated net loss to the agency of $39 million in 2010.
The facilities that generate net income - such as the airports, tunnels, and bridges - along with financial
income help pay for those facilities that operate at a loss - primarily the mass transit-oriented operations,
such as PATH, regional ferry services, and the bus terminals, as well as port terminals.
The graph below illustrates this split and compares 2010 net income to 2009.
Port Authority of New York & New Jersey
Comparison of 2010 and 2009 Budget Net Income/(Loss) From Operations
(in millions)
$600
$478
$457
$450
$330
$249
$300
$159
$150
$6 $12
$0
($57) ($39)
($150) ($107) ($125) ($111)
($155)
($180)
($300)
($336) ($341)
($450)
($600)
Airports Bridges & PATH Bus Ports World Regional,
Tunnels Terminal/Station Trade Ferries & Other Total
2009 2010
Budget Budget
23
26. Staffing
Staffing levels for 2010 decrease by 150 to a total of 6,977 – the lowest level in the 40 years – as the Port
Authority continues to restructure staff functions, streamline operations, leverage technology, and
reallocate positions to priority projects.
Seventy percent of Port Authority staff, in the functional areas of operations, security and maintenance,
are represented by unions through the collective bargaining process. The remaining non-represented
staff consists of engineering, technical, and management workforce.
2010 Staffing
Operating Line
Depts
48% Staff Services
13%
Operations
Services
6%
Engineering
8%
Public Safety
25%
The table on the next page shows staffing by major function:
24
27. BUDGETED POSITIONS FOR 2010
DEPARTMENT BY FUNCTION NUMBER
OPERATING LINE DEPARTMENTS
Aviation 958
Real Estate & WTC Redevelopment 80
Port Commerce 172
Rail / PATH 1,081
Tunnels, Bridges & Terminals 911
WTC Construction 116
PUBLIC SAFETY
Public Safety 1,725
Office of Emergency Management 18
ENGINEERING
Chief Engineer/Engineering 557
GENERAL SERVICES
Operations Services 444
STAFF SERVICES
Audit 77
Capital Security Projects 25
Chief Administrative Officer 9
Chief, Capital Planning 7
Chief Financial Officer 4
Chief Operating Officer 8
Chief, Public & Government Affairs 2
Chief, Real Estate & Development 2
Chief Technology Officer/Technology Services 105
Comptroller's 103
Executive Offices 9
General Counsel/Law 132
Government and Community Affairs 12
Human Resources (including Medical Services) 66
Inspector General 30
Labor Relations 11
Management and Budget 40
Marketing 28
Media Relations 9
Office of Business and Job Opportunity 13
Office of Environmental & Energy Programs 12
Office of Financial Analysis 7
Office of the Secretary 17
Office of Strategic Initiatives 4
Operations Standards 7
Planning 19
Priority Programs 8
Procurement 94
Project Management Office 9
Treasury 46
TOTAL POSITIONS 6,977
25
31. 2010 BUDGET SUMMARY BY LINE DEPARTMENT
AVIATION
Mission
Aviation’s mission aligns with the Port Authority’s at large as it recognizes and accepts its charge to
achieve regional prosperity through a unified system of airport facilities that have unsurpassed capacity
and quality and that moves people and goods through its five airports as efficiently as possible, with a
commitment to safety, security, unequalled customer service, and are environmentally sustainable and
community friendly.
Facilities
• John F. Kennedy International Airport (JFK)
• LaGuardia Airport (LGA)
• Newark Liberty International Airport (EWR)
• Stewart International Airport (SWF)
• Teterboro Airport (TEB)
Activity Levels
In 2010, approximately 104 million people are expected to use the Port Authority’s aviation facilities
compared to the revised estimate of 103 million people in 2009. While the anticipated increase in 2010
passenger levels is approximately 1 million, or 1%, it falls short of the projection of 106 million passengers
stated in the 2009 Budget and is 10% lower than the projections used to develop the Port Authority’s
$29.5 billion 2007 – 2016 Capital Plan. This is largely attributable to the global economic downturn,
which has adversely impacted the aviation industry at large. Passenger growth in the coming years is
expected to be slower than that projected prior to the economic downturn.
Aviation Activity Levels by Facilities
(in thousands)
50,000
40,000
JFK
Passengers
30,000 LGA
EWR
20,000
10,000
2001 2002 2003 2004 2005 2006 2007 2008 2009 2010
est bud
Years
29
32. Staffing
Aviation has a total of 958 staff, of which 783 are dedicated to operating and maintaining the airports.
The operations staff operates and manages the aeronautical, landside, security and customer care
functions, including compliance with Federal Aviation Administration rules and regulations. The
maintenance staff provides craft-based maintenance programs to ensure that the structural integrity of the
facilities’ assets, infrastructure and equipment are operating at a high level of performance, including
code and regulatory compliance. The remaining management services staff provide the functions that
support the facilities and line business operations, including capital program delivery; asset management;
property and revenue management; strategic, business planning and financial functions; airspace
modernization; security and environmental management; as well as facility management and
departmental oversight.
Revenues and Expenses
Aviation’s 2010 projected revenues of $2 billion are down $48 million from the 2009 budget. Significant
revenue sources include: fixed rentals from leases for airline terminals, hangars and cargo facilities,
concessions and aircraft services; flight fees from cost recovery agreements with airlines; fees and
charges, such as the AirTrain’s farebox revenues, utilities and fuel fees; and other airport activities such
as parking.
Aviation
Revenue by Categories
Parking
Percentage &
10%
Other Rentals
26% Other
4%
Flight Fees
Fixed Rent 29%
31%
Aviation projects expenses for 2010 of $1.3 billion that include payroll, technology services, rent, contract
services, and utilities. Through a significant cost-cutting effort, Aviation has been controlling expenses
with productivity improvements, a diminished consultant budget, and cost reductions to certain low priority
programs that are expected to offset contractual and inflationary increases.
30
33. Aviation
Operating & Maintenance Expenses
Rent Security
18% 17%
Debt Expense
6%
Management
Services
4%
Operations Maintenance
37% 18%
2010 Capital Budget Overview
The 2010 Aviation capital budget provides for $520 million in expenditures. A large part of the budget
will be used to enhance overall system capacity and security.
The 2010 capital priorities focus on addressing current challenges that include aging infrastructure, safety
and security, congestion/delays and federal caps on flights per hour imposed by the FAA, and customer
expectations.
Aviation
2010 Capital Budget
System
Enhancing
11%
Mandatory
11%
State of Good
Repair Revenue
57% Producing
11%
Security
10%
31
34. 2010 Capital Budget Highlights
2010
Project Description Budget Outcomes
1 JFK Flight Delay Reduction Replace the Bay runway as part of a flight $180 M Reduce maintenance costs and flight delays.
Program delay reduction initiative.
2 EWR Modernization of Construct additional gates and provide for $24 M Increase capacity for the airlines and airport.
Terminal B terminal expansion to meet expected growth in
air passenger traffic.
3 Stewart International Replace Airport Weather Instrumentation $16 M Increased operating capability and reliability
Airport Modernization Power Circuit; rehabilitate taxiway lighting; with replacement of aging infrastructure.
Terminal Improvements; Customer Service
Initiatives.
4 LGA Central Terminal Provide planning dollars to begin the $15 M Enhance facility operations and replace
Replacement Planning modernization of the Central Terminal Building. increasingly obsolete terminal building.
5 TEB Engineering Material Begin construction for Runway 1-19 Safety $15 M Increase safety and meet FAA standards.
Arresting System (EMAS) Enhancements installing the arrestor system
and Redneck Avenue and relocating Redneck Avenue.
Relocation
6 EWR Rehabilitation of Install modifications to drainage, milling, $6.2 M Reduce maintenance costs and flight delays.
Runways pavement, depth and upgrade of lighting per
FAA standards.
7 EWR Terminal A Planning Provide planning dollars for renewal or $6 M Increase airport capacity and replace aging
replacement of aging terminal building to infrastructure.
increase airport capacity.
32
35. PATH
Mission
PATH’s mission is guided by the Port Authority’s goals to excel in the delivery of a safe, reliable, and
cost-effective transportation service that operates as a critical link in the regional transportation network,
contributing to regional mobility and economic development and serving as stewards of the regional
environment by providing efficient mass transit service and effectively managing energy resources.
Facilities
• PATH Rail Transit System
Stations in New York Stations in New Jersey
th
9 Street Exchange Place
th
14 Street Grove Street
rd
23 Street Harrison
rd
33 Street Hoboken
Christopher Street Journal Square
World Trade Center Newark Penn Station
Pavonia / Newport
• Journal Square Transportation Center
Activity Levels
PATH ridership is expected to decline by 2.3% in 2010 to approximately 71 million passenger trips
compared to the estimated 73 million in 2009. This represents a 5.5% drop from the original projection of
77 million passenger trips in the 2009 budget and is 11.8% lower than the projections used to develop the
Port Authority’s $29.5 billion 2007 – 2016 Capital Plan. The rate of annual ridership growth is expected to
decline through 2010 as the New York-New Jersey region continues to experience the impacts of the
recession. However, the long-term demand for PATH service is expected to increase as the new World
Trade Center Transportation Hub is completed and significant commercial development advances along
the New Jersey waterfront and other areas within the PATH service region.
33
36. PATH Activity Levels by Station
(in thousands)
20,000 9th St.
18,000 14th St.
16,000 23rd St.
14,000 33rd St.
Passengers
12,000 Christopher St.
10,000 WTC
8,000 Exchange Pl.
6,000 Grove St.
4,000 Harrison
2,000 Hoboken
0 Journal Sq.
2000 2001 2002 2003 2004 2005 2006 2007 2008 2009 2010 Newark
est bud
Pavonia / Newport
Years
Staffing
PATH has a total of 1,081 staff, of which 1,021 are dedicated to operating and maintaining a full service
rail transit system and bus terminal. The operations staff operate and manage the dispatching and
movement of trains in and out of the stations and yards, develop and maintain train schedules, and
provide passenger information and customer care programs throughout the stations, including
compliance with Federal Railroad Administration rules and regulations. The maintenance staff ensures
that the railcars are inspected, repaired and perform at a high level; maintains and replaces tracks, station
structures and operating equipment; and services the signals and power distributions systems to ensure
safe and efficient train movement. The remaining management services staff provide the functions that
support the facilities and line business operations, including capital program delivery; asset management;
rail operations planning; property and revenue management; strategic business planning and financial
functions; security and environmental management; and facility management and departmental oversight.
34
37.
38. 2010 Capital Budget Overview
The 2010 PATH capital budget provides for a total of $357 million in expenditures. A large part of the
expenditures will be used towards the PATH modernization program, which includes replacing rail cars
with a new, 340 car fleet, signal system, and upgrading all stations. The 2010 Capital Plan also includes
projects designed to maintain PATH’s aging assets, including track, substations, and communications
equipment.
PATH
2010 Capital Budget
System
Enhancing
State of Good 2%
Repair
63%
Mandatory
1%
Security
34%
2010 Capital Budget Highlights
2010
Project Description Budget Outcomes
1 Safety and Security Enhance system access control and overall $120 M Enhance the safety and security of the
Projects operational safety and security enhancements. system.
2 New Car Purchase Replacement of aging railcar fleet with 340 $110 M Improve service reliability and customer
Program new rail cars. service.
3 Signal System Replace outdated current signal system with a $65 M Increase capacity due to shorter headways.
Replacement modern computerized system.
Program
4 State of Good Repair Comprehensive maintenance and $52 M Improve service reliability.
Program rehabilitation program to ensure the integrity of
the infrastructure
5 PATH Station Enhanced information displays, install new $6 M Improve customer service.
Improvement lighting, and upgraded seating.
Program
36
39. PORT COMMERCE
Mission
Port Commerce activities support the Port Authority’s mission to develop and maintain secure,
competitive port infrastructure and services for New York and New Jersey, expediting the movement of
international cargo and supporting the regional economy in a financially sound manner. Port Commerce
also aims to minimize the impact to the environment, conserve natural resources and support
sustainable growth, particularly with respect to reducing pollutant air and greenhouse gas emissions.
Facilities
• Port Newark
• Elizabeth – Port Authority Marine Terminal
• Brooklyn – Port Authority Marine Terminal
• Howland Hook Marine Terminal
• Greenville Yard – Port Authority Marine Terminal
• Port Jersey – Port Authority Marine Terminal
• NY/NJ Rail LLC
• Red Hook Container Terminal
Activity Levels
In 2010, the agency's port facilities expect to handle 2.7 million containers, a slight recovery of 2% from
estimated 2009 container activity. However, this represents a 14.1% drop from the original projection of
3.2 million containers in the 2009 budget and is 15.6% lower than the projections used to develop the
Port Authority’s $29.5 billion 2007 – 2016 Capital Plan. While cargo volumes are expected to be
significantly less than projected prior to the economic slowdown, a 3-4% annual growth rate is anticipated
in the years ahead as the economy begins to recover.
37
40. Port Activity Levels by Facilities
(in thousands)
2,500
Elizabeth Marine
2,000 Terminal
Containers
1,500 Port Newark
1,000 Howland Hook
500 Red Hook
0
2001 2002 2003 2004 2005 2006 2007 2008 2009 2010
est bud
Years
Staffing
Port Commerce has a total of 172 staff, of which 105 are dedicated to operating and maintaining the
marine terminals and port system. The operations and maintenance staff operate and manage the
berths, roadways, rail facilities, multi-tenant properties, and common utilities at the marine terminals to
expedite the movement of international cargo that supports the regional economy, including code and
regulatory compliance. The remaining management services staff provides the functions that support the
facilities and line business operations, including capital program delivery; asset management; terminal
properties and waterways management; cargo and revenue management; strategic, business planning
and financial functions; security and environmental management; as well as facility management and
departmental oversight.
Revenues and Expenses
Port Commerce anticipates $213 million in gross revenues in 2010, which is almost $7 million lower than
the 2009 budget. Seventy-eight percent of these revenues consist primarily of land and building rentals
related to containers, autos, warehouse operations and bulk storage. The remaining sources of revenue
are from percentage and other rentals that are derived from container throughput, intermodal rail and
dockage and wharfage.
38
41.
42. 2010 Capital Budget Overview
The Port Commerce 2010 capital plan of $200 million reflects the challenges posed by the economic
downturn and its effects on the shipping industry. Port Commerce’s capital plan includes the necessary
investments that will enable the Port Authority to sustain port growth over the next decade. This
investment includes an improved transportation infrastructure that will alleviate truck traffic and port
congestion and deepen channels and berths, allowing for more cost-efficient and environmentally
conscious transportation of cargo.
Port Commerce
2010 Capital Budget
Mandatory
39%
Revenue
Producing
6%
System
Enhancing Security
35% 5%
State of Good
Repair
15%
2010 Capital Budget Highlights
2010
Project Description Budget Outcomes
1 Harbor Deepening Continue deepening NY/NJ Harbor’s main $70M Improve navigational safety and provides
Program channels to 50 feet. waterside access for larger vessels, expediting
the movement of international cargo.
2 Infrastructure Maintain Port Commerce assets to ensure a $35 M Ensure the long-term safety and reliability of
Program state of good repair. Port Commerce assets while reducing day-to-
day maintenance costs.
3 Roadway Improve and expand capacity of the port $15 M Reduce roadway congestion, reduce pollution,
Improvement marine terminal roadway system. and improve roadway safety.
Program
4 Security Program Install Security ID System (TWIC) and $10 M Ensure compliance with Federal regulations
complete the Closed Circuit TV and improve overall Port security.
implementation.
5 Intermodal Rail Continue construction of a comprehensive rail $6 M Diversify modes of transporting goods and
Program system throughout the Port. prevent increased truck pollution and provide
a growing revenue source.
40
43. TUNNELS, BRIDGES, AND TERMINALS (TB&T)
Mission
The heart of the TB&T mission is aligned with the Port Authority's goals by connecting the road networks
of New York and New Jersey with tunnels, bridges and bus terminals that permit people and goods to
move safely, efficiently and conveniently by operating facilities that are safe, secure, reliable, well
maintained and easy to use; providing service levels that instill customer confidence and satisfaction;
coordinating with other agencies to ensure integrated transportation systems; and improving traffic flow,
efficiency and travel reliability through innovative technology and new work practices thereby
strengthening the region’s economic competitiveness.
Facilities
• Bayonne Bridge
• Goethals Bridge
• George Washington Bridge (GWB)
• George Washington Bridge Bus Station (GWBBS)
• Holland Tunnel
• Lincoln Tunnel
• Outerbridge Crossing
• Port Authority Bus Terminal (PABT)
Activity Levels
After record levels of traffic in recent years, it is expected that TB&T’s facilities will handle 122 million
eastbound cars, buses, and trucks in 2010, 6.1% lower than the projections used to develop the Port
Authority’s $29.5 billion 2007 – 2016 Capital Plan but 0.3% higher than the 2009 budget but is. While this
is a slight increase in total vehicles, truck traffic is projected to decline by 5.3% in 2010 on top of a 6.2%
drop estimated in 2009 activity compared to the 2009 budget. Despite this decline, TB&T continues to
anticipate long-term growth in its business.
41
44. Traffic Activity at TB&T Facilities
(in thousands)
60,000 Holland tunnel
50,000
Lincoln tunnel
40,000
George Washington
Volume
Bridge
30,000
Bayonne Bridge
20,000
Geothals Bridge
10,000
Outerbridge
- Crossing
2000 2001 2002 2003 2004 2005 2006 2007 2008 2009 2010
Year Est Bud
Staffing
TB&T has a total of 911 staff, of which 770 are dedicated to operating and maintaining the bridges,
tunnels and bus terminal facilities. The operations staff manages vehicular traffic through the bridges and
tunnels and passenger traffic at our bus terminals, as well as toll collection, emergency response and
customer care programs. The maintenance staff manages the facilities assets through a comprehensive
preventive maintenance program to ensure that the integrity of the assets, infrastructure and equipment are
operating at a high level of performance, including code and regulatory compliance. The remaining management
services staff provide the functions that manage and support the facilities and line business operations, including
capital program delivery; asset management; operational and transportation planning; revenue management
including oversight of our electronic tolling system; strategic business planning; security and environmental
management; as well as facility management and departmental oversight.
Revenues and Expenses
TB&T forecasts 2010 revenues of $1 billion, consisting 96% of toll revenues from the bridge and tunnel
crossings, along with rentals from the bus terminals, advertising and parking revenues. Revenues are
expected to decline from 2009 levels mainly due to truck traffic declines associated with the depressed
regional economic conditions.
42
45. TB&T
Revenue by Categories
Rentals
3%
Tolls
96%
Parking
1%
TB&T’s total 2010 operating budget is $451 million, allocated as follows:
TB&T
Operating & Maintenance Expenses
Operations
41%
Maintenance
22%
Rent
Management 1%
Services
7% Security
29%
43
46. 2010 Capital Budget Overview
The 2010 TB&T capital budget provides for expenditures totaling $161 million, 65% of which is geared
toward rehabilitating and maintaining the facilities in a state of good repair.
TB&T
2010 Capital Budget
System
Enhancing
10%
State of Mandatory
Good Repair 5%
65%
Revenue
Producing
2%
Security
18%
2010 Capital Budget Highlights
2010
Project Description Budget Outcomes
1 Holland Tunnel Rehabilitation of ventilation fan blowers and $15 M Provide an upgraded and modernized tunnel
Rehabilitation of motors in all four vent buildings, new ventilation system.
Ventilation System automatic control system, and new low and
high voltage switch gear.
2 Goethals Bridge Planning dollars to replace the existing $8.8 M Create safer, more efficient mobility between
Replacement Goethals Bridge with a new six-lane bridge. New York and New Jersey once a new bridge
is reconstructed.
3 All-Electronic Tolling Prepare a new toll collection system with $7.6 M Enhance system capacity and seamless traffic
(AET) cashless (AET) capability. flow when AET is fully implemented.
4 Bayonne Bridge Study Provide a market driven cost-effective plan for $5 M Study alternatives to evaluate the replacement
determining the future of the Bayonne Bridge. of the Bayonne Bridge.
5 Lincoln Tunnel Helix Replace approximately 44,000 sf of bus ramp 5.6 M Ensure a state of good repair at the Lincoln
and Bus Ramp concrete panels and complete the Helix Tunnel and prepare for future traffic growth.
Rehabilitation design to ensure the structural integrity of the
facility.
6 Planning for the Planning dollars for the replacement of all 592 $2.1 M Ensure the long-term safety and functionality
George Washington suspender ropes and rehabilitate main cables of the George Washington Bridge.
Bridge Suspender to a state of good repair.
Rope Replacement
and Main Cable
Rehabilitation
44
47. DEVELOPMENT, REAL ESTATE and ARC
Mission
To identify and advance strategic business initiatives and operate facilities that enhance the Port
Authority’s financial capacity; stimulate private investment in agency facilities and host communities;
promote safe and sustainable regional economic growth; and facilitate expansion of an efficient, safe,
secure and reliable regional transit system by partnering with NJ Transit to develop and deliver a safe,
secure and reliable high-quality transit system that significantly expands the Trans-Hudson commuter rail
network and substantially increases station capacity in Midtown Manhattan.
Facilities
• Bathgate Industrial Park
• Essex County Resource Recovery Facility
• Ferry Transportation
• Industrial Park at Elizabeth
• The Legal Center
• The Teleport
• Waterfront Development
- Queens West Waterfront Development
- The South Waterfront at Hoboken
• Access to the Region’s Core’s Tunnel (ARC)
Staffing
Development, Real Estate and ARC have a total of 64 staff, of which 55 are dedicated to identifying and
advancing new revenue opportunities; negotiating cost-effective property acquisitions and sales, land
swaps, development agreements and leases; and operating, maintaining and managing facilities and
other programs aimed at optimizing financial return to the agency and supporting regional economic
growth. This includes industrial and commercial properties, ferry transportation, and waterfront
developments as well as partnering with New Jersey Transit to deliver the ARC Tunnel. The remaining
management services staff provides the functions that support the development activities, including
financial analysis, planning and human resource functions; and security and environmental management.
45
48. Revenues and Expenses
Projected 2010 revenues for development activities are $93 million, a decrease of almost $10 million from
the 2009 budget. Revenue largely consists of gate/tipping fees and the sale of electricity from the Essex
County Resource Recovery Facility and rents generated by terms of existing agreements.
Development
Revenue by Categories
Fixed Rent
16% Variable/
Electricity
33%
Gate/Tipping
Fees NLC Net
47% Lease
4%
Development’s operating budget for 2009 is $86 million.
Development
Operating & Maintenance Expenses
Rent
9%
Security
2%
Management
Services
Operations
5%
81%
Maintenance
3%
46
49. 2010 Capital Budget Overview
Development’s 2010 capital budget totals $22 million, not including the ARC project. The 2010 ARC
capital budget totals $504 million; nearly 80% of capital expenditures will be used for site acquisitions and
is not reflected in the chart below.
Development
2010 Capital Budget
Mandatory
16%
System
Enhancing Security
63% 7%
State of Good
Repair
14%
2010 Capital Budget Highlights
2010
Project Description Budget Outcomes
1 Access to the Partner with NJ Transit to construct a new $504 M ARC will double capacity between NJ and
Region's Core’s commuter rail line under the Hudson River midtown Manhattan to meet growing
Tunnel (ARC) and expand NY Penn Station. ridership demand, improve service, reduce
emissions and create new construction and
permanent jobs.
2 Ferry Advance PA share of work to rehabilitate and $17 M Improve regional ferry service.
Transportation return ferry service to the Hoboken Ferry
Terminal.
3 New York-New Fund land acquisition for conservation, $14M Preserve open space throughout the
Jersey Harbor ecological enhancement, public access, or Hudson-Raritan Estuary in the states of
Estuary Program environmental mitigation to offset New Jersey and New York.
environmental impact of PA’s port facilities.
4 Queens West Fund remaining PA commitment for property $4.2M Revitalize underutilized waterfront area into
Waterfront acquisition, planning, infrastructure and other successful a residential, commercial, and
Development predevelopment costs. recreational development, create new
business opportunities, and stimulate
development in the surrounding area.
5 George Redevelop and construct a modernized bus $3 M Higher quality transportation services,
Washington station and retail complex bringing new improvement in intermodal connections,
Bridge Bus construction and permanent jobs to the new electronic communications, transit
Station community as well as increased retail oriented retail and enhanced architectural
Redevelopment services. qualities.
47
50. WORLD TRADE CENTER
Mission
To redevelop and operate the World Trade Center site by directly managing projects controlled by the
Port Authority, overseeing elements controlled by third parties, and constructing key site elements
thereby creating a safe, secure, environmentally-sustainable, financially successful and physically
integrated complex that anchors the revitalization of Lower Manhattan and enhances the Port Authority’s
financial capacity while honoring those lost on 9/11.
Staffing
World Trade Center activities employ a total of 134 staff, of which 116 are dedicated to rebuilding the
WTC Site by managing the design guidelines, contracting for and constructing capital program elements
and overseeing the different construction managers and contractors on the site. The remaining staff
manage all real estate issues associated with development of the entire site including oversight of Master
Plan components controlled by the Agency and by third parties; development and leasing of One WTC
and the 460,000-square-foot retail complex; other site development; financial analysis; as well as
operations, management and maintenance of project components as they are completed.
Revenues and Expenses
World Trade Center projected revenues for 2010 are $152 million, which primarily consist of World Trade
Center leases, intercompany rent and rentals. Revenue estimates are based on terms of existing
agreements.
World Trade Center
Revenue by Categories
Intercompany
Rent
WT Leases 41%
52%
Fixed Rent
7%
48