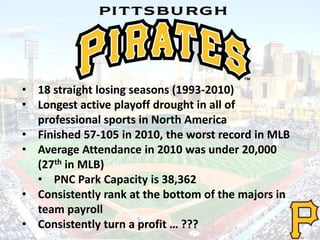
• 18 straight losing seasons (1993-2010)
• Longest active playoff drought in all of
professional sports in North America
• Finished 57-105 in 2010, the worst record in MLB
• Average Attendance in 2010 was under 20,000
(27th in MLB)
• PNC Park Capacity is 38,362
• Consistently rank at the bottom of the majors in
team payroll
• Consistently turn a profit … ???
• The Pirates made $34.8 million in profit over the
past three years.
• In 2008, the Pirates spent $23.1 million on player
development.
• This spending on development was more than
both the Angels ($16.3M) & Mariners ($15.5M)
• This spending was on par with the Marlins
($29.9M) & Rays ($21.9M)
• The Pirates had a $51 million payroll in 2008, yet
finished last in the NL Central.
• Aided by a $39 million payout in revenue sharing,
the Pirates turned $14.4 million in profit.
http://www.pittsburghlive.com/x/pittsburghtrib/sports/pirates/s_696195.html
http://www.forbes.com/lists/2011/33/baseball-valuations-11_Pittsburgh-Pirates_339965.html
Financial
Ratio
Current Month
7/31/2009
Year Ended
10/31/2008
Current Ratio $1.84 $2.47
Cash Ratio $0.40 $0.04
Total Debt Ratio $0.70 $0.65
Debt-Equity Ratio $2.33 $1.86
Note: The current liabilities for the
Current Month of 7/31/2009 is far
higher then that for the Year Ended
10/38/2008 because of a staggering
increase in unearned revenue.
Unearned revenues for the current
month were $16,986, while
unearned revenue for the previous
year was only $1,746.
Note: Cash and cash equivalents for the
current month are drastically higher then in
the previous year. This formula is an
indicator of the extent to which a company
can pay current liabilities without relying on
the sale of inventory and the receipt of
accounts receivables. The Pittsburgh Pirates
had to rely far more on the sale of inventory
and the receipt of accounts receivables in
the previous year ending 10/31/2008
compared to the current month 7/31/2009.
Financial Ratio 2007 2008
Times Interest
Earned
3.08 Times Covered 3.57 Times Covered
Asset Turnover
Ratio
$0.59 $0.62
Net Profit Margin
(in terms of Revenue Sharing)
$0.50 $0.37
In 2008, The Pirates generated 37 cents in profit for every dollar in revenue sharing
dollars. In 2007, They generated almost 50 cents in profit for every dollar they got
from revenue sharing.
In COMPARISON, the Pirates only generated 14,408,429/34,422,311= .41 cents per
gate receipts in 2007.
This just shows that in 2007, the Pirates were much more profitable off the
revenue sharing than they were from their own gate receipts!
Gate Receipts $32,129,368 $103,209,000 $20,985,000 $39,013,069 $66,324,000
MLB Revenue Sharing $39,046,312 ($14,747,000) $47,982,000 $35,345,277 ($16,174,000)
MLB Central Fund $20,306,730 $27,191,000 $31,298,000 $19,778,648 $28,132,000
Local Broadcasting $18,700,434 $42,967,000 $15,900,000 $13,444,475 $64,365,000
Concessions $8,283,870 $16,516,000 $2,268,000 $9,551,348 $11,240,000
Total Income $145,993,437 $237,869,000 $139,647,000 $160,961,576 $216,200,000
Player Salaries $51,040,233 $142,138,000 $29,739,000 $56,018,335 $119,408,000
Player Development $23,182,677 $16,339,000 $29,970,000 $21,900,693 $15,534,000
Total Expenditures $124,203,035 $226,615,000 $100,433,000 $146,759,370 $223,872,000
Profit (after taxes) $14,408,249 $7,088,000 $29,462,000 $4,016,163 ($4,533,000)
Pos.Player Salary
SPPaul Maholm $6,250,000
CChris Snyder $6,250,000
CRyan Doumit $5,200,000
1BLyle Overbay $5,000,000
SPKevin Correia $4,000,000
RFMatt Diaz $2,125,000
3BPedro Alvarez $2,050,000
SPRoss Ohlendorf $2,025,000
SSRonny Cedeño $1,850,000
CLJoel Hanrahan $1,400,000
RPJeff Karstens $1,100,000
RPJosé Veras $1,000,000
RPEvan Meek $461,500
RFGarrett Jones $455,500
CFAndrew McCutchen $452,500
Pos.Player Salary
SPScott Olsen $450,000
SPJames McDonald $443,000
LFJohn Bowker $441,500
SPCharlie Morton $441,000
2BNeil Walker $437,000
RPChris Resop $431,500
RPGarrett Olson $430,000
LFJosé Tábata $428,000
1BSteve Pearce $427,500
CJason Jaramillo $422,500
SPKevin Hart $417,000
RPJosé Ascanio $416,000
SPBrad Lincoln $414,500
RPMike Crotta $414,000
SSJosh Rodriguez $414,000
BOLD = Opening Day Starter RED = Disabled List
Pos.Player Salary Pos.Player Salary Pos.Player Salary Pos.Player Salary
SPPaul Maholm $6,250,000 LFMatt Holliday $16,317,774 1BPrince Fielder $15,500,000 3BAlex Rodriguez $32,000,000
CChris Snyder $6,250,000 1BAlbert Pujols $14,508,395 SPZack Greinke $13,500,000 SPCC Sabathia $24,285,714
CRyan Doumit $5,200,000 SPChris Carpenter $14,259,403 SPRandy Wolf $9,500,000 1BMark Teixeira $23,125,000
1BLyle Overbay $5,000,000 SPKyle Lohse $12,187,500 RFCorey Hart $6,833,333 SPA.J. Burnett $16,500,000
SPKevin Correia $4,000,000 RFLance Berkman $8,000,000 2BRickie Weeks $4,500,000 CLMariano Rivera $14,911,700
RFMatt Diaz $2,125,000 SPJake Westbrook $8,000,000 SSYuniesky Betancourt $4,300,000 SSDerek Jeter $14,729,364
3BPedro Alvarez $2,050,000 SPAdam Wainwright $6,687,500 LFRyan Braun $4,287,500 C/DHJorge Posada $13,100,000
SPRoss Ohlendorf $2,025,000 CYadier Molina $5,312,500 RPLaTroy Hawkins $4,250,000 2BRobinson Canó $10,000,000
SSRonny Cedeño $1,850,000 SSRyan Theriot $3,300,000 SPShaun Marcum $3,950,000 RPRafael Soriano $10,000,000
CLJoel Hanrahan $1,400,000 CLRyan Franklin $3,250,000 SPYovani Gallardo $3,500,000 RFNick Swisher $9,100,000
Total $36,150,000 Total $91,823,072 Total $70,120,833 Total $167,751,778
Average $3,615,000 Average $9,182,307 Average $7,012,083 Average $16,775,178
Gary Gillette, a former co-chair of the Society for
American Baseball Research's business of baseball
committee, said the Pirates likely are better served
by putting their profits into player development.
"The underlying issue is one of trust in the ownership
and management of the team," Gillette said. "Even if
they spend an extra $20 million this year, there's not
a player out there who they could get who would
make a difference. And given how they said they
want to build through the draft, it would almost
seem irresponsible to do that. But the average
fan doesn't want to hear that."
http://www.pittsburghlive.com/x/pittsburghtrib/sports/pirates/s_696195.html
2008 – 2nd overall selection – Vanderbilt University
Born in Santo Domingo, D.R. / Raised in Washington Heights
Originally drafted in 2005 by the Boston Red Sox in 14th round
Currently: Starting Third Baseman for the Pittsburgh Pirates
In 2008, signed a 4-year contract for $8.15 million
Guaranteed $6M in signing bonuses payable over 2009 & 2010
2009 – 4th overall selection – Boston College
Born and Raised in Miami, Florida
Currently: Catcher for Pittsburgh AA-Affiliate Altoona Curve
Rated #46 Prospect for 2011 by Baseball America
In 2009, signed a deal with a signing bonus of $2.475 million
2010 – 2nd overall selection – The Woodlands High School (TX)
Born in Winter Haven, Florida / Raised in The Woodlands, Texas
Currently: Starting Pitcher in extended Spring Training
Rated #11 Prospect for 2011 by Baseball America
In 2010, signed a deal for $5 million with a $6.5M signing bonus
At age 19, received the 2nd highest signing bonus in draft history
The Pittsburgh Post-Gazette took 10 popularly expressed views about the Pirates and
challenged, through a series of interviews, their top three men -- owner Bob Nutting,
president Frank Coonelly and general manager Neal Huntington -- to address whether those
are myth or reality: 1. The owner doesn’t care.
2. They pocket big profits.
3. Payroll will never rise.
4. Why must fans show up first?
5. All they need is welfare.
6. The players will leave.
7. The window is too short.
8. They won’t pay for talent.
9. They’ll never sign an impact player.
10.They’ll never win.
http://www.post-gazette.com/pg/11091/1136179-63.stm
Based on these numbers, we can project that the Pirates are nowhere near
contending. With their basic philosophy of drafting talent and trading away for
more prospects, the team is looking at another five year stretch of approximately
65 wins and 97 losses, making fans in Pittsburgh uneasy into the future. Ironically,
the team has been consistent in their wins and losses plateau, but this alone has
to be worrisome to the fans in Pittsburgh.
YEAR W L PCT.
2006 67 95 .414
2007 68 94 .420
2008 67 95 .414
2009 62 99 .385
2010 57 105 .352
Pittsburgh Pirates Financial Analysis

Pittsburgh Pirates Financial Analysis

  • 2.
    • 18 straightlosing seasons (1993-2010) • Longest active playoff drought in all of professional sports in North America • Finished 57-105 in 2010, the worst record in MLB • Average Attendance in 2010 was under 20,000 (27th in MLB) • PNC Park Capacity is 38,362 • Consistently rank at the bottom of the majors in team payroll • Consistently turn a profit … ???
  • 3.
    • The Piratesmade $34.8 million in profit over the past three years. • In 2008, the Pirates spent $23.1 million on player development. • This spending on development was more than both the Angels ($16.3M) & Mariners ($15.5M) • This spending was on par with the Marlins ($29.9M) & Rays ($21.9M) • The Pirates had a $51 million payroll in 2008, yet finished last in the NL Central. • Aided by a $39 million payout in revenue sharing, the Pirates turned $14.4 million in profit. http://www.pittsburghlive.com/x/pittsburghtrib/sports/pirates/s_696195.html
  • 4.
  • 5.
    Financial Ratio Current Month 7/31/2009 Year Ended 10/31/2008 CurrentRatio $1.84 $2.47 Cash Ratio $0.40 $0.04 Total Debt Ratio $0.70 $0.65 Debt-Equity Ratio $2.33 $1.86 Note: The current liabilities for the Current Month of 7/31/2009 is far higher then that for the Year Ended 10/38/2008 because of a staggering increase in unearned revenue. Unearned revenues for the current month were $16,986, while unearned revenue for the previous year was only $1,746. Note: Cash and cash equivalents for the current month are drastically higher then in the previous year. This formula is an indicator of the extent to which a company can pay current liabilities without relying on the sale of inventory and the receipt of accounts receivables. The Pittsburgh Pirates had to rely far more on the sale of inventory and the receipt of accounts receivables in the previous year ending 10/31/2008 compared to the current month 7/31/2009.
  • 6.
    Financial Ratio 20072008 Times Interest Earned 3.08 Times Covered 3.57 Times Covered Asset Turnover Ratio $0.59 $0.62 Net Profit Margin (in terms of Revenue Sharing) $0.50 $0.37 In 2008, The Pirates generated 37 cents in profit for every dollar in revenue sharing dollars. In 2007, They generated almost 50 cents in profit for every dollar they got from revenue sharing. In COMPARISON, the Pirates only generated 14,408,429/34,422,311= .41 cents per gate receipts in 2007. This just shows that in 2007, the Pirates were much more profitable off the revenue sharing than they were from their own gate receipts!
  • 7.
    Gate Receipts $32,129,368$103,209,000 $20,985,000 $39,013,069 $66,324,000 MLB Revenue Sharing $39,046,312 ($14,747,000) $47,982,000 $35,345,277 ($16,174,000) MLB Central Fund $20,306,730 $27,191,000 $31,298,000 $19,778,648 $28,132,000 Local Broadcasting $18,700,434 $42,967,000 $15,900,000 $13,444,475 $64,365,000 Concessions $8,283,870 $16,516,000 $2,268,000 $9,551,348 $11,240,000 Total Income $145,993,437 $237,869,000 $139,647,000 $160,961,576 $216,200,000 Player Salaries $51,040,233 $142,138,000 $29,739,000 $56,018,335 $119,408,000 Player Development $23,182,677 $16,339,000 $29,970,000 $21,900,693 $15,534,000 Total Expenditures $124,203,035 $226,615,000 $100,433,000 $146,759,370 $223,872,000 Profit (after taxes) $14,408,249 $7,088,000 $29,462,000 $4,016,163 ($4,533,000)
  • 8.
    Pos.Player Salary SPPaul Maholm$6,250,000 CChris Snyder $6,250,000 CRyan Doumit $5,200,000 1BLyle Overbay $5,000,000 SPKevin Correia $4,000,000 RFMatt Diaz $2,125,000 3BPedro Alvarez $2,050,000 SPRoss Ohlendorf $2,025,000 SSRonny Cedeño $1,850,000 CLJoel Hanrahan $1,400,000 RPJeff Karstens $1,100,000 RPJosé Veras $1,000,000 RPEvan Meek $461,500 RFGarrett Jones $455,500 CFAndrew McCutchen $452,500 Pos.Player Salary SPScott Olsen $450,000 SPJames McDonald $443,000 LFJohn Bowker $441,500 SPCharlie Morton $441,000 2BNeil Walker $437,000 RPChris Resop $431,500 RPGarrett Olson $430,000 LFJosé Tábata $428,000 1BSteve Pearce $427,500 CJason Jaramillo $422,500 SPKevin Hart $417,000 RPJosé Ascanio $416,000 SPBrad Lincoln $414,500 RPMike Crotta $414,000 SSJosh Rodriguez $414,000 BOLD = Opening Day Starter RED = Disabled List
  • 9.
    Pos.Player Salary Pos.PlayerSalary Pos.Player Salary Pos.Player Salary SPPaul Maholm $6,250,000 LFMatt Holliday $16,317,774 1BPrince Fielder $15,500,000 3BAlex Rodriguez $32,000,000 CChris Snyder $6,250,000 1BAlbert Pujols $14,508,395 SPZack Greinke $13,500,000 SPCC Sabathia $24,285,714 CRyan Doumit $5,200,000 SPChris Carpenter $14,259,403 SPRandy Wolf $9,500,000 1BMark Teixeira $23,125,000 1BLyle Overbay $5,000,000 SPKyle Lohse $12,187,500 RFCorey Hart $6,833,333 SPA.J. Burnett $16,500,000 SPKevin Correia $4,000,000 RFLance Berkman $8,000,000 2BRickie Weeks $4,500,000 CLMariano Rivera $14,911,700 RFMatt Diaz $2,125,000 SPJake Westbrook $8,000,000 SSYuniesky Betancourt $4,300,000 SSDerek Jeter $14,729,364 3BPedro Alvarez $2,050,000 SPAdam Wainwright $6,687,500 LFRyan Braun $4,287,500 C/DHJorge Posada $13,100,000 SPRoss Ohlendorf $2,025,000 CYadier Molina $5,312,500 RPLaTroy Hawkins $4,250,000 2BRobinson Canó $10,000,000 SSRonny Cedeño $1,850,000 SSRyan Theriot $3,300,000 SPShaun Marcum $3,950,000 RPRafael Soriano $10,000,000 CLJoel Hanrahan $1,400,000 CLRyan Franklin $3,250,000 SPYovani Gallardo $3,500,000 RFNick Swisher $9,100,000 Total $36,150,000 Total $91,823,072 Total $70,120,833 Total $167,751,778 Average $3,615,000 Average $9,182,307 Average $7,012,083 Average $16,775,178
  • 10.
    Gary Gillette, aformer co-chair of the Society for American Baseball Research's business of baseball committee, said the Pirates likely are better served by putting their profits into player development. "The underlying issue is one of trust in the ownership and management of the team," Gillette said. "Even if they spend an extra $20 million this year, there's not a player out there who they could get who would make a difference. And given how they said they want to build through the draft, it would almost seem irresponsible to do that. But the average fan doesn't want to hear that." http://www.pittsburghlive.com/x/pittsburghtrib/sports/pirates/s_696195.html
  • 11.
    2008 – 2ndoverall selection – Vanderbilt University Born in Santo Domingo, D.R. / Raised in Washington Heights Originally drafted in 2005 by the Boston Red Sox in 14th round Currently: Starting Third Baseman for the Pittsburgh Pirates In 2008, signed a 4-year contract for $8.15 million Guaranteed $6M in signing bonuses payable over 2009 & 2010 2009 – 4th overall selection – Boston College Born and Raised in Miami, Florida Currently: Catcher for Pittsburgh AA-Affiliate Altoona Curve Rated #46 Prospect for 2011 by Baseball America In 2009, signed a deal with a signing bonus of $2.475 million 2010 – 2nd overall selection – The Woodlands High School (TX) Born in Winter Haven, Florida / Raised in The Woodlands, Texas Currently: Starting Pitcher in extended Spring Training Rated #11 Prospect for 2011 by Baseball America In 2010, signed a deal for $5 million with a $6.5M signing bonus At age 19, received the 2nd highest signing bonus in draft history
  • 16.
    The Pittsburgh Post-Gazettetook 10 popularly expressed views about the Pirates and challenged, through a series of interviews, their top three men -- owner Bob Nutting, president Frank Coonelly and general manager Neal Huntington -- to address whether those are myth or reality: 1. The owner doesn’t care. 2. They pocket big profits. 3. Payroll will never rise. 4. Why must fans show up first? 5. All they need is welfare. 6. The players will leave. 7. The window is too short. 8. They won’t pay for talent. 9. They’ll never sign an impact player. 10.They’ll never win. http://www.post-gazette.com/pg/11091/1136179-63.stm
  • 17.
    Based on thesenumbers, we can project that the Pirates are nowhere near contending. With their basic philosophy of drafting talent and trading away for more prospects, the team is looking at another five year stretch of approximately 65 wins and 97 losses, making fans in Pittsburgh uneasy into the future. Ironically, the team has been consistent in their wins and losses plateau, but this alone has to be worrisome to the fans in Pittsburgh. YEAR W L PCT. 2006 67 95 .414 2007 68 94 .420 2008 67 95 .414 2009 62 99 .385 2010 57 105 .352