This document is a thesis submitted to Mount Holyoke College examining factors that influence the outcome of U.S. mergers and acquisitions bids between 2009-2013. The author aims to take a holistic approach, analyzing how characteristics of the target and acquiring firms, deal specifics, and macroeconomic indicators relate to whether a bid is accepted and the final bid value. Prior research has largely focused on acquirers' perspectives, but the author argues targets' willingness to sell is also important. A literature review is followed by descriptions of the data and variables collected, preliminary statistics, and the logistic regression and linear regression models used to predict bid outcome and value. Key findings are that persistent negotiation, increasing GDP coupled with volatility raise bid success


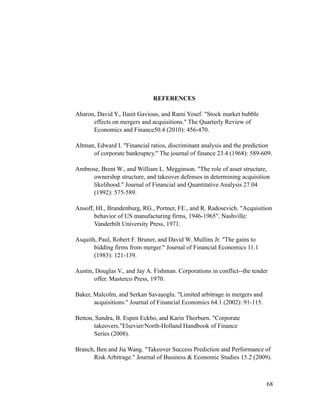
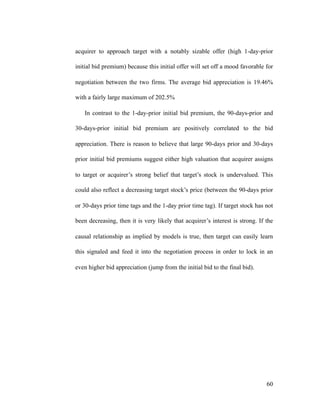
![each bid. Previous research pays close attention to bid premium at different
time before the announcement date and typically include 3 of these time tags:
90 days, 60 days, 30 days, and 1 day before the announcement date. It is
argued that rumors about mergers and acquisitions start several weeks before
the announcement date, therefore I included in my data set stock quotes at 90
days, 30 days, and 1 day before the announcement date. Historical stock
quotes are readily accessible for almost all firms in my dataset on Google
Finance and InvestorPoint. Historical stock quotes for target firms that stop
trading after merger and acquisitions are available in Bloomberg. Walkling
(1985) draws attention to the base date used in premium calculating. He
argues that taking the date following SEC filings would lead to an
underestimated bid offer premium, since news about takeover, merger and
acquisition appears first in the financial press or press release from involved
firms (before the full-fledged report with SEC), and sometimes circulated on
the street months before the official announcement. The base price () for
premium calculations is the closed priced at t equals 1 day, 30 days, and 90
days before the date the transaction is made public via financial news.Bid
premium is calculated as:
Bid premium at time t = [(Bid Value - Stock Price at time t)/ Stock price at time t] * 100
The inconsistence in findings on the effect of bid premium on bid outcome
can be explained in several ways, for instance, deal rumors spread on the
'34](https://image.slidesharecdn.com/cd1d54aa-e2a4-48fb-9ff6-755ecfc69e0e-161002205956/85/Phi-M-A-Thesis-44-320.jpg)
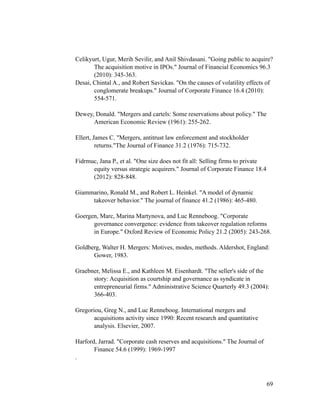
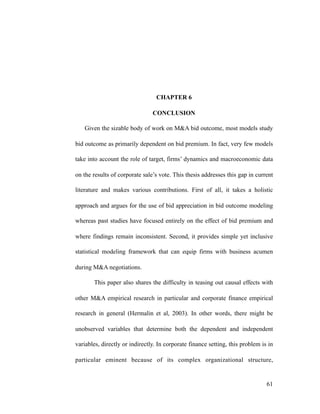
![streets months before the official announcement date, the variability in stock
prices follows a random walk, and stock prices reflect market’s expectation of
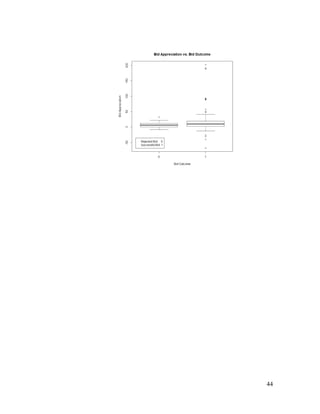
a company’s worth, not the true worth itself. I propose using bid appreciation
in place of bid premium as a determinant of bid outcome. Bid premium and
bid appreciation contain drastically different information about the bid. Bid
premium measures the surplus between the acquirer’s bid and the target’s
stock value at a given time, whereas bid appreciation measures the jump to
acquirer’s final bid from its initial bid. Bid appreciation is calculated as
followed:
Bid appreciation = [(Final bid - Initial Bid)/Initial Bid]*100
Since the base value is now the initial bid (instead of the presumably
“unaffected” stock price), bid appreciation reflects information true to the
value assigned to target by acquirer while controlling for the shifting in stock
prices and other events affecting the stock price before announcement date.
As stated above, macroeconomics data of interest include VIX
(volatility index), Fed’s fund rate and GDP (gross domestic product).
Econstats.com and the Federal Reserve Systems provide daily data on VIX
index and Fed fund’s rate respectively from which I calculated the weighted
average quarter and annual. The US Bureau of Economic Analysis provides
GDP data (available as both quarter and annual value and in 2009 dollars in
this dataset) that can be merged with the bid’s data by time tag.
'35](https://image.slidesharecdn.com/cd1d54aa-e2a4-48fb-9ff6-755ecfc69e0e-161002205956/85/Phi-M-A-Thesis-45-320.jpg)

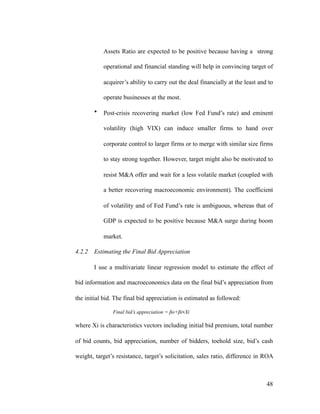


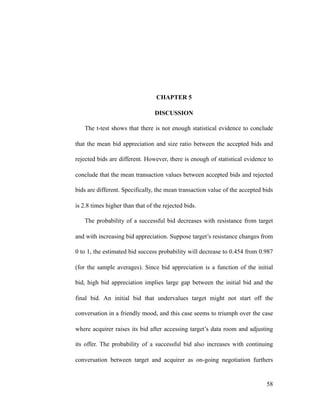
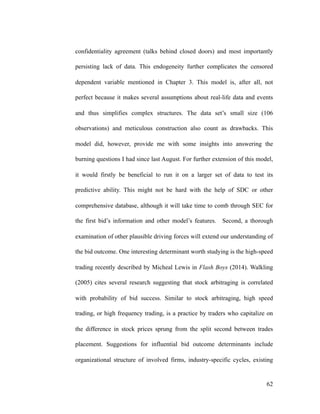

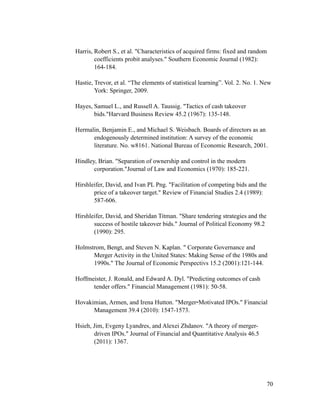
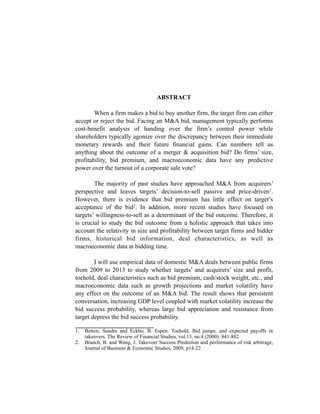
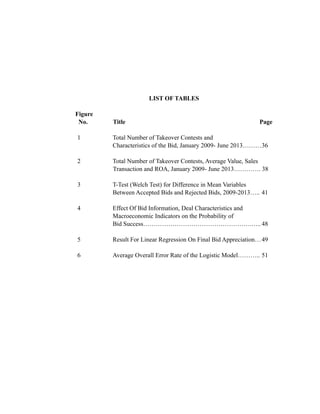
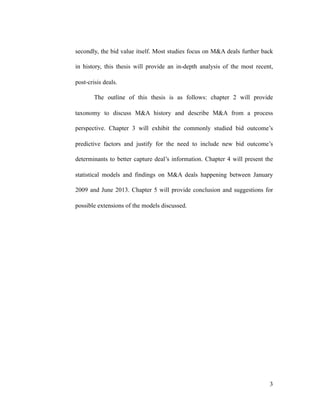
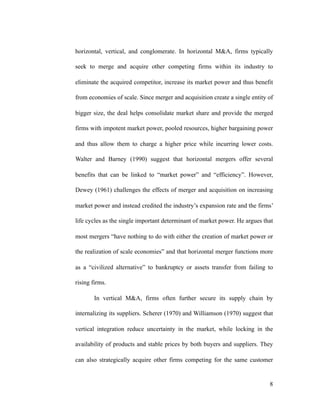
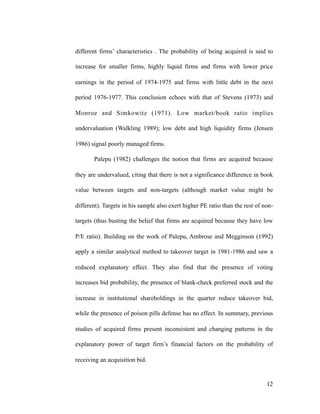
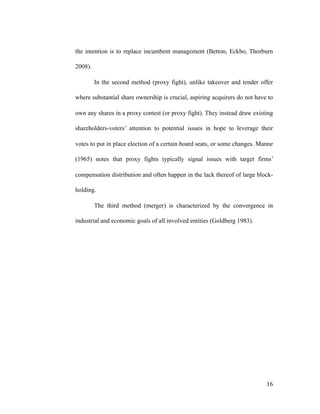
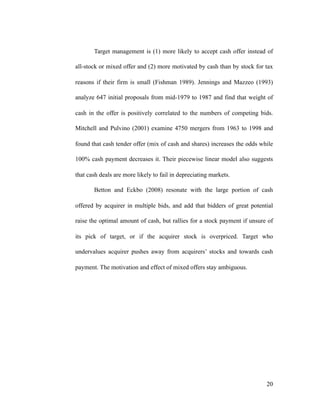
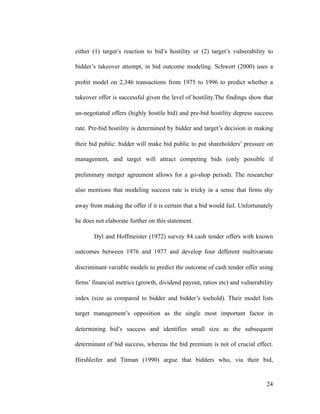
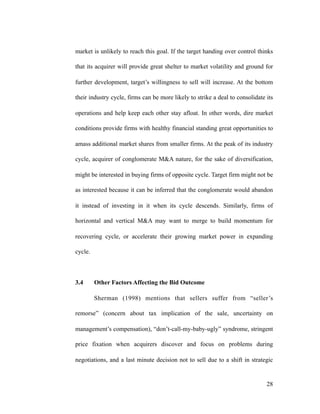
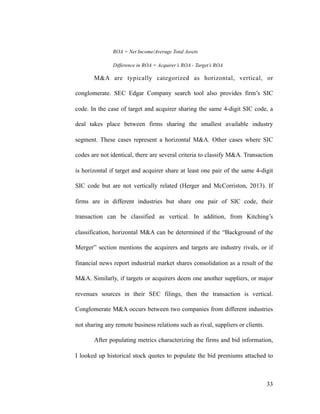
![APPENDIX
List of Industry by SIC Codes
Codes Used in R:
#Data clean-up & Descriptive Stats
mydata = read.csv("WIP.csv", header=T)
attach(mydata)
mydata$accepted = as.numeric(Rejected == 0)
rej = mydata[mydata$Rejected == 1,]
acc = mydata[mydata$Rejected == 0,]
mydata$SizeRatio=ASales/TSales
Industry First 2 digits of SIC code
Mining & Petroleum 10 to 13
Construction & Transportation 17, 40 to 47
Consumer Products (Food, Textile,
Print)
20, 22, 23, 26,27
Chemicals 28 to 34
Manufacturing 35 to 39
Communications 48
Wholesale of utilities, services &
products
49 to 51
Retail 52 to 59
Healthcare 63, 64, 80
Services 67, 70 to 87
'64](https://image.slidesharecdn.com/cd1d54aa-e2a4-48fb-9ff6-755ecfc69e0e-161002205956/85/Phi-M-A-Thesis-74-320.jpg)
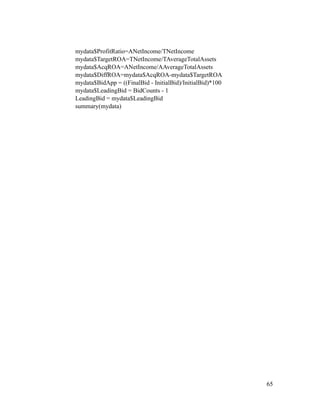
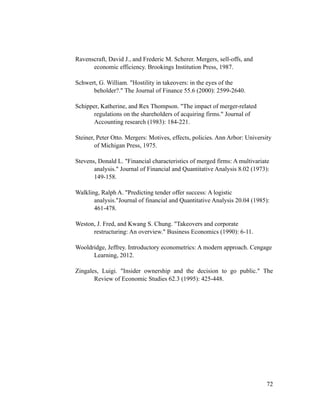
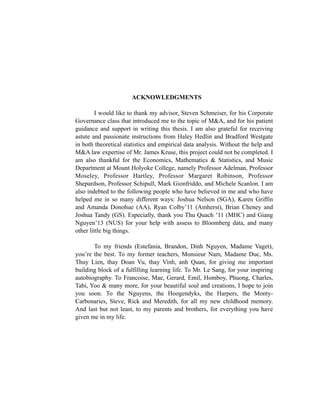
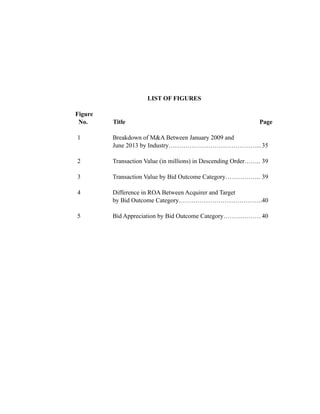
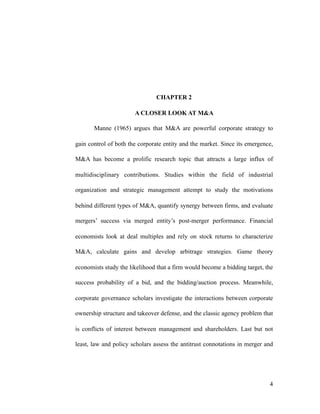
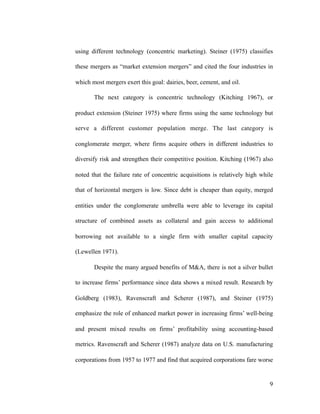
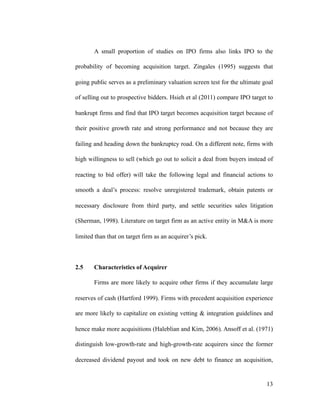
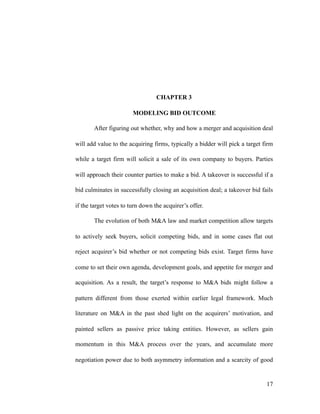
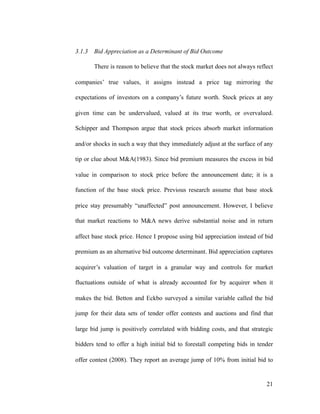
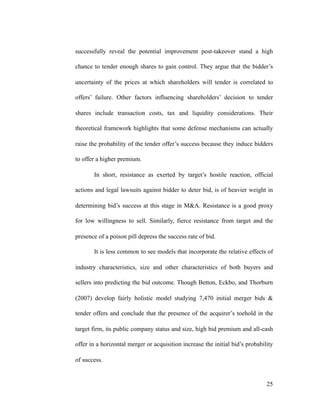
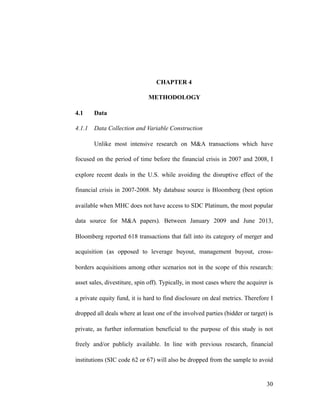
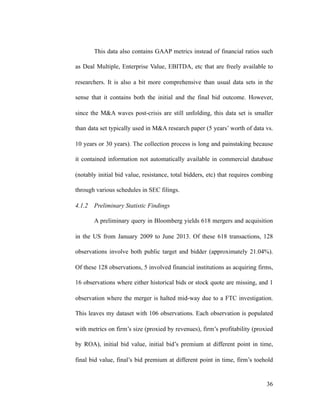
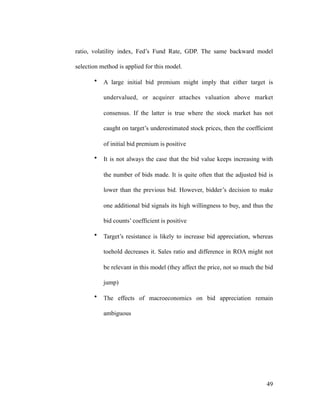
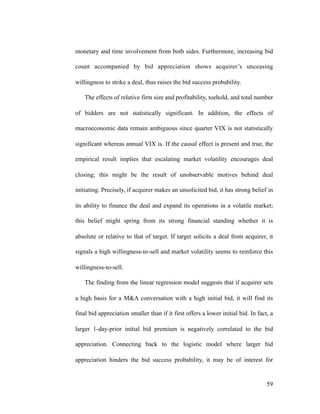
![Codes Used in R: (Continued)
dim(mydata)
attach(mydata)
#Backward selection of model
full=glm(accepted ~ fBidPrem90 + BidCounts + BidApp + ThSize + fBidCW
+ Resistance + SolicitedByTarget + SizeRatio + DiffROA + VIXa + FedRateA
+ GDPa, data = mydata, family = "binomial")
null=glm(accepted ~ BidCounts + BidApp + Resistance, data = mydata,
family = "binomial")
step(full,scope=list(upper=full, lower=null),data=mydata,
direction="backward")
#Random assign to training data vs. test data
rej = mydata[mydata$Rejected == 1,]
acc = mydata[mydata$Rejected == 0,]
nrej = dim(rej)[1]
nacc = dim(acc)[1]
trainIndsR = sample(1:nrej,nrej/2+1)
testIndsR = setdiff(1:nrej, trainIndsR)
trainDataRej = rej[trainIndsR,]
testDataRej = rej[testIndsR,]
trainIndsA = sample(1:nacc,nacc/2)
testIndsA = setdiff(1:nacc, trainIndsA)
trainDataAcc = acc[trainIndsA,]
testDataAcc = acc[testIndsA,]
trainData = rbind(trainDataAcc, trainDataRej)
attach(trainData)
nrow(trainData)
testData = rbind(testDataAcc, testDataRej)
attach(testData)
nrow(testData)
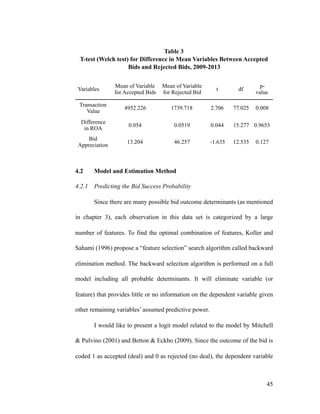
#T-test
t.test(acc$TransactionValueMil, rej$TransactionValueMil)
t.test(acc$DiffROA, rej$DiffROA)
'66](https://image.slidesharecdn.com/cd1d54aa-e2a4-48fb-9ff6-755ecfc69e0e-161002205956/85/Phi-M-A-Thesis-76-320.jpg)