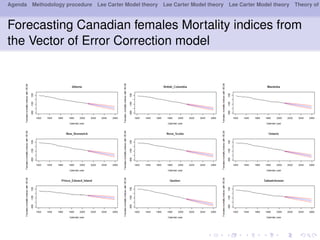
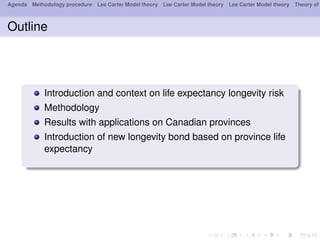
This document outlines a methodology for modeling multi-population longevity risk across Canadian provinces. It begins with a literature review on single and multi-population longevity modeling. Next, it describes retrieving Lee Carter mortality indices for 9 Canadian provinces and testing for cointegration among the indices. Finally, it discusses estimating vector autoregression and vector error correction models to forecast mortality and evaluate their ability to price annuities for different cohorts across provinces.
This document presents a methodology for modeling mortality rates across Canadian provinces. It reviews literature on single and multi-population mortality models. Mortality indices from 1921-2009 for 9 provinces are analyzed using unit root tests and the Johansen cointegration test, which finds common trends among the indices. Vector error correction (VECM) and vector autoregressive (VAR) models are estimated and show better fit for female mortality. The models are used to project and forecast mortality indices 50 years into the future and to price annuities for cohorts from 1960-2000, with VECM producing more accurate pricing. In conclusion, mortality trends are declining across provinces with common factors, and VECM performs better than VAR or ARIMA models
Parameter Estimation for the Exponential distribution model Using Least-Squar...IJMERJOURNAL
Abstract: We find parameter estimates of the Exponential distribution models using leastsquares estimation method for the case when partial derivatives were not available, the Nelder and Meads, and Hooke and Jeeves optimization methodswere used and for the case when first partial derivatives are available, the Quasi – Newton Method (Davidon-Fletcher-Powel (DFP) and the Broyden-Fletcher-Goldfarb-Shanno (BFGS) optimization methods)were applied. The medical data sets of 21Leukemiacancer patients with time span of 35 weeks ([3],[6]) were used.
Living Longer At What Price- Mortality ModellingRedington
The document discusses stochastic mortality models for modelling longevity risk. It compares deterministic versus stochastic models and describes various stochastic mortality models, including Lee-Carter and CBD models. It then discusses how to apply stochastic models by calibrating models with historical data to generate simulated mortality rates and cash flows, and compares the two-factor CBD model to the Lee-Carter model based on statistical tests. The two-factor CBD model predicts a smoother distribution of pension liabilities and is identified as the most appropriate model.
Face recognition by multimodal and multi algorithmic feature fusion of hybrid...Dr. Vinayak Bharadi
This document proposes a face recognition system using multimodal and multi-algorithmic feature fusion of hybrid and Kekre wavelet-based feature vectors. The system first pre-processes hyperspectral face images and applies hybrid wavelet transforms and Kekre's wavelet transform to generate feature vectors. These feature vectors are then analyzed using intra-class and inter-class testing to evaluate metrics like true acceptance rate and true rejection rate. The results show that fusing features from multiple algorithms like hybrid wavelet type I, hybrid wavelet type II and Kekre's wavelet transform provides better performance than individual unimodal systems.
This document summarizes a study that models crude oil prices using a Lévy process. The study finds that a MA(8) model best fits the time series properties of oil price returns. However, there is also evidence of GARCH effects. Therefore, the best overall model is a GARCH(1,1) with errors modeled by a Johnson SU distribution. This hybrid Lévy-GARCH process captures the temporal, spectral and distributional properties of the crude oil price data set.
Multivariate Regression using Skull StructuresJustin Pierce
The study aimed to develop a method for predicting the age of human remains based on measurements of the occipital condyles. Measurements of length, width, and height were taken from 68 juvenile specimens and used to generate linear regression models. The best model predicted age based on right condyle length and width, explaining 15% of variation, though neither model met the accuracy standard for legal admissibility. Limitations included a small sample size and age range, suggesting a larger, more diverse sample could improve predictive power.
Hyperspectral face recognition by texture feature extraction using hybrid wav...Dr. Vinayak Bharadi
The document proposes a system for hyperspectral face recognition using hybrid wavelet transforms. It introduces hyperspectral images and face recognition. The proposed system applies hybrid wavelet type I, type II, and Kekre wavelet transforms to hyperspectral face images to extract texture features and generate feature vectors. These feature vectors are stored in a database and analyzed using intra-class and inter-class testing to evaluate metrics like true acceptance rate, true rejection rate, and performance index for the different transform methods. Results show the hybrid wavelet type II transform achieved the highest performance index and security performance index for the right side face images compared to other transforms and instances.
An Algorithm For Vector Quantizer DesignAngie Miller
The document presents an algorithm for designing vector quantizers. The algorithm is efficient, intuitive, and can be used for quantizers with general distortion measures and large block lengths. It is based on Lloyd's approach but does not require differentiation, making it applicable even when the data distribution has discrete components. The algorithm finds quantizers that meet necessary optimality conditions. Examples show it converges well and finds near-optimal quantizers for memoryless Gaussian sources. It is also used successfully to quantize LPC speech parameters with a complicated distortion measure.
My co-authors and I have created an R package that allows the user to perform a fully quantitative analysis of DCE-MRI (dynamic contrast-enhanced magnetic resonance imaging) data. With applications in oncology in mind, users can interrogate the perfusion characteristics of tissue in order to compare between treatment groups and pre-/post-treatment.
Calibrating the Lee-Carter and the Poisson Lee-Carter models via Neural Netw...Salvatore Scognamiglio
This document summarizes a research paper that develops a neural network model for large-scale mortality modelling of multiple populations. The model combines individual stochastic mortality models into a neural network environment that allows for information sharing between populations. This improves on traditional models that fit populations separately. The neural network model estimates parameters for modified Lee-Carter models in a single stage using all available data, producing more robust estimates and improved forecasting performance compared to traditional approaches. The model consists of three neural network subnets that estimate the age-specific, time-specific, and age-time interaction parameters of the Lee-Carter models for multiple populations simultaneously.
Probabilistic Methods Of Signal And System Analysis, 3rd EditionPreston King
Probabilistic Methods of Signal and System Analysis, 3/e stresses the engineering applications of probability theory, presenting the material at a level and in a manner ideally suited to engineering students at the junior or senior level. It is also useful as a review for graduate students and practicing engineers.
Thoroughly revised and updated, this third edition incorporates increased use of the computer in both text examples and selected problems. It utilizes MATLAB as a computational tool and includes new sections relating to Bernoulli trials, correlation of data sets, smoothing of data, computer computation of correlation functions and spectral densities, and computer simulation of systems. All computer examples can be run using the Student Version of MATLAB. Almost all of the examples and many of the problems have been modified or changed entirely, and a number of new problems have been added. A separate appendix discusses and illustrates the application of computers to signal and system analysis
Chemistry involves experimentally studying the physical and chemical properties of substances and measuring them precisely. Measurements have some uncertainty depending on the skill of the person and instrument used. Significant figures refer to the digits that convey the accuracy of a measurement based on the instrument's least count. Chemical quantities and reactions follow various laws including the law of conservation of mass, law of definite proportions, law of multiple proportions, and Gay-Lussac's law of gas volumes in chemical combinations. Dalton's atomic hypothesis provided a theoretical basis for these laws by proposing that elements are made of atoms that combine in fixed ratios to form compounds.
This paper tries to compare more accurate and efficient L1 norm regression algorithms. Other comparative studies are mentioned, and their conclusions are discussed. Many experiments have been performed to evaluate the comparative efficiency and accuracy of the selected algorithms.
https://workshopmanuals.co/ Workshopmanualsco provides workshop repair manuals just like the professional repair shops use. We provide an instant manual download after purchase. These detail manuals have parts list, wiring diagrams, maintenance information and everything the DIY car enthusiast will need. We have repair guides for all the top auto manufacturers. (Alfa Romero, Aston Martin, Audi, Bentley, BMW, Chevrolet, Citroen, Daihatsu, Ford, GMC, Honda, Hummer, Lexus, Mercedes-Benz, Renault, Tesla, Toyota, Vauxhall, Volvo, VW & so much more!
The document compares 11 time series models for fitting daily stock return data from the KLCI before and after the 1997 Asian financial crisis using two methods: 1) ranking models based on log likelihood, SBC, and AIC values, and 2) principal component analysis of these criteria. For the pre-crisis period, both methods identify GARCH(1,2) as the best fitting model and ARCH(1) as the worst, but disagree on intermediate models. PCA avoids information loss from ranking and better classifies models by performance level.
This document describes a method for tracking colliding white blood cells in microscopy video data. The method uses multiple hypotheses and collision states within a Kalman filter framework to track cells whose motion and appearance change abruptly during collisions. Evaluation shows the method improves the percentage of tracked positions by 28% compared to previous work and achieves 88% tracked position coverage for colliding cells. Future work aims to incorporate more features for detection and a probabilistic approach to model state transitions during collisions.
This document summarizes a research article about using particle swarm optimization to find different shrinkage parameters (k values) for each explanatory variable in ridge regression, rather than a single k value. Ridge regression is used to address multicollinearity issues in multiple regression analysis. Typically, ridge regression estimates a single k value, but this study uses an algorithm based on particle swarm optimization to estimate different k values for each variable. The study applies this new method to real data and simulations to evaluate its performance compared to other ridge regression methods.
The document presents a new method called KCGex-SVM for extracting rules from support vector machines (SVMs). It combines weighted kernel k-means clustering, genetic algorithms, and information from SVMs to generate an interpretable rule set from credit screening data. The method was tested on three credit screening datasets and showed improved accuracy over other rule extraction techniques, generating rules with good performance while maintaining comprehensibility.
This document provides an overview of econometrics and its application in economic research. It discusses key topics such as:
1. The history and development of econometrics, from linear regression to advanced dynamic models.
2. Statistical issues that can arise in regression like multicollinearity and heteroscedasticity.
3. Model building in econometrics, including partial adjustment models, vector error correction models, and panel data analysis.
4. Examples of econometric analyses using Indonesian economic data to examine relationships between variables like GDP, investment, taxes, and expenditures.
This document summarizes research on the First-Order Integer-Valued Autoregressive (INAR(1)) process. It describes the INAR(1) model, including how it represents lag-one dependence between integer-valued random variables. It also discusses four estimation methods for the INAR(1) parameters (α and λ): Yule-Walker, Conditional Least Squares, Maximum Likelihood, and Whittle estimation. Simulation results show that Conditional Maximum Likelihood generally has the lowest bias, making it the best estimation method among the four.
This document provides an overview of the textbook "Vibrations, Second Edition" by Balakumar Balachandran and Edward B. Magrab. The textbook covers principles of vibration analysis and their application to engineering design across various fields. It aims to integrate linear and nonlinear vibration concepts with modeling, analysis, prediction, and measurement. Example applications are drawn from diverse areas such as biomechanics, manufacturing, and civil structures. Both analytical and numerical solution techniques are presented to analyze vibratory systems and deduce design guidelines.
Modeling and forecasting age-specific mortality: Lee-Carter method vs. Functi...hanshang
The document discusses four topics: 1) the Lee-Carter model for modeling and forecasting age-specific mortality rates, 2) nonparametric smoothing of functional data, 3) functional principal component analysis (FPCA) as a dimension reduction technique, and 4) functional time series forecasting. FPCA decomposes the variability in functional data into orthogonal principal components to extract the most important patterns in the data with few dimensions.
This document presents a statistical classification of cryptocurrencies using a factor analysis approach. It analyzes daily return data from 150 cryptocurrencies and other financial assets from 2014 to 2019. A factor model is estimated that extracts three key factors: a tail factor related to return distributions, a moment factor related to variance and skewness, and a memory factor related to volatility clustering. Cryptocurrencies are shown to load highly and distinctly on the tail factor compared to other assets. Several classification techniques, including logistic regression and support vector machines, demonstrate the tail factor is highly predictive of cryptocurrencies. The analysis provides evidence that cryptocurrencies can be classified as a distinct asset class.
Panel data methods for microeconometrics using Stata! Short and good one :)Wondmagegn Tafesse
The document provides an overview of panel data methods and commands in Stata. It discusses:
1) Linear panel models including pooled OLS, fixed effects, random effects, and first differences estimators.
2) Panel instrumental variable estimators including Hausman-Taylor for models with time-invariant endogenous variables.
3) Dynamic panel data models and the Arellano-Bond estimator for models with individual fixed effects and a lagged dependent variable.
This document introduces the concepts of random experiments, sample spaces, events, and probabilities. A random experiment is one whose outcome cannot be predicted with certainty but whose sample space (the set of all possible outcomes) can be described beforehand. Events are subsets of the sample space. The probability of an event can be defined as the limit of its relative frequency of occurrence over many trials of the experiment.
A new CPXR Based Logistic Regression Method and Clinical Prognostic Modeling ...Vahid Taslimitehrani
Presented at 15th International Conference on BioInformatics and BioEngineering (BIBE2014)
Prognostic modeling is central to medicine, as it is often used to predict patients’ outcome and response to treatments and to identify important medical risk factors. Logistic regression is one of the most used approaches for clinical pre- diction modeling. Traumatic brain injury (TBI) is an important public health issue and a leading cause of death and disability worldwide. In this study, we adapt CPXR (Contrast Pattern Aided Regression, a recently introduced regression method), to develop a new logistic regression method called CPXR(Log), for general binary outcome prediction (including prognostic modeling), and we use the method to carry out prognostic modeling for TBI using admission time data. The models produced by CPXR(Log) achieved AUC as high as 0.93 and specificity as high as 0.97, much better than those reported by previous studies. Our method produced interpretable prediction models for diverse patient groups for TBI, which show that different kinds of patients should be evaluated differently for TBI outcome prediction and the odds ratios of some predictor variables differ significantly from those given by previous studies; such results can be valuable to physicians.
A new CPXR Based Logistic Regression Method and Clinical Prognostic Modeling ...
Ph.D Day presentation
1. Agenda Methodology procedure Lee Carter Model theory Lee Carter Model theory Lee Carter Model theory Theory of
Multi-Population Longevity Risk
A. Ntamjokouen, Università degli Studi di Bergamo, Italy
Ph.D thesis in Economics, Applied Mathematics and
Operational Research
Bergamo, 13rd
February 2014
2. Agenda Methodology procedure Lee Carter Model theory Lee Carter Model theory Lee Carter Model theory Theory of
Outline
Chapter 1: Literature review on muti-population longevity
risk
Chapter 2: Multi-population Longevity risk across
Canadian provinces
Chapter 3: Multi-population longevity risk life expectancy
across Canadian provinces
Chapter 4: Modeling Multi-population life expectancy by
races
3. Agenda Methodology procedure Lee Carter Model theory Lee Carter Model theory Lee Carter Model theory Theory of
Outline
Introduction of the context on longevity risk
Literature review on single and multi-population
Financial applications
Measuring multi-population longevity risk across mortality
indices in Canada
4. Agenda Methodology procedure Lee Carter Model theory Lee Carter Model theory Lee Carter Model theory Theory of
Literature
Lee Carter Model(1992), Lee Miller(2001), Booth
Maindonal Smith Variant(2002), Hyndman and
Ullah(2005), De Jong and Tickle(2006), Renshaw
Haberman(2006) with cohort effect, Currie(2004) with
P-Splines, and Currie(2006) with Age period Cohort,
Cairns-Blake-Dowd(2009).
Darkiewicz(2004): Lee Carter validity as a cointegration
approach; Lazar and Denuit(2009): common trends
between 5 age groups mortality; Njenga and sherris(2011):
cointegration among Heligman Pollard parameters;
D’Amato(2013): Multi-Population longevity risk among
countries; Sharon S. Yang et al. (2009) pricing of longevity
bonds derivatives among 4 countries
Salhi and Loisel(2010) and Zhou et al(2012) on the basis
risk; Jarner and Kryger(2011).
5. Agenda Methodology procedure Lee Carter Model theory Lee Carter Model theory Lee Carter Model theory Theory of
Motivations
Here, we contribute to the modeling of multi-populations
mortality indices with applications of annuities by cohorts. We
model multi-population life expectancy with applications on the
engineering of new type longevity bond. This work is based on
multi-population rather than 1 as in the existing literature.
Why multi-provinces longevity risk in general?
Pricing of life insurance annuities accross countries or
regions within a country
Engineering of longevity bonds derivatives: EIB & BNP
Paris and Swiss Re longevity bond based on mortality
indices
Survivor bond proposed by Burrow(2001) based on the
age of the last survivor in the portfolio
Hedging variations of life expectancy pattern
6. Agenda Methodology procedure Lee Carter Model theory Lee Carter Model theory Lee Carter Model theory Theory of
Methodology
We retrieve the mortality indices produced by the Lee
Carter model for the 9 mortality rates
The determination of order of integration for each of the 9
mortality indices using the Augmented Dickey Fuller,
Philips-Perron as well as KPSS Test
The computation of the optimal value of lag of the vector of
autoregressive model
the Johansen cointegration test which test the
cointegration rank and specify which variable will enter in
the cointegrated equations and in the Vector of Error
correction model
The estimation of VECM and the VAR models and the
forecasting of derived model.
7. Agenda Methodology procedure Lee Carter Model theory Lee Carter Model theory Lee Carter Model theory Theory of
Lee Carter Model for each of 9 mortality rates groups
We retrieved the singular mortality indice from the 9 provinces
through Lee Carter model.
The Lee carter Model is described as followed:
ln(m1(t, 1)) = a1,x + bxk1,t + e1,t (1)
where:
ax describes the shape of age profile of mortality;
bx coefficient describes the variation of death rates to variation in the
level of mortality;
kt is the mortality index;
ex,t is the error term with ex,t ∼ N(0, σ2
u) is white noise which is the
age feature mortality not captured by the model.
8. Agenda Methodology procedure Lee Carter Model theory Lee Carter Model theory Lee Carter Model theory Theory of
Males Mortality indices for each province in Canada
9. Agenda Methodology procedure Lee Carter Model theory Lee Carter Model theory Lee Carter Model theory Theory of
Females Mortality indices for each province in Canada
10. Agenda Methodology procedure Lee Carter Model theory Lee Carter Model theory Lee Carter Model theory Theory of
VAR and VECM models
The VAR model is derived as described below: The vector
autoregression for p lags is written in Lutkepohl(2005) as:
kt = ν + η1kt−1 + η2kt−2 + ......ηpkt−p + et (2)
where kt = (k1,t, k2,t, .....kN,t) is a N-dimentional time series,
ηi are matrices with the coefficient parameters (S ∗ S) ,
ν = (ν1, ν2, .....νp) is the intercept term, et is the residuals part
with white noise and t = 0, 1, ....T and p the last lag order..
According to Pfaff(2008), the VAR (p) can be converted into VECM as
follows:
∆kt = Γ1∆kt−1 + Γ2∆kt−2 + ... + Γp−1∆kt−p+1 + Πkt−p + ν + εt (3)
where Γi = −(I − η1 + ..... − ηi), for i = 1, ...p − 1 and
Π = −(I − η1 − ...... − ηp).
11. Agenda Methodology procedure Lee Carter Model theory Lee Carter Model theory Lee Carter Model theory Theory of
Evidence of the cointegrated equations for Canadian
provincial mortality level with critical values at 5%,
10% and 1%
Information Crtieria: HQ, SC and FPE indicate 1 optimal lags
while AIC is 6. According to Lutkepohl(2005), the preference
will be given to SC which is 1.
r test value 5% 10% 1%
r <= 8 3.34 9.24 7.52 12.97
r <= 7 11.38 19.96 17.85 24.6
r <= 6 25.50 34.91 32 41.07
r <= 5 46.40 53.12 49.65 60.16
r <= 4 84.23 76.07 71.86 84.45
r <= 3 127.73 102.14 97.18 111.01
r <= 2 175.99 131.7 126.58 143.09
r <= 1 229.25 165.58 159.48 117.2
r = 0 300.68 202.92 196.37 215.74
12. Agenda Methodology procedure Lee Carter Model theory Lee Carter Model theory Lee Carter Model theory Theory of
Backtesting of the two models VAR and VECM
Out-of-samples VAR(M) VAR(F) VECM(M) VECM(F)
Portmanteau test 0.81 0.68 0.97 0.75
JB Multivariate 0.18 0.31 0.04 0.16
Skewness 0.88 0.17 0.17 0.062
Kurtosis 0.02 0.56 0.0507 0.59
Table 2: Diagnostics of residuals for VAR and VECM models in both
genders cases
13. Agenda Methodology procedure Lee Carter Model theory Lee Carter Model theory Lee Carter Model theory Theory of
Backtesting of the two models VAR and VECM
Sex group Females Males
Out-of-samples VAR | VECM VAR | VECM
h=2005-2009 5.63% | 5.13% 6.85%| 5.73%
h=2002-2009 6.66% | 6.52% 9.47%|10.96%
h=2000-2009 12.89%|7.43% 8.42%|22.91%
h=1995-2009 16.38%|9.79% 10.66%|2.45%
h=1990-2009 19.36%|15.14% 29.67%|24.51%
h=1984-2009 21.77%|16.80% 39.80%|30.01%
Table 3: The average MAPE for models VAR and VECM for the 9
provinces
14. Agenda Methodology procedure Lee Carter Model theory Lee Carter Model theory Lee Carter Model theory Theory of
Volatility of the two models VAR and VECM
Out-of-samples Sex Historic VAR VECM
h=1995-2009 Males 166.31 37.23 48.10
Females 98.16 91.19 78.51
h=1990-2009 Males 172.9 52.17 59.75
Females 107.77 114.88 107.72
h=1984-2009 Males 213.93 67.46 69.44
Females 124.45 139.94 136.18
Table 4: Comparison of volatility of historical mortality with
out-of-sample forecasts produced by models VAR and VECM with in
sample
15. Agenda Methodology procedure Lee Carter Model theory Lee Carter Model theory Lee Carter Model theory Theory of
Projecting Males mortality indices for all other
provinces with VAR models
16. Agenda Methodology procedure Lee Carter Model theory Lee Carter Model theory Lee Carter Model theory Theory of
Projecting Females mortality indices for all other
provinces with VAR models
17. Agenda Methodology procedure Lee Carter Model theory Lee Carter Model theory Lee Carter Model theory Theory of
Forecasting Canadian Males Mortality indices from the
Vector of Error Correction model
18. Agenda Methodology procedure Lee Carter Model theory Lee Carter Model theory Lee Carter Model theory Theory of
Forecasting Canadian females Mortality indices from
the Vector of Error Correction model
19. Agenda Methodology procedure Lee Carter Model theory Lee Carter Model theory Lee Carter Model theory Theory of
Pricing annuities of females cohorts 1960,
1970,1980,1990 and 2000
Here we present results from Alberta, but we have found similar
conclusions as in Alberta for the other 8 involved in the
analysis.
Females ARIMA VAR VECM
Cohorts Life time | APV Life time | APV Life time | APV
1960 16.65 | 7.85 16.73| 7.91 17.81| 8.38
1970 18.25 | 8.16 18.42| 8.23 19.5| 8.79
1980 19.56 | 8.45 19.67| 8.52 20.96| 9.14
1990 20.68 | 8.72 20.86| 8.79 22.29| 9.45
2000 21.54 | 8.97 21.7| 9.03 23.21| 9.71
Table 5: Price of annuity and life time after 65 years old from Alberta
provinces cohorts 1960, 1970,1980,1990 and 2000
20. Agenda Methodology procedure Lee Carter Model theory Lee Carter Model theory Lee Carter Model theory Theory of
Pricing annuities of Males cohorts 1960,
1970,1980,1990 and 2000
Here we present results from Alberta, but we have found similar
conclusions as in Alberta for the other 8 involved in the
analysis.
Males ARIMA VAR VECM
Cohorts Life time | APV Life time | APV Life time | APV
1960 11.39 | 6.65 12.34| 7.29 12.58| 7.43
1970 13.63 |7.08 15.26 | 8.02 15.54 | 8.15
1980 15.62 | 7.49 17.89 | 8.7 18.15 | 8.81
1990 17.91 | 7.87 20.9 | 9.33 21.11| 9.4
2000 19.53 | 8.22 23.08| 9.88 23.22 | 9.91
Table 6: Pricing annuities and life time after 65 years old from
Alberta province of male cohorts 1960, 1970,1980,1990 and 2000
21. Agenda Methodology procedure Lee Carter Model theory Lee Carter Model theory Lee Carter Model theory Theory of
Outline
Introduction and context on life expectancy longevity risk
Methodology
Results with applications on Canadian provinces
Introduction of new longevity bond based on province life
expectancy
22. Agenda Methodology procedure Lee Carter Model theory Lee Carter Model theory Lee Carter Model theory Theory of
Literature review
The Biological techniques such as Oeppen and
Vaupel(2002)
Extrapolative method such as Lee Carter(1992),
Whitehouse(2007), Rusolillo(2005), De Beer and Alders
(1999), Keilman, Pham and Hetland (2001), Alders
Keilman and Cruijsen (2007)
Torri(2011) focuses analysis on countries
23. Agenda Methodology procedure Lee Carter Model theory Lee Carter Model theory Lee Carter Model theory Theory of
In general ARIMA is described as:
Lt = a0 + a1Lt−1 + εt (4)
where a0 is the drift term , Lt−1 is the time series, εt is the error
term distributed with ε ∼ (0, σ2)
The 3 steps of the process are:
Identification: This consists of plotting data and identifying the
pattern of the time series.
Order Estimation of the model: combinations of p, d, q where
p is the number of autoregressive parameters d is the drift, q is
the moving average parameters (q) to obtain the best model
Model Validation: checking the diagnostics of residuals from
the chosen models by plotting the autocorrelation residuals and
experimenting a Portmanteau test of the residuals
24. Agenda Methodology procedure Lee Carter Model theory Lee Carter Model theory Lee Carter Model theory Theory of
Model Validation ARIMA: Evaluation of the models for the
forecasting uses
lags AL BC NB NS ON QC
4 ags 0.83 0.57 0.63 0.23 0.19 0.91
10 lags 0.55 0.54 0.39 0.092 0.55 0.91
15 lags 0.67 0.52 0.57 0.11 0.67 0.26
20 lags 0.83 0.67 0.76 0.83 0.83 0.35
Table 7: P-values results of Portmanteau test resulted from ARIMA
models over the period 1921-2009
25. Agenda Methodology procedure Lee Carter Model theory Lee Carter Model theory Lee Carter Model theory Theory of
VAR and VECM models
We analyse the optimal lag length of the VAR model.
Information criteria shows contradictory results: AIC and FPE
indicate 3 optimal lags while HQ indicate a lag order of 2 and
finally SC of only 1. Since they differ, Lutkepohl(2005), shows
that the preference will be given to SC. Consequently, the lag
length is 1.
Cointegrating relationship critical values 5pct 1pct
5 3.09 9.24 12.97
4 10.29 19.96 24.60
3 32.45 34.91 41.07
2 71.31 53.12 60.16
1 118.49 76.07 84.45
0 193.08 102.14 111.01
Table 8: The cointegration relations under trace test
26. Agenda Methodology procedure Lee Carter Model theory Lee Carter Model theory Lee Carter Model theory Theory of
VAR and VECM models
Type of test Specific name p-values
Autocorrelation Portmanteau(4 lags) 0.0009
Normality Both 0.23
Kurtosis 0.195
Skewness 0.36
Table 9: The diagnostics tests of residuals under VAR model
Type of test Autocorrelation p-values
Autocorrelation Portmanteau(4 lags) 0.0018
Normality Both 0.0675
Kurtosis 0.07
Skewness 0.195
Table 10: The diagnostics tests of residuals of VECM
27. Agenda Methodology procedure Lee Carter Model theory Lee Carter Model theory Lee Carter Model theory Theory of
ARIMA, VAR and VECM models
Out-Of-Sample VECM VAR ARIMA
h=2001-2009 0.29% 0.31% 5.51%
h=2002-2009 0.27% 0.40% 5.53%
h= 2003-2009 0.34% 0.26% 5.60%
h=2004-2009 0.28% 0.44% 5.62%
h=2005-2009 0.30% 0.23% 5.72%
h=2006-2009 0.28% 0.37% 5.86%
Table 11: The average MAPE for models, ARIMA VAR and VECM for
the 6 provinces
28. Agenda Methodology procedure Lee Carter Model theory Lee Carter Model theory Lee Carter Model theory Theory of
VAR and VECM models
Provinces VECM VAR ARIMA
Alberta (1.04-4.58) (1.19-1.73) (1.20-3.44)
British Columbia (1.07-7.06) (1.04-1.49) 1.34-2.32
New Brunswick (1.05-6.52) (1.18-2.20) (1.36-5.65)
Nova Scotia (1.11-6.73) (1.27-2.09) (1.32-6.21)
Ontario (0.65-6.40) (0.75-1.57) (0.83-5.88)
Quebec (1.08-6.33) (1.24-2.64) ( 1.30-6.07)
Table 12: The Confidence Interval of models VAR, VECM and
ARIMA for the 6 provinces derived from predictions 50 years ahead
29. Agenda Methodology procedure Lee Carter Model theory Lee Carter Model theory Lee Carter Model theory Theory of
Projecting Females mortality indices for all other
provinces with VAR models
The Alberta’s Confidence Interval for VECM is Greater than for
VAR and ARIMA
30. Agenda Methodology procedure Lee Carter Model theory Lee Carter Model theory Lee Carter Model theory Theory of
Projecting males life expectancy for all other provinces
with each model
The British Columbia’s Confidence Interval for VECM is Greater
than for VAR and ARIMA
31. Agenda Methodology procedure Lee Carter Model theory Lee Carter Model theory Lee Carter Model theory Theory of
Projecting males life expectancy for all other provinces
with each model
The New Brunswick’s Confidence Interval for VECM is Greater
than for VAR and ARIMA
32. Agenda Methodology procedure Lee Carter Model theory Lee Carter Model theory Lee Carter Model theory Theory of
Projecting males life expectancy for all provinces with
each model
The Nova Scotia’s Confidence Interval for VECM is Greater
than for VAR and ARIMA
33. Agenda Methodology procedure Lee Carter Model theory Lee Carter Model theory Lee Carter Model theory Theory of
Projecting males life expectancy for all provinces with
each model
The Ontario’s Confidence Interval for VECM is Greater than for
VAR and ARIMA
34. Agenda Methodology procedure Lee Carter Model theory Lee Carter Model theory Lee Carter Model theory Theory of
Projecting males life expectancy for all provinces with
each model
The Quebec’s Confidence Interval for VECM is Greater than for
VAR and ARIMA
35. Agenda Methodology procedure Lee Carter Model theory Lee Carter Model theory Lee Carter Model theory Theory of
VAR and VECM models
Year A BC NB NS ON Q
2010 79.28 78.12 78.02 79.74 79.74 79.30
2020 81.26 82.29 80.67 80.06 82.18 82.36
2030 83.57 84.71 83.23 82.41 84.72 85.59
2040 85.89 87.13 85.79 84.75 87.26 88.82
2050 88.21 89.55 88.35 87.10 89.79 92.05
2060 90.63 91.97 90.92 89.45 92.33 95.27
Table 13: Future forecast of life expectancy with model VECM for the
6 provinces
36. Agenda Methodology procedure Lee Carter Model theory Lee Carter Model theory Lee Carter Model theory Theory of
New product based on the dynamics of life expectancy may be
issued.
No credit risk from both parties involves
Financial markets are liquid and no basis risk
It consists of an initial payment of X with successive
payment coupon C(depending on the dynamic evolution of
life expectancy) with frequency of 10 on a maturity period
of 50 years to correspond to potential investors.
We compute the variation of life expectancy of the
considered regions between the period 2000-2009 which is
equal to 2.2. Accordingly, pension plan would pay a certain
amount C to the investors if future life expectancy is
greater than 2.2.
Coupons are discounted at rate linked to Libor. We build a
bond with maturity of 50 years since shorter period do not
provide effective hedging( see Dowd et al., 2006b).
37. Agenda Methodology procedure Lee Carter Model theory Lee Carter Model theory Lee Carter Model theory Theory of
Outline
Introduction of the context on longevity risk by races in the
USA
Review on the existing literature
Measuring multi-population longevity risk of life expectancy
Principal component analysis to measure multi-population
life expectancy
Applications of autoregressive and multiregressive models
on life expectancy
Estimation of Vector Autoregressive model(VAR)
The estimation of VECM the forecasting of derived
model(VECM).
Computations on future life expectancy by races in the
USA.
38. Agenda Methodology procedure Lee Carter Model theory Lee Carter Model theory Lee Carter Model theory Theory of
Literature
Life expectancy is getting improved, across developped
countries, as several studies such as Tulgapurkar et.
al(2007) and Oeppen(2002) have shown. The United
States of America are not an exception since they have
highlighted also signs of improvements within their national
population as well as in different races groups living in the
country.
Most work done on this topic have focused on predicting
the pair black-white death rates such as Rives 1977;
NCHS (1975), Manton(1980, 1982), Manton et. al(1979)
Philipps and Burch(1960), Woodbury et. al(1981), Manton
et. al(1979), Carter(2010).
We will focus not only on two but on more races groups
which include life expectancy from asian and latino
americans.
39. Agenda Methodology procedure Lee Carter Model theory Lee Carter Model theory Lee Carter Model theory Theory of
Historical Evolution of race in the USA
Races 1910 1950 1970 2000 2010
White 88.9% 89.5% 87.7% 75.1% 72.4%
Black 10.7% 10% 11.1% 12.3% 12.6%
American/Indian -0.3% 0.2% 0.8% 3.8% 4.9%
Asian 0.2% 0.2% 0.8% 3.8% 4.9%
Hispanic 0.9% 0.8% 0.1% 12.5% 16.3%
Table 14: Statistics census of American population
40. Agenda Methodology procedure Lee Carter Model theory Lee Carter Model theory Lee Carter Model theory Theory of
Projecting males life expectancy for all provinces with
each model
Principal Component analysis
41. Agenda Methodology procedure Lee Carter Model theory Lee Carter Model theory Lee Carter Model theory Theory of
with estimations of models ARIMA(p,d,q) All Sex Males(ASM),
All Sex Females(ASF), White Females(WF), Black Males(BM),
Black Females(BF)
lags ASM ASF WM WF BM BM
4 ags 0.63 0.77 0.09 0.53 0.63 0.57
10 lags 0.66 0.87 0.24 0.91 0.66 0.94
15 lags 0.10 0.66 0.08 0.45 0.10 0.93
20 lags 0.11 0.59 0.13 0.11 0.11 0.75
Table 15: P-values of Portmanteau test resulted from ARIMA models
over the period 1921-2009
42. Agenda Methodology procedure Lee Carter Model theory Lee Carter Model theory Lee Carter Model theory Theory of
Cointegrating relationship critical values 5pct 1pct
5 0.64 8.18 11.65
4 8.02 14.90 19.19
3 13.19 21.07 25.75
2 19.65 27.14 32.14
1 23.58 33.32 38.78
0 57.79 39.43 46.82
Table 16: The cointegration relations under trace test
43. Agenda Methodology procedure Lee Carter Model theory Lee Carter Model theory Lee Carter Model theory Theory of
Type of test Autocorrelation p-values
Autocorrelation Portmanteau(4 lags) 0.91
Normality Both 0.77
Kurtosis 0.55
Skewness 0.78
Table 17: The diagnostics tests of residuals of VAR
Type of test Autocorrelation p-values
Autocorrelation Portmanteau(4 lags) 0.98
Normality Both 0.5076
Kurtosis 0.5078
Skewness 0.42
Table 18: The diagnostics tests of residuals of VECM
44. Agenda Methodology procedure Lee Carter Model theory Lee Carter Model theory Lee Carter Model theory Theory of
OO-Sample VECM VAR ARIMA
h=2000-2010 0.5% 2.31% 5.1%
h=2001-2010 0.55% 2.3% 5.8%
h=2002-2010 0.4% 0.62% 6.2%
h= 2003-2010 1.02% 0.77% 6.41%
h=2004-2010 1.1% 0.60% 6.69%
h=2005-2010 1.39% 0.48% 7.37%
h=2006-2010 0.280% 0.62% 7.34%
h=2007-2010 0.29% 0.32% 7.9%
h=2008-2010 0.19% 0.42% 8.39%
Table 19: The average MAPE for models, ARIMA VAR and VECM for
the 6 provinces
45. Agenda Methodology procedure Lee Carter Model theory Lee Carter Model theory Lee Carter Model theory Theory of
Races VECM VAR ARIMA
All sexes Males (0.23-2.13) (0.24-0.46) (0.31-2.24)
All sex Fem (0.23-1.82) (0.26-0.72) ( 0.35-1.89)
White fem (0.21-9.21) (0.23-0.31) (0.28-2.04)
White Mal (0.35-5.21) (0.23-0.62) (0.31-3.12)
Black Femal (0.35-7.66) (0.80-2.17) (0.9-6.35)
Black Mal (1.08-6.33) (0.40-1.68) ( 0.47-4.72)
Table 20: Confidence interval of models VAR, VECM and ARIMA for
the 6 provinces derived from predictions 50 years ahead
46. Agenda Methodology procedure Lee Carter Model theory Lee Carter Model theory Lee Carter Model theory Theory of
Projecting males life expectancy for each race group
47. Agenda Methodology procedure Lee Carter Model theory Lee Carter Model theory Lee Carter Model theory Theory of
Projecting males life expectancy for each race group
48. Agenda Methodology procedure Lee Carter Model theory Lee Carter Model theory Lee Carter Model theory Theory of
Projecting males life expectancy for all provinces with
each model
49. Agenda Methodology procedure Lee Carter Model theory Lee Carter Model theory Lee Carter Model theory Theory of
Projecting males life expectancy for all provinces with
each model
50. Agenda Methodology procedure Lee Carter Model theory Lee Carter Model theory Lee Carter Model theory Theory of
Projecting males life expectancy for all races with each
model
51. Agenda Methodology procedure Lee Carter Model theory Lee Carter Model theory Lee Carter Model theory Theory of
Projecting males life expectancy for all races with each
model
52. Agenda Methodology procedure Lee Carter Model theory Lee Carter Model theory Lee Carter Model theory Theory of
Year ASM ASF WM WF BM BF
10 78.43 82.25 78.42 82.32 75.27 80.46
20 80.59 83.46 80.34 83.35 78.18 82.59
30 82.73 84.65 82.27 84.39 80.39 84.67
40 84.87 85.85 84.20 85.43 83.77 86.73
50 87.01 87.05 86.112 86.47 86.56 88.79
Table 21: Future forecast of life expectancy with model VECM for the
6 provinces
53. Agenda Methodology procedure Lee Carter Model theory Lee Carter Model theory Lee Carter Model theory Theory of
Conclusion
We show dependence in mortality between mortality index
through the cointegration analysis. We apply also the
pricing of annuity by cohort. This study was published as
conference proceedings and submitted to NAAJ.
VECM have shown better performance over ARIMA model
in backtesting samples as well as in the evaluation of error
components in explaining life expectancy at birth. It was
published in Insurance Markets and Companies: Analyses
and Actuarial Computations.
We take into account the emergence of new ethnic groups
such as hispanic and asians rather than only white and
black. In SSRN platform.
Measuring Basis risk between Canada national data and
each province. Joint work with Severine Arnold.