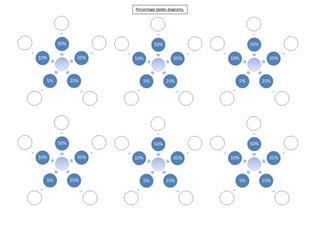
Percentage spider diagrams1
•Download as DOCX, PDF•
1 like•684 views

Percentage spider diagrams are a type of circular diagram used to compare different percentages. They show how parts of a whole relate to the total and to each other using linear segments that extend from a central point to the edge of the circle. Percentage spider diagrams allow viewers to easily see the relative sizes of different percentages and how they combine to make up the total.