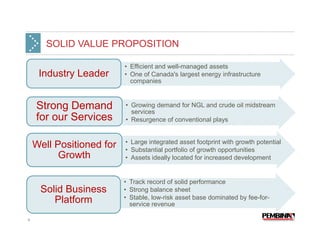
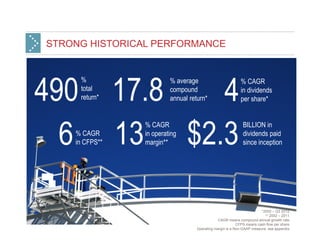
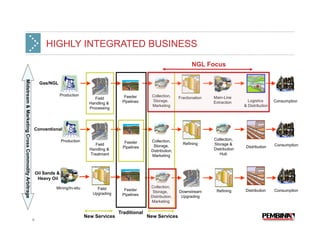
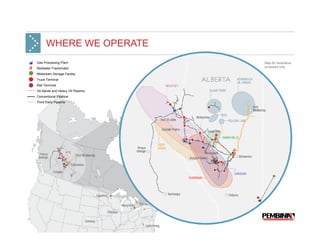
Pembina Pipeline Corporation is a midstream energy company that operates pipelines for the transportation of crude oil, natural gas liquids, and natural gas. It has a highly integrated network of pipelines and gas processing facilities located in Western Canada and North Dakota. Pembina also provides storage and marketing services for its customers. The company has a solid track record of growth through expanding its existing assets and developing new infrastructure projects to meet growing demand.
This document discusses Celanese Corporation and provides non-GAAP financial measures. It defines operating EBITDA, adjusted earnings per share, and adjusted free cash flow. It states that Celanese is a leading global producer of chemicals and advanced materials with a geographically balanced global presence and diversified end market exposure. The document also provides an overview of Celanese's integrated businesses aligned to accelerate growth.
The document summarizes Dean Scarborough's presentation at the Lehman Brothers Industrial Select Conference on February 12, 2008. It provides an overview of Avery Dennison's portfolio and strategies across its Pressure-sensitive Materials, Retail Information Services, and Office and Consumer Products segments. It also discusses the Paxar acquisition, 2008 earnings outlook, expectations for increased free cash flow, and continued dividend growth.
This document discusses Celanese Corporation's use of non-GAAP financial measures and forward-looking statements in company presentations. It provides definitions and explanations for key performance metrics used by Celanese, such as operating EBITDA, adjusted earnings per share, and adjusted free cash flow. It also notes that Celanese is unable to reconcile forecasts for these non-GAAP measures to GAAP measures. The document aims to explain these non-GAAP measures to investors and how management uses them for planning, budgeting, and evaluating financial and operating results.
1) The document summarizes Bank of America's 37th Annual Investment Conference, which included forward-looking statements and discussed various risks and uncertainties.
2) It provided an overview of Avery Dennison's portfolio of businesses, including Pressure Sensitive Materials, Office and Consumer Products, Retail Information Services, and Other Specialty Converting. It discussed strategies and outlook for each segment.
3) The acquisition of Paxar was highlighted as enhancing top-line growth and driving $115-125 million in cost synergies annually. Productivity improvements and the RFID opportunity were also emphasized as long-term value drivers.
Merrill Lynch Global Power & Gas Leaders Presentationfinance14
The document is a presentation by Exelon Corporation to investors at the Merrill Lynch Power & Gas Leaders Conference on September 25, 2007. It summarizes Exelon's strategic direction of protecting current value while growing long-term value through operational excellence, supporting competitive markets, and evaluating new growth opportunities. It highlights Exelon's strong financial performance with 12% annual operating EPS growth since 2000, and expectations for continued growth through 2011 driven by its generation business and ComEd's regulatory recovery plan. The presentation also reviews Exelon's financial policies and balance sheet capacity, positioning it well for future opportunities.
This document discusses Celanese Corporation's use of non-GAAP financial measures and provides an overview of its business segments. It notes that Celanese uses measures like operating EBITDA, adjusted earnings per share, and adjusted free cash flow to measure performance and provide guidance. It then summarizes Celanese's businesses, noting that it has globally balanced integrated businesses focused on specialty products like consumer and industrial specialties that provide more resilient earnings. Finally, it discusses strategies like reducing costs to improve performance in 2009 during challenging market conditions.
The document is FMC Technologies' 2007 annual report. It summarizes FMC's strong financial performance in 2007, with record revenue of $4.6 billion and earnings per share of $2.30. Key highlights included deploying subsea separation technology for the first time, receiving the largest subsea order in company history, and announcing plans to spin-off the FoodTech and Airport Systems businesses. The report also discusses trends in the oil and gas industry that are driving increased demand for FMC's subsea technologies and systems.
- Prudential Financial, Inc. released its Quarterly Financial Supplement for the second quarter of 2002.
- The supplement provides financial and operating highlights for Prudential's Financial Services Businesses, including revenues, income, assets under management, capitalization data and more for the quarter and year-to-date.
- Total revenues for Prudential's Financial Services Businesses were $10.2 billion for the first half of 2002, up 8% from the same period in 2001, with growth in premiums and net investment income.
3/2/07 DF Special Dividend ConferenceCallSlidesfinance23
Dean Foods Company announced a special one-time dividend of $15 per share for shareholders, totaling approximately $2 billion. The dividend is conditioned upon completing a $4.8 billion credit facility to fund the payout and refinance existing debt. The presentation reviewed Dean Foods' strong financial performance and growth strategy, and argued that now is an opportune time for the recapitalization given internal growth opportunities and favorable debt market conditions. Guidance for 2007 was updated to reflect the transaction.
The document provides an overview of the Foz do Chapecó HPP dam and reservoir project in Brazil. It includes a disclaimer noting that any forward-looking statements are based on assumptions and could differ from actual results. The agenda then outlines topics on corporate overview, operational efficiency, growth in generation business, and wide portfolio of services.
- The document provides financial results and forecasts for Monsanto Company for the second quarter of 2007 and fiscal year 2007.
- Net sales for the second quarter of 2007 were $2.6 billion, up 15% from the previous year. Earnings per share on an as-reported basis were $0.98, up 25% from the prior year.
- For fiscal year 2007, Monsanto increased guidance and now expects earnings per share of $1.60-1.65, representing 22-26% growth over the previous year, and free cash flow of $875-950 million.
- Pepco Holdings, Inc. reported on its 2006 financial and operational performance in its annual report and proxy statement. It noted lower earnings compared to 2005 due to mild weather but continued growth in shareholder value.
- Key accomplishments in 2006 included implementing balanced rate mitigation plans, filing rate cases to cover increased delivery costs, proposing a major transmission line project, agreeing to sell remaining regulated generation assets, and achieving strong performance in wholesale energy and retail energy businesses.
- Looking ahead, the company plans to focus on growth through regulatory outcomes, infrastructure investments, environmental leadership programs, and improving wholesale energy market conditions.
This document provides financial and operational highlights for Prudential Financial, Inc. for the third quarter of 2005:
- Pre-tax adjusted operating income increased 50% year-to-date compared to the same period in 2004, with strong growth in the Investment and International Insurance divisions.
- Assets under management and administration totaled $618.5 billion as of the third quarter, up from $542.9 billion in the same quarter of the prior year.
- Net income for the financial services businesses was $1.322 billion for the third quarter, up 109% from the same period in 2004.
1) Mike Waites, President and CEO of Finning International Inc., presented at an investor presentation on March 21, 2012.
2) Finning is the world's largest Caterpillar dealer, operating in Canada, South America, and the UK/Ireland with over 13,500 employees.
3) The presentation provided an overview of Finning's business segments, markets, financial results, and growth strategy to become Caterpillar's best global partner by 2015 through operational excellence, leadership, and acquisitions.
The document provides an overview of the Foz do Chapecó HPP (hydroelectric power plant) dam and reservoir project in Brazil. It discusses the company's leadership positions in electricity distribution, commercialization, and renewable energy generation. The company has over 2 million customers, 2,396 MW of installed renewable generation capacity, and follows best corporate governance practices including listing on Bovespa Novo Mercado and NYSE with ADR Level III. It is the largest private player and 2nd largest overall in Brazil's electric sector by market capitalization.
- Prudential Financial reported financial results for the fourth quarter and full year 2004 for its Financial Services Businesses.
- For the full year 2004, pre-tax adjusted operating income increased 27% to $2.5 billion compared to 2003, and after-tax adjusted operating income increased 38% to $1.8 billion.
- Assets under management and administration totaled $581.7 billion at the end of 2004, up 20% from the end of 2003, reflecting strong sales and investment returns across all divisions.
This document provides an update on Chiquita's progress against its three-year strategic plan to focus on its core banana business, drive better performance through cost reductions, and strengthen its balance sheet. Some key updates include selling non-core assets to focus on bananas, implementing cost saving programs with a target of $70 million in annual savings by 2005, reducing debt by over $100 million in 2002, and plans to invest cash flow into new growth opportunities once debt targets are met.
The document is Prudential Financial's quarterly financial supplement for the first quarter of 2002. It provides financial highlights and key metrics for Prudential and its business divisions. Some notable numbers from the first quarter include:
- Total revenues for Financial Services Businesses of $5.056 billion, up 15% from 2001.
- Pre-tax adjusted operating income for Financial Services Businesses of $523 million, up 11% from 2001.
- Net income for Financial Services Businesses of $263 million, down 35% from 2001 primarily due to realized investment losses.
- Assets under management and administration totaled $580 billion as of the end of the first quarter, down 2% from
Dick Braun describes how Parker Hannifin's Win Strategy has significantly increased both sales and margins by improved value creation and value capture. Dick will discuss layering in value management pricing strategies on top of Parker's already robust product and customer segmentation price practices. Learn the concepts of "value triangulation" - whereby the pricing team dynamically adjusts value propositions based on competitive position and customer-specific economics. See how a $12 billion global diversified manufacturer endeavors to deploy a consistent value management approach.
This document provides financial highlights and operating highlights for Prudential Financial, Inc. for the third quarter of 2004. Some key figures include:
- Pre-tax adjusted operating income for the Financial Services Businesses was $628 million for Q3 2004, up 22% from $1,482 million year-to-date 2003.
- Net income for the Financial Services Businesses was $548 million for Q3 2004, up 149% from $544 million year-to-date 2003.
- Total assets under management and administration were $542.9 billion at the end of Q3 2004, up 20% from $451.5 billion at the end of Q3 2003.
- Distribution representatives totaled
Highlights of the fourth quarter of 2010. Net sales amounted to SEK 27,556m (28,215) and income for the period was SEK 677m (664), or SEK 2.38 (2.34) per share. Net sales increased by 1.6% in comparable currencies.
Greene King reported resilient results for 2008/09 despite difficult trading conditions. Revenue increased 1.3% to £954.6 million but operating profit declined 6.7% to £216.2 million due to cost pressures. The company continued to invest in its businesses, pay down debt, and maintain its dividend. Current trading was described as encouraging.
Highlights of the first quarter of 2012. Net sales amounted to SEK 25,875m (23,436) and income for the period was SEK 559m (457), or SEK 1.96 (1.61) per share. Net sales improved by 10.4%, of which 3.5% was organic growth. The acquisitions of CTI and Olympic Group impacted sales by 5.8%.
Dean Foods reported financial results for the fourth quarter and full year of 2008. The company had strong profit growth in the fourth quarter, with adjusted operating income increasing 27% compared to the fourth quarter of 2007. For the full year, Dean Foods recovered from a weak first quarter, with adjusted operating income growing 7% despite high dairy commodity costs. The company significantly reduced debt in 2008 and expects continued earnings growth in 2009, led by the DSD Dairy and WhiteWave-Morningstar segments. Dean Foods is well positioned for 2009 despite volatility in dairy markets.
This document provides financial and operational highlights for Prudential Financial, Inc. for the second quarter of 2005:
- Pre-tax adjusted operating income for the Financial Services Businesses was $823 million, a 43% increase from the same period in 2004. Net income was $1.52 billion, an 88% increase.
- Assets under management and administration totaled $601 billion as of June 30, 2005, up 3% from the end of 2004.
- Prudential agent productivity was $42 thousand in the second quarter of 2005, up 14% from the same period in 2004.
This document summarizes Chip McClure's presentation at the Bear Stearns Global Transportation Conference on May 8, 2007. It provides highlights that Raytheon's 2007 EPS guidance is reduced but margins are improving. It is optimistic about 2008-2009 commercial vehicle volumes. The Performance Plus plan aims to add $150 million to EBITDA by 2009 through restructuring and cost reductions, with potential for more from growth initiatives. The presentation outlines restructuring expenses, benefits, and personnel reductions through 2009. It also describes plans to restore margins through collaborative efforts with customers and reductions in overhead, materials, and manufacturing costs.
1. Santander reported consistent results in Q1 2009, with attributable profit decreasing 5% year-over-year to EUR 2.096 billion. Excluding exchange rates, profit increased 9%.
2. Net interest income increased 18.8% excluding exchange rates, driven by spreads management in a low interest rate environment. Operating expenses increased 1.8% excluding exchange rates and perimeter changes, reflecting strict cost control.
3. Loan-loss provisions increased 67.8% excluding exchange rates to EUR 2.234 billion, but were lower than in Q4 2008 due to specific provisions. Generic provisions decreased as forecasted.
1) Mike Waites, President and CEO of Finning International Inc., presented at the CIBC Whistler Institutional Investor Conference on January 19, 2012.
2) Finning is well positioned for growth as the exclusive Caterpillar dealer in resource-rich territories with unmatched product support capabilities.
3) Waites discussed Finning's strategic priorities to become CAT's best global partner, including operational excellence, sales and solutions growth, and safety. He also outlined expectations to meet financial commitments around revenue growth, improved operating leverage, and investing to maintain competitive advantage.
ONEOK to Present at Bank of America Conference finance20
John Gibson, CEO of ONEOK, Inc., gave a presentation at the Bank of America Conference in Key Biscayne, Florida on November 14, 2008. The presentation outlined ONEOK's vision as a premier energy company, its diversified assets across the natural gas value chain, and its financial highlights. ONEOK is executing a strategy of rebundling services across the value chain through vertical integration and growth projects at its midstream subsidiary, ONEOK Partners.
John Gibson, CEO of ONEOK and ONEOK Partners, presented at the 18th Annual Wachovia Equity Conference in Nantucket, Massachusetts on June 24, 2008. The presentation outlined ONEOK's vision to become a premier energy company through diversified assets including natural gas distribution, energy services, and growth projects at ONEOK Partners. Key growth strategies included generating consistent growth and sustainable earnings through improving profitability, strategic acquisitions, and executing $1.6 billion in internal growth projects at ONEOK Partners through 2009.
ONEOK and ONEOK Partners to Present at Houston Energy Financial finance20
This document provides an agenda and overview for the Houston Energy Financial Forum on November 18, 2008. The presentation discusses ONEOK, Inc. and ONEOK Partners, L.P. as premier energy companies with diversified assets across the natural gas value chain. Key points include ONEOK Partners' $2 billion growth plan through internal projects between 2008-2009 focused on natural gas gathering and processing and natural gas liquids infrastructure in the Rockies. The presentation also highlights ONEOK's strategy of creating value through vertical integration and growth at ONEOK Partners, which benefits ONEOK through increasing distributions.
Dow Accelerates Implementation of its Transformational Strategy Presentationfinance5
Dow is accelerating its transformational strategy through restructuring actions to reduce costs. It will eliminate around 5,000 jobs, close 20 facilities, idle 180 plants, and reduce contractors by 6,000. This will generate an estimated $700 million restructuring charge but $700 million in annual savings by 2010. Total targeted operating cost reductions and synergies from the Rohm & Haas acquisition are $1.5 billion. Lower working capital, capital spending, and restructuring actions will reduce cash needs by $2.5 billion through 2009. Dow remains committed to its consistent dividend for shareholders.
This document discusses Celanese Corporation's use of non-GAAP financial measures and forward-looking statements in company presentations. It provides definitions and explanations for key performance metrics used by Celanese, such as operating EBITDA, adjusted earnings per share, and adjusted free cash flow. It also notes that Celanese is unable to reconcile forecasts for these non-GAAP measures to GAAP measures. The document aims to explain these non-GAAP measures to investors and how management uses them for planning, budgeting, and evaluating financial and operating results.
air products & chemicals 5 December 2007 Citi Basic Materialsfinance26
Paul Huck presented on Air Products' performance and outlook. Some key points:
1) Air Products has achieved four consecutive years of double-digit sales and earnings growth.
2) The company aims to continue delivering double-digit growth through large projects coming online, expansion in new geographies and markets, and cost reduction efforts.
3) Air Products is targeting 10-15% annual EPS growth and achieving returns well above its cost of capital through margin improvement and productivity initiatives.
1) Fidelity National Information Services presented an investor presentation in June 2008 that discussed their planned spin-off of the Lender Processing Services segment. The spin-off was intended to create two pure play companies that could better focus resources and have improved investment profiles.
2) FIS overview highlighted their leadership in payments processing and core banking software, with $2.9 billion in annual revenues and significant scale across the US and international markets.
3) Financial highlights showed strong revenue growth, expanding margins, and increasing free cash flow that could be used to invest in growth, reduce debt, pursue acquisitions and return capital to shareholders.
Pace Oil & Gas is an intermediate-sized energy company focused on growth through oil development. In 2011, oil production grew over 100% and drove a 53% increase in total production. The company has a large inventory of development opportunities across its high working interest asset base that can deliver continued production and reserve growth. Pace trades at a discount to peers despite solid operational performance and visible growth, representing underlying value for investors.
el paso D7A9D355-197F-480A-8FF4-86834B0DD876_EP_4Q_2008_Earnings_FINAL(Color...finance49
El Paso Corporation provides natural gas and related energy products. In 2008, it accomplished several key projects including placing 7 pipeline projects in service. However, it faces challenges from low commodity prices and uncertain capital markets. Key priorities are constructing its pipeline backlog on time and budget, and focusing exploration and production investments to preserve opportunities and maximize returns. El Paso increased its liquidity position and reduced borrowing costs through several financing transactions. It has excellent hedges for 2009 natural gas production and established initial hedges for 2010. Guidance for 2009 assumes $2.7-3.1 billion in capital spending and targets EPS of $0.85-1.05, EBIT of $2.0-2.3 billion,
Jp morgan -_032113_presentation_-_finalCNOServices
The document discusses CNO Financial Group's presentation at the 2013 J.P. Morgan Insurance Conference on March 21, 2013. It provides an overview of CNO Financial Group, highlighting its focus on serving the middle-income market, its track record of execution and investment in growth. Specific metrics are presented on core sales growth excluding Bankers annuities, growth in average liabilities on core business segments, and stable and growing segment earnings excluding significant items. Forward-looking statements are also noted and non-GAAP measures are referenced.
oneok ONEOK to Present at Lehman CEO Conferencefinance20
This document provides an overview and agenda for John Gibson's presentation at the Lehman Brothers CEO Energy/Power Conference on September 3, 2008 in New York City. The presentation agenda includes discussing ONEOK's vision, diversified assets including its distribution, energy services, and ONEOK Partners business segments, and key investment considerations. ONEOK Partners is highlighted as the primary growth engine, with $2 billion in internal growth projects underway from 2007 to 2009 that are expected to generate significant fee-based cash flow and EBITDA.
- Finning International provides mining and power systems solutions across Canada, South America, and the UK/Ireland.
- The company has a unique value proposition due to geographic and industry diversification, strong market positions, and a large installed equipment base that drives resilient product support revenue.
- Management is focused on operational excellence, disciplined growth, and balance sheet deleverage to achieve financial targets including sequential EBIT margin expansion, a return on equity over 18%, and strengthening the balance sheet.
Eric Feldstein, CEO of GMAC LLC - Sale of Majority Interest in GMAC - Investo...finance8
David Walker of GMAC presented a business update on January 19, 2007. GMAC aims to transform into an independent global financial services company following its separation from GM control in 2006. Key strategic priorities include strengthening GMAC's capital base, reducing borrowing costs, expanding operating margins, and increasing net income through initiatives focused on funding, capital, and operations. GMAC maintains significant liquidity protection and plans to diversify its business beyond GM while growing profitable operations internationally and fee-based services.
Delivering Synergies : A closer look at post merger integrationSanjay Uppal
1) The document discusses Emirates NBD's integration process following its merger in 2007.
2) It outlines key stages of integration including designing an integration plan, establishing dedicated integration teams, and communicating expected synergies.
3) By mid-2008, Emirates NBD had exceeded synergy targets for the year, achieving cost savings and revenue increases through initiatives like branch consolidation and cross-selling.
This document discusses Celanese Corporation's performance in 2008 and strategies going forward. It contains the following key points:
1. Celanese reported strong financial results for the third quarter and year-to-date 2008, despite challenging market conditions.
2. The company has executed a strategy focused on specialty businesses and divesting non-core assets to create a more resilient portfolio.
3. Going forward, Celanese aims to accelerate growth in specialty businesses like Consumer Specialties and leverage its integrated operations and global positions.
PennVirginiaCorp Investors Presentation May 2011PennVirginiaCorp
Penn Virginia Corporation is investing more capital in oil and natural gas liquids plays. It plans to spend $320-370 million on capital expenditures in 2011, with 77% directed towards oil and liquids-rich projects. The company maintains a diversified portfolio of assets concentrated in several core operating regions, including the Eagle Ford shale, where it is continuing to build its acreage position and drill its multi-year inventory of locations. Penn Virginia aims to generate value through a track record of growth, high-quality operating assets, and a focus on rate-of-return based capital allocation decisions.
Presentation Clayton Valley, NevadaFrom Drilling to PEA in under 2 YearsCompany Spotlight
The document summarizes Cypress Development Corp's Clayton Valley lithium project in Nevada. Key points include:
- A Preliminary Economic Assessment shows promising economics including a 32.7% IRR and $1.45 billion NPV.
- Measured and indicated resources total 8.9 million tonnes LCE with additional inferred resources.
- The project has the potential for low-cost production due to favorable geology and metallurgy.
- Upcoming catalysts in 2019 include a metallurgical study and prefeasibility study to further de-risk the project.
Aben Resources has made a new high-grade gold discovery at its flagship Forrest Kerr project in BC's Golden Triangle region. The region is known for major gold deposits and saw $100 million in exploration spending in 2017. Recent improvements have made the Forrest Kerr project more accessible via new roads. Aben's technical team has reinterpreted historical data and identified additional exploration targets. The project covers over 23,000 hectares of prospective geology along the Forrest Kerr fault zone that is similar to other major deposits in the Golden Triangle.
Aben Resources has discovered high-grade gold zones at its Forrest Kerr project in British Columbia's Golden Triangle. The first hole of the 2018 drill program intersected four separate high-grade gold zones within 190 metres, including 331.0 g/t Au over 1.0 metre. Aben plans to expand drilling at the Boundary North Zone and test other gold anomalies identified through soil sampling. The company also holds the Justin project in Yukon and Chico project in Saskatchewan near recent discoveries.
Cypress Development Corp. owns lithium claims in Clayton Valley, Nevada near Albemarle's Silver Peak lithium mine. A preliminary economic assessment found the project could have a 32.7% IRR and $1.45 billion NPV. The project would extract lithium from claystone using leaching and have average annual production of 24,042 tonnes of lithium carbonate over 40 years. Capital costs are estimated at $482 million to build a 15,000 tonne per day operation.
The document discusses Aben Resources Ltd., a gold exploration company with projects in British Columbia's Golden Triangle region and other areas of Western Canada. It provides an overview of Aben's management team and directors, flagship Forrest Kerr project, recent drilling results showing new high-grade gold discoveries, and its strategy to advance exploration through 2018. The document also briefly outlines Aben's other projects including the Chico gold project in Saskatchewan and Justin gold project in Yukon.
Cypress Development Corp. owns the Clayton Valley lithium project in Nevada. Drilling in 2017 intersected lithium-bearing claystone averaging 921 ppm Li over 77 meters thick. A maiden resource estimate calculated 3.287 million tonnes of lithium carbonate equivalent in the indicated category and 2.916 million tonnes LCE in inferred. Metallurgical tests show the claystone is acid leachable and able to recover over 80% of the lithium. Cypress plans additional drilling, engineering studies, and permitting to advance the project towards production.
- Aben Resources has three highly prospective gold projects in Western Canada including its flagship Forrest Kerr Project in BC's Golden Triangle region, which had recent drilling success expanding the Boundary North Zone.
- Management has over 100 years of combined experience in Western Canada and a proven track record of success.
- The projects have significant historic work identifying high-grade gold and robust discovery potential remains.
Cypress Development Corp. owns the Clayton Valley lithium project in Nevada. Drilling in 2017 intersected lithium-bearing claystone averaging 921 ppm Li over 77 meters. A maiden resource estimate classified over 1.3 million tonnes of lithium carbonate equivalent as indicated and inferred. Metallurgical testing shows the claystone is leachable with over 80% lithium recovery. Cypress aims to advance the project with engineering studies and further drilling to define resources with the goal of becoming a domestic lithium producer for the growing battery market.
The document provides forward-looking statements and discusses risks associated with such statements. It notes that some statements may be deemed forward-looking and lists factors that could cause actual results to differ from forward-looking statements. The document also identifies the qualified person for the technical information as Cornell McDowell and provides Aben's trading symbols and recent share information.
The document provides an overview of Aben Resources Ltd., a mineral exploration company with gold projects in Western Canada. It summarizes Aben's three key projects - Forrest Kerr in BC's Golden Triangle region with recent drill results discovering the Boundary Zone, Chico in Saskatchewan near producing mines, and Justin in Yukon's White Gold district. It outlines the management team's expertise and provides company details like shares outstanding and trading symbols.
- Cypress Development Corp owns the Clayton Valley lithium project in Nevada located near Albemarle's Silver Peak lithium brine operation.
- Drilling in 2017 encountered lithium mineralization averaging 921 ppm Li over 77 meters in 14 holes drilled.
- Metallurgical tests show the claystone is acid leachable with over 80% lithium extraction possible.
- Cypress aims to define a resource estimate in 2018 and advance the project with feasibility studies to develop a lithium operation.
The document discusses forward-looking statements and provides disclaimers about them. It introduces the qualified person for the technical information presented. It also lists Aben's trading symbols and recent share information including price and market capitalization.
1) Cypress Development Corp owns the Clayton Valley lithium project located next to Albemarle's Silver Peak mine in Nevada. Drilling in 2017 intersected lithium-bearing claystone averaging over 900 ppm Li to a depth of over 100 meters.
2) A maiden resource estimate classified over 1.5 million tonnes of lithium carbonate equivalent as indicated and inferred. Metallurgical testing shows the claystone is acid leachable to extract over 80% of the lithium.
3) The project is located in a strategic location to supply the growing lithium-ion battery market in the US, with lithium demand accelerating due to the increased production of electric vehicles globally.
TerraX Minerals is a Canadian mineral exploration company focused on exploring and developing its 100% owned 772 square km Yellowknife City Gold project located adjacent to the city of Yellowknife, Northwest Territories. The project covers high-grade Archean gold districts and has had multiple high-grade gold discoveries. TerraX has a strong management team with experience discovering and developing gold deposits and low exploration costs due to the project's excellent infrastructure and year-round access near Yellowknife.
This document discusses forward-looking statements and provides information about Aben Resources Ltd., including its stock symbols, shares outstanding, recent share price, market capitalization, and three gold exploration projects in Western Canada. It summarizes the management team's experience and the company's investment highlights. Specifically, it owns the Forrest Kerr gold project in British Columbia's Golden Triangle region, which saw successful drilling results in 2017 that led to a new discovery called the North Boundary zone.
Cypress Development Corp owns lithium claystone deposits in Clayton Valley, Nevada near Albemarle's Silver Peak lithium mine. Drilling in 2017 encountered lithium mineralization averaging 921 ppm Li over 77 meters in 14 holes. Metallurgical tests show the claystone is acid leachable with up to 80% lithium extraction. Cypress plans additional drilling, process engineering, and a preliminary economic assessment in 2018 to advance the project. The company sees potential for the project given growing lithium demand from electric vehicles and batteries.
TerraX Minerals is a Canadian mineral exploration company focused on exploring its 100% owned 772 square km Yellowknife City Gold project located near Yellowknife, Northwest Territories. The project covers high-grade Archean gold districts with known deposits and past producers. TerraX has made multiple high-grade gold discoveries on the property and identified several high-priority targets for further exploration and drilling. The company has a strong management team with experience discovering and developing deposits in the region.
Cypress Development Corp owns lithium claystone deposits in Clayton Valley, Nevada that have the potential to be a significant lithium resource. Drilling in 2017 encountered mineralization averaging 921 ppm lithium over 77 meters thick in 14 drill holes. Metallurgical testing shows the claystone is acid leachable with up to 80% lithium extraction. Cypress plans additional drilling, metallurgical testing, and a preliminary economic assessment in 2018 to further define the resource potential.
Cypress Development Corp owns lithium claystone deposits in Clayton Valley, Nevada near Albemarle's Silver Peak lithium mine. Drilling in 2017 encountered mineralization averaging 921 ppm lithium over 77 meters thick in 14 drill holes. Metallurgical tests show the claystone is acid leachable with up to 80% lithium extraction. Cypress plans additional drilling, metallurgical testing, and a preliminary economic assessment in 2018 to evaluate the project's potential.
Cypress Development Corp is exploring for lithium resources in Clayton Valley, Nevada. Recent drilling has encountered lithium-bearing claystone up to 112 meters below surface, with grades averaging over 800 ppm lithium. Metallurgical testing indicates 80% of the lithium can be extracted using a weak sulfuric acid solution. Cypress plans additional drilling in 2018 and expects to publish a initial lithium resource estimate in Q1 2018 to advance the project towards a preliminary economic assessment. The project is located near existing lithium production and infrastructure to be a potential new supply of lithium for the growing battery market.
Methanex is the world's largest producer and supplier of methanol. We create value through our leadership in the global production, marketing and delivery of methanol to customers. View our latest Investor Presentation for more details.
UnityNet World Environment Day Abraham Project 2024 Press ReleaseLHelferty
June 12, 2024 UnityNet International (#UNI) World Environment Day Abraham Project 2024 Press Release from Markham / Mississauga, Ontario in the, Greater Tkaronto Bioregion, Canada in the North American Great Lakes Watersheds of North America (Turtle Island).
ZKsync airdrop of 3.6 billion ZK tokens is scheduled by ZKsync for next week.pdfSOFTTECHHUB
The world of blockchain and decentralized technologies is about to witness a groundbreaking event. ZKsync, the pioneering Ethereum Layer 2 network, has announced the highly anticipated airdrop of its native token, ZK. This move marks a significant milestone in the protocol's journey, empowering the community to take the reins and shape the future of this revolutionary ecosystem.
Cleades Robinson, a respected leader in Philadelphia's police force, is known for his diplomatic and tactful approach, fostering a strong community rapport.
World economy charts case study presented by a Big 4
World economy charts case
World economy charts case study presented by a Big 4
World economy charts case study presented by a Big 4World economy charts case study presented by a Big 4
World economy charts case study presented by a Big 4
World economy charts case study presented by a Big 4World economy charts case study presented by a Big 4World economy charts case study presented by a Big 4World economy charts case study presented by a Big 4World economy charts case study presented by a Big 4World economy charts case study presented by a Big 4World economy charts case study presented by a Big 4World economy charts case study presented by a Big 4World economy charts case study presented by a Big 4World economy charts case study presented by a Big 4World economy charts case study presented by a Big 4World economy charts case study presented by a Big 4World economy charts case study presented by a Big 4World economy charts case study presented by a Big 4study presented by a Big 4
2. FORWARD-LOOKING STATEMENTS & INFORMATION
This presentation is for information purposes only and is not intended to, and should not be construed to constitute, an offer to sell or the solicitation of
an offer to buy, securities of Pembina Pipeline Corporation. This presentation and its contents should not be construed, under any circumstances, as
investment, tax or legal advice. Any person accepting delivery of this presentation acknowledges the need to conduct their own thorough
investigation into Pembina and its activities before considering any investment in its securities.
In the interest of providing investors with information regarding Pembina, including management's assessment of Pembina's future plans and
operations, certain statements and information contained in this presentation constitute forward-looking statements or information within the meaning
of the "safe harbour" provisions of applicable securities legislation. Such forward-looking information and statements relate to business strategy and
plans, financial performance, the stability and sustainability of cash dividends, expansion and diversification opportunities and other
expectations, beliefs, goals, objectives, assumptions or statements about future events or performances. Undue reliance should not be placed on
these forward-looking statements and information as both known and unknown risks and uncertainties may cause actual performance and financial
results to differ materially from the results expressed or implied.
Forward-looking statements and information are based on Pembina Pipeline Corporation's expectations, estimates, projections and assumptions in
light of its experience and its perception of historical trends as well as current market conditions and perceived business opportunities. These
statements are not guarantees of future performance and are subject to a number of known and unknown risks and uncertainties including but not
limited to: the impact of competitive entities and pricing; reliance on key alliances and agreements; the strength and operations of the oil and natural
gas industry and related commodity prices; regulatory environment; fluctuations in operating results; the availability and cost of labour and other
materials; the ability to finance projects on advantageous terms; and tax laws and tax treatment. Additional information on these factors as well as
other factors that could impact Pembina's operational and financial results are contained in Pembina's Annual Information Form and Management's
Discussion and Analysis, and described in our public filings available in Canada at www.sedar.com and in the United States at www.sec.gov.
Readers are cautioned that this list of risk factors should not be construed as exhaustive.
The forward-looking statements contained in this document speak only as of the date of this document. Except as expressly required by applicable
securities laws, Pembina and its subsidiaries assume no obligation to update forward-looking statements and information should circumstances or
management's expectations, estimates, projections or assumptions change. The forward-looking statements contained in this document are
expressly qualified by this cautionary statement.
In this presentation, we refer to certain financial measures such as total enterprise value, EBITDA and operating margin that are not determined in
accordance with International Financial Reporting Standards ("Canadian GAAP"). For more information about these non-GAAP measures, see note 1
in the Appendix to this presentation. All financial information is expressed in Canadian dollars unless otherwise specified.
2
3. CORPORATE PROFILE
Common Shares Outstanding (1) 291.4 million
Current Common Share Trading Price (1) $27.99
52-Week Trading Range $23.55 - $31.15
Market Capitalization (2) $8.9 billion
Total Enterprise Value (2) $10.8 billion
Annualized Dividend $1.62/share
Effective Yield (1) 5.8%
3 (1) As at November 2, 2012
(2) As at November 2, 2012
4. SOLID VALUE PROPOSITION
• Efficient and well-managed assets
Industry Leader • One of Canada's largest energy infrastructure
companies
Strong Demand • Growing demand for NGL and crude oil midstream
services
for our Services • Resurgence of conventional plays
• Large integrated asset footprint with growth potential
Well Positioned for • Substantial portfolio of growth opportunities
Growth • Assets ideally located for increased development
• Track record of solid performance
Solid Business • Strong balance sheet
• Stable, low-risk asset base dominated by fee-for-
Platform service revenue
4
5. STRONG HISTORICAL PERFORMANCE
490 17.8 4
% % average % CAGR
total compound in dividends
return* annual return* per share*
6 13 $2.3
% CAGR BILLION in
% CAGR in operating dividends paid
in CFPS** margin** since inception
*2002 – Q3 2012.
** 2002 – 2011.
5 CAGR means compound annual growth rate.
CFPS means cash flow per share.
Operating margin is a Non-GAAP measure, see appendix.
6. HIGHLY INTEGRATED BUSINESS
NGL Focus
Midstream & Marketing Cross Commodity Arbitrage
Gas/NGL
Production Feeder Collection,
Field Fractionation Main-Line
Pipelines Storage, Extraction Logistics Consumption
Handling &
Marketing & Distribution
Processing
Conventional
Production Collection, Collection,
Feeder Refining Storage &
Field Storage, Consumption
Pipelines Distribution
Handling & Distribution, Distribution
Treatment Marketing Hub
Oil Sands &
Heavy Oil
Mining/In-situ Field Collection,
Feeder Storage, Downstream Refining Distribution Consumption
Upgrading Pipelines Distribution, Upgrading
Marketing
Traditional
New Services New Services
6
7. WHERE WE OPERATE
Gas Processing Plant Map for illustrative
Redwater Fractionator purposes only.
Midstream Storage Facility
Truck Terminal
Rail Terminal
Oil Sands and Heavy Oil Pipeline
Conventional Pipeline
Third Party Pipeline
7
8. OUR BUSINESS AT A GLANCE
CONVENTIONAL PIPELINES OIL SANDS & HEAVY OIL
7,850 km network transports 1,650 km of pipelines with 30% of
approximately 50% of Alberta's total take-away capacity from the
conventional crude oil & about 30% Athabasca oil sands
of western Canada's NGL
GAS SERVICES MIDSTREAM
Natural gas gathering & Liquids terminals, over 12
processing capacity of 410 mmbbl storage capacity, and
MMcf/d gross (355 MMcf/d net), product marketing
enhanced liquids extraction
capacity of 205 MMcf/d & 350 2.4 bcf extraction capacity
km associated gathering
73,000 bpd fractionation
systems; currently under
capacity at Redwater
expansion
(1) Pro forma to include Provident
8
10. CONVENTIONAL PIPELINES BUSINESS
Map for illustrative
• Approx. 7,850 km network: purposes only.
• 6 crude oil and condensate pipelines and 4 NGL
pipelines
• Transports ~ 50% of Alberta's conventional crude
oil production
• Transports ~ 30% of NGL produced in western
Canada
• Proximal to prolific geology
• First nine month’s 2012 average
throughput: 448.2 mbpd
• 9% increase over same period in 2011
• Integrated with Gas Services and
Midstream & Marketing
• Connected to regional refineries and
export pipelines
NEBC/Western System Northern System
Peace System Swan Hills System
Drayton Valley System Bonnie Glen System (50% Operated)
10 Liquids Gathering System (LGS) Brazeau NGL System
11. PEMBINA'S CONVENTIONAL THROUGHPUT
• Strong industry performance combined with strategically located assets has led
to strength in Pembina's throughput profile
448,200 bpd
500
413,900 bpd
393,300 bpd 374,000 bpd
400
(mbpd)
300
200
100
0
Q1 2009 Q2 2009 Q3 2009 Q4 2009 Q1 2010 Q2 2010 Q3 2010 Q4 2010 Q1 2011 Q2 2011 Q3 2011 Q4 2011 Q1 2012 Q2 2012 Q3 2012
Crude & Condensate NGL
11 Capacity Expansions of 200,000 bpd Currently Underway
12. CONVENTIONAL CAPACITY INCREASING
• Major pipeline systems utilizing ~ 90% of capacity
Pre Expansion Post Expansion
Crude Systems Completion
Capacity (bpd) Capacity (bpd)
Bonnie Glen 83,000 83,000
Drayton Valley 140,000 190,000 Completed
40,000 bpd – Q4 2013
Peace LVP 155,000 250,000
55,000 bpd - Mid to-late 2014
Swan Hills 68,000 68,000
Over 40%
Total Crude Systems 456,000 591,000
Pre Expansion Post Expansion
Capacity
NGL Systems
Capacity (bpd) Capacity (bpd) Expansions
Brazeau NGL Gathering 60,000 60,000
17,000 bpd – Q1 2013
Northern 35,000 105,000
53,000 bpd – Early to-mid 2015
Peace HVP 80,000 115,000 35,000 bpd – Q4 2013
Total NGL Systems 175,000 280,000
Total
12
621,000 871,000
14. OIL SANDS & HEAVY OIL BUSINESS
• Five oil sands / heavy oil /
diluent pipeline systems
• Syncrude Pipeline
• Horizon Pipeline
• Cheecham Lateral
• Nipisi & Mitsue Pipelines
• ~ 870,000 bpd contracted
capacity
• Potential to vertically integrate
with Pembina's storage and
terminals
• Embedded expansion
opportunities in existing
contracts
Map for illustrative purposes only,
14
using third party info.
18. GAS SERVICES BUSINESS
• Strategically positioned infrastructure
• Regional wells contain NGL of
approximately 75 bbls/MMcf
• Underpinned by long-term
contracts
Gas Services Pipelines
Conventional Pipelines
• Cutbank Complex: 410 MMcf/d of Proposed Pipelines
sweet gas processing capacity (355
MMcf/d net to Pembina)
• Musreau: 205 MMcf/d enhanced
liquids extraction capacity
• Enhanced liquids recovery:
two Pembina pipeline connected
ethane-plus extraction facilities under
construction
• Resthaven – 200 MMcf/d
(~130 MMcf/d net)
• Saturn – 200 MMcf/d Other Pembina Pipelines
Map for
illustrative
purposes only.
18 Gas Processing Plants
19. CAPITAL PROJECT OPPORTUNITIES
2012 CAPITAL BUDGET INCLUDES:
MUSREAU EXPANSION
• 50 MMcf/d shallow cut expansion
• 2012 capital commitment of ~$25 million
• Commissioned August 2012
SATURN
• 200 MMcf/d liquids extraction facility
• 2012 capital commitment of ~$100 million
• Commissioning expected late 2013
• Underpinned by long-term firm service
agreements
• Up to 13,500 bpd of incremental NGL
RESTHAVEN
• 200 MMcf/d liquids extraction facility (65% WI)
• 2012 capital commitment of ~$100 million
• Commissioning expected early 2014
• Underpinned by long-term firm service
agreements
• Up to 13,000 bpd of incremental NGL
• Future growth potential through expansion
19
22. MIDSTREAM
CRUDE OIL MIDSTREAM
• Three pipelines and associated services
• 14 truck terminals
• Three hub locations in the greater Edmonton/Fort Saskatchewan
area that form the Pembina Nexus Terminal
NGL MIDSTREAM
REDWATER WEST
• Younger extraction facility (750 MMcf/d gross capacity, 325 MMcf/d
net capacity)
• Redwater Facility: 73,000 bpd fractionator, 12 pipeline receipt and
delivery points, 6.8 mmbbls of salt-cavern storage and 80,000 bpd
condensate rail terminal
EMPRESS EAST
• 2.1 bcf/d extraction capacity
• 30,000 bpd fractionation capacity
• 6.0 mmbbls of storage accessible to higher priced Eastern markets
22
23. CRUDE OIL MIDSTREAM
Three hub locations in
TERMINALLING & HUB SERVICES: the greater Edmonton /
Fort Saskatchewan area
• Develop and provide terminal, hub & that form the Pembina
Nexus Terminal
storage services
• Interest in 13 truck terminals & one
full service terminal
• 630,000 barrels of above ground
crude oil and condensate storage
capacity
• Potential
to expand Three pipelines &
up to associated linefill
3,000,000
barrels
Gas Processing Plant
Redwater Fractionator
Midstream Storage Facility Map for illustrative
Truck Terminal purposes only.
Rail Terminal
Midstream Operations
Other Pembina Pipeline
23 Third Party Pipeline
25. CRUDE OIL MIDSTREAM CAPITAL PROJECTS
2012 CAPITAL BUDGET INCLUDES
FULL SERVICE TERMINAL (FST) EXPANSION
• Focused on emulsion treating, produced
water handling and water disposal
• Converting two existing truck terminals to
FSTs and constructing a new greenfield
location
• 2012 capital budget of ~ $35 million
• Inventory of 15 opportunities
25
26. NGL MIDSTREAM: REDWATER WEST
Cost-of-Service Pipelines:
Product Market Liquids Gatherings System
100% Pembina (LGS):
100% Pembina
C2 Alberta Petrochemical
38,500 bpd capacity
C3 Exported by rail and pipeline Pipeline and batch storage
C4 Refineries, Oil Sands, etc.
C5 Oil Sands
Younger Pembina NGL Pipeline
Younger Straddle Plant and Fort Saskatchewan
Fractionator:
43% of Straddle Plant Pembina
750 MMcfd capacity
100% of facility output through
long term contract
Redwater C2+ Fractionator:
100% Pembina
73,000 bpd capacity
Storage, rail and truck loading
Commercial Cavern Storage Connected to specification pipelines
6.8 mmbbl Alberta
26
28. NGL MIDSTREAM: HIGHLIGHTS
REDWATER WEST EMPRESS EAST
PEMBINA ADVANTAGE PEMBINA ADVANTAGE
Located to capture oil sands and other Most efficient plant at Empress
emerging gas liquids growth opportunities Ability to extract condensate at Empress
Low-cost expansion capabilities with ample Access via Enbridge Pipeline to central
room to grow Canadian NGL markets
Large-scale, sulphur capable ethane-plus Growing Bakken supply
fractionation at Redwater
Growing opportunities at Corunna from
Largest NGL rail yard in Canada emerging Eastern shale plays
OPPORTUNITIES OPPORTUNITIES
Hydrocarbon storage demand continues to Location of Corunna facility ideal to
grow, facilitates further cavern development enhance storage and terminalling activities
Increased liquids rich natural gas drilling
provides increased supply for the entire
Redwater West system
28
29. REDWATER WEST CAPITAL PROJECTS
FRACTIONATION CAPACITY EXPANSION
• 8,000 bpd expansion
• 2012 capital commitment of ~$15 million
• Fee-for-service commercial structure
• Commissioned Q3 2012
STORAGE DEVELOPMENT
• Five caverns under development; capability for 34 on existing land
• 2012 capital commitment for caverns and associated facilities of ~ $125 million
• Fee-for-service and cost-of-service commercial structures
29
31. MAJOR PROJECT BREAKOUT
PORTFOLIO OF $4 BILLION OF UNRISKED CAPITAL PROJECTS
REMAINING
PROJECT BUSINESS UNIT 2012 CAPITAL IN SERVICE
CAPITAL
Saturn Gas Services / Conventional Pipelines $125 $75 Q4 – 2013
Resthaven Gas Services / Conventional Pipelines $115 $115 Q1 – 2014
NGL Expansion Conventional Pipelines $55 $45 2012 – 2013
NGL Expansion – Phase II Conventional Pipelines $330 Early to-mid 2015
Truck Terminals Midstream & Marketing $35 $15 2013+
Crude Expansion Conventional Pipelines $30 Q3 – 2013
Conventional Pipelines
Crude Expansion – Phase II $215 Mid to-late 2014
Musreau Expansion Gas Services $25 Q3 – 2012
Storage and Other - $310 2012 – 2013
2012 Capital Budget and
- $700 $795 2012 – 2013
Committed Capital
31 Anticipated EBITDA Addition of $120 - $160 Million by 2014
32. LIQUIDITY & ACCESS TO CAPITAL
ACCESS CAPITAL AT ATTRACTIVE RATES
• Sufficient funding for near-term projects
• DRIP(1) currently raising ~ $22 million/month
WELL
• $1.5 billion credit facility
POSITIONED
• Excellent relationships with capital providers
TO EXECUTE
PRUDENT & FLEXIBLE CAPITAL STRUCTURE
OUR
• Senior debt to total capital ~ 27%(2)
BUSINESS
• BBB credit ratings
PLAN
Committed To Maintaining Our Investment Grade Rating
32 (1) DRIP is the Premium Dividend™ and Dividend Reinvestment Plan.
(2) As at September 30, 2012.
33. THE END OF THE LINE
BOB MICHALESKI, Chief Executive Officer
MICK DILGER, President and Chief Operating Officer
PETER ROBERTSON, Vice President, Finance and Chief Financial Officer
SCOTT BURROWS, Senior Manager, Corporate Development and Planning
Pembina Pipeline Corporation www.pembina.com
Suite 3800, 525 – 8th Avenue S.W.
Calgary, AB T2P 1G1
Phone 403-231-3156
Fax 403-237-0254
Toll Free 1-855-880-7404
Email investor-relations@pembina.com
TRUSTEE, REGISTRAR & TRANSFER AGENT
Computershare Trust Company of Canada
Suite 600, 530 – 8th Avenue S.W.
Calgary, Alberta T2P 3S8
1-800-564-6253
33
34. APPENDIX
1. This presentation uses the terms "total enterprise value" (Pembina's market capitalization plus
long-term debt and convertible debentures), "EBITDA" (earnings before income taxes,
depreciation and amortization) and "operating margin" (revenue less operating expenses and
product purchases), which are not recognized under Canadian generally accepted accounting
principles (GAAP). Management believes these non-GAAP measures provide an indication of the
results generated by Pembina's business activities and the value those businesses generate.
Investors should be cautioned that these non-GAAP measures should not be construed as an
alternative to net earnings, cash flow from operating activities or other measures of financial
performance determined in accordance with GAAP as an indicator of Pembina's performance.
Furthermore, these measures may not be comparable to similar measures presented by others.
34