Download to read offline
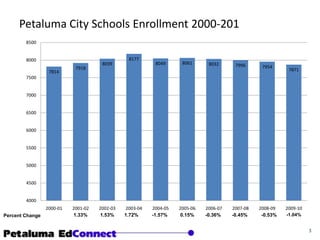
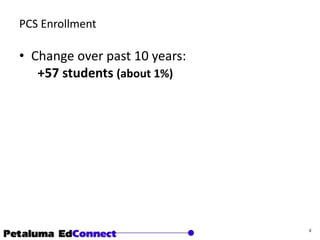
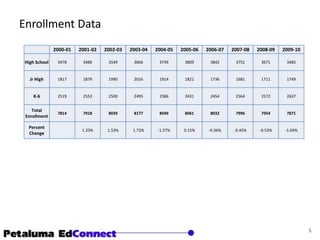
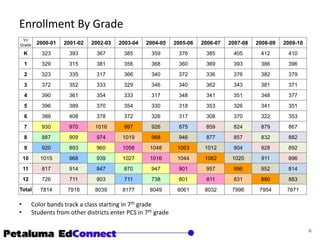
The document summarizes enrollment data for Petaluma City Schools from 2000 to 2010. It shows that enrollment increased by 57 students over the past 10 years, which is about a 1% growth. A chart displays the annual percentage changes in enrollment, with numbers ranging from -1.57% to +1.72%. Another chart tracks individual grades over the 10-year period to show how specific classes progressed through the school system.


