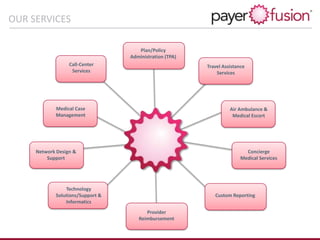
Take a deeper look at the operations of PayerFusion. Learn about the services we provide, how we can help better the healthcare industry, and the benefits of partnering with us.
Malad Call Girl in Services 9892124323 | ₹,4500 With Room Free Delivery
PayerFusion Operational Overview
1. May 21, 2013
A six sigma-total quality management company.
The next generation of cost containment and claims management technology.
Operational Overview
2013
2. We use a combination of HIPPA Compliant technologies and services to provide the
next generation of claims management solutions.
• Privately held company with corporate offices in
Miami.
• Proprietary provider network and a zero balance
billing guarantee.
• Technology that supports 3rd party administrators,
payers and providers.
• State-of-the-art Internet-based software for payer
processing.
• Flexibility to enable payer-specific customizations.
• Experts in billing guidelines and coding standards,
network development and payment execution and
receivables.
OVERVIEW
3. Our mission is to assist insurance companies, self-insured multi-national
companies and providers in settling claims in a fair and timely manner.
• Promoting our clients’ branding and awareness in the International and
Domestic marketplace.
• Reducing average claim payment cycles with established financial commitments
and guidelines.
• Reducing administrative expenditures of collection efforts by providers and
unnecessary parties that delay payments and provide no patient steerage.
• Providing superior customer service to all stakeholders.
• Maintaining a technological edge through service delivery.
• Securing the elimination of silent PPO, simplifying administration of services
and facilitating an increase in patient base.
• Keeping abreast of the transient regulatory changes of the US payer
marketplace.
OUR MISSION
4. OUR SERVICES & THE INDUSTRY
• PayerFusion represents a cost effective solution
for the Provider with effective and consistent
cash flow matrixes, designed and analyzed to
each payer in each geographic area of the world
or point of origin.
• Our process focuses on fair equitable payment
based on time, the value of money and the AM
Best classes of payers (risk assessment).
• Times are changing in the U.S. healthcare
market, most solution offers represent “more of
the same”.
• PayerFusion moves away from the traditional
PPO discount and customizes a successful
structure for Provider and Payer.
5. PayerFusion is dedicated to assist international payers
in finding effective solutions to support policy
compliance and administration.
• Provide guidance and forward thinking in structuring policy and claims
models for non-USA companies and domestic companies
• Advising on the best practices for preserving premium ratios and
competitive advantage.
• Maintain international payer brand recognition while keeping claims
costs consistent with USA domestic companies.
WHY PAYERFUSION?
6. • Unparalleled market experience.
• Seasoned, well-integrated and collaborative management team.
• Forward thinking approach connecting our knowledge and vision for
healthcare reform to proactive policies and procedures.
• A commitment to excellence.
• A Six Sigma approach to continuous quality improvement.
• Technology solutions to provide you with complete transparency, access
and information to help you manage your portfolio.
• Bottom line results: We help you control your cost per claim and
effectively deal with healthcare inflation.
WHY PAYERFUSION?
7. PayerFusion Holdings LLC
PayFuseNet LLC
• The legal structure of PayerFusion ® has
existed since 2009. Florida Limited Liability
Company.
• Obtained licenses in all State and passed
the strict requirements of the insurance
commissioners in each and every State, this
is an important seal of approval of the
authorities of integrity.
• No legal pending matters in any State or
with any entity.
• Our principals and management have been
in the industry for more than 30 years.
• Many key management staff have worked
together before which helps foster a strong
team with industry knowledge and a
commitment to excellence.
LEGAL STRUCTURE
8. LEADERS IN OUR FIELD
• Founder and CEO of HAA Preferred Partners, LLC, a U.S. based preferred provider
organization and third party administrator (sold 2007).
• Grew company from $0 to $12MM in revenue and became recognized as top
quality provider operating in an ISO certified environment transacted over 150
million dollars in claims, company growth in excess of 25% annually- sold 2007.
• Former Director with Blue Cross and Blue Shield of Florida and the Federal
Medicare.
• Former Executive at Mount Sinai Medical Center, Miami Beach, Florida, a non-
profit, 600 + plus bed teaching hospital of national recognition.
• Graduate degrees in Healthcare Administration and Public Health.
• Member of President Bill Clinton’s healthcare reform task force.
• Recipient of the Woman of the Year Award by President George W Bush and the
Republican Party in 2005.
• Participant in President Barack Obama’s healthcare reform support task force.
Griselle Chernys
President & CEO
11. OUR SERVICES
Medical Case
Management
Network Design &
Support
Technology
Solutions/Support &
Informatics
Travel Assistance
Services
Plan/Policy
Administration (TPA)
Concierge
Medical Services
Air Ambulance &
Medical Escort
Provider
Reimbursement
Custom Reporting
Call-Center
Services
12. SERVICE OPTIONS
OPTION1:FULLSERVICE
OPTION2:CLAIMMANAGEMENTSERVICES
OPTION3:COSTREPRICINGSERVICES
Our complete service
option provides our clients
with 24/7 access to call
center services that are
customized to your specific
needs and requirements.
We will customize other
processes and SLA’s to meet
your needs and standards.
• Care Setting
• Care Assistance Services
• Claims Management
• Case Management &
Utilization Review
• Utilization of PayFuseNet
Provider Network
• Bill Review & Auditing
• Customer & Client Services
With this
option, PayerFusion
handles only the health
policy portion of the travel
policy. This option allows
the client to take
advantage of PayerFusion’s
expertise in medical claims
management, utilization
review, and our
comprehensive networks
and savings.
• Claims Management
• Case Management &
Utilization Review
• Utilization of
PayFuseNet Provider
Network
• Incident management
This option is for clients
who perform their own call
center functions, case
management and claims
review in-house. Approved
claims are submitted to
PayerFusion for re-pricing
via our networks. We also
administer claims in the
Caribbean, Canada, Central
and South America and
other parts of the world.
With this option, the client
may choose to execute the
payments or PayerFusion
can execute and adjudicate
the claim.
• Re-pricing for US &
International Claims
• Provider
Reimbursement
(optional)
13. • Cost Plus – Claims Reduction
• Network Affiliates
• Claim Analysis and Validation
• Fraud Detection
• Benefits Verification and
Coordination
• Claims Processing & Provider
Payment
• Secured/Firewall Environment
• Customized PPay (Explanation of
Benefits)
• Customized Batch Processing
• Zero Balance Confirmation
Claims Management CapabilitiesCLAIMS MANAGEMENT
14. Case Pre-Settlement
• The process of pre-settlement is
modeled according to our Cost Plus
methodology. It uses the estimated
charges (reserves) calculated by our
Medical Case department and the
benchmark data from the government
sources.
• There are multiple ways to pre-arrange payment settlement by packaging conditions.
For example: (1) cardiac, (2) labor and delivery, (3) orthopedic surgery, (4) solid organ
transplant.
• Case pre-settlement guarantees our ability to obtain a fair price for quality services and
it ensures there is no over-utilization.
• Handling an entire episode of care allows us to expedite the claims processing and
payment to the provider, which further reduces the cost per claim and recognizes the
client as a good payer.
CLAIMS MANAGEMENT
15. Claim Analysis & Validation
• This function consists in reviewing each
claim for billing discrepancies in the
structure of the case, duplicate
charges, inaccurate coding. It is based on
government established billing practice
codes by the AMA (American Medical
Association) and CCI (Correct Coding
Initiative)
• Our ability to maximize the benefit of fully
validating a claim requires that we have a
complete set of claims related to an
episode of care. For example, multiple
charges for the same service could be
submitted on separate claims and we may
only receive one of them.
CLAIMS MANAGEMENT
16. Fraud Detection
Fraud
Detection
Criteria
• Excessive billing amounts
• Higher Costs per patient
• Excessive number of patients per doctor
• Increased number of tests per patient
• Abnormal distance between treatment location
and patient home.
• Higher rates of prescriptions for certain drugs
1. Billing for services not provided or needed
2. Multiple billing for services
A. Administering tests not medically necessary
B. Administering more expensive tests
Examples of Fraud:
Examples of Abuse:
CLAIMS MANAGEMENT
2 1
A
B
17. OUR REIMBURSEMENT METHODOLOGY
Our unique approach to claims management enables our clients to reduce the cost
per claim. It is supported by national data reported by US federal agencies.
Our methodology allows providers
reimbursement, which affords them a fair profit
to maintain quality and a competitive standard of
care.
18. • Our clients obtain the best pricing available because we have all key financial
elements needed to develop a reimbursement model for our direct contracts: the
retail price, the actual cost, and an understanding of how each provider needs to
offset losses from its Medicare patients.
• Our expertise and experience on all sides of the healthcare business enable us to
understand the needs of each stakeholder in the healthcare equation. It is an
invaluable advantage in negotiating effectively and maintaining long-term
relationships.
• We speak the language of both the provider and the payer supported with
empirical data, which allows us to produce sustainable results built on effective
but fair negotiations with healthcare providers.
COSTPLUS REIMBURSEMENT ADVANTAGE
Detailed data
on 90% of all
hospitals
Public Data
HCRIS Files: Hospital Cost Reports
State All-Payer Files: Commercial Payers, Medicare, Medicaid
MedPar Files: All Medicare discharges
SAF Outpatient Files: Institutional Outpatient claims
OPPS Files: Outpatient claims
Millions of discharges
Approximately 75% of all discharges nationally
>140 million outpatient occurrence
Data refreshed monthly (most recently 12 months, inflation, Wage Index factors normalize
the data)
19. •Urban
•Rural
Hospital
Location
•Teaching
•Non-teaching
Facility
Type
• 1 – 150
• 151 – 300
• 300+
Bedsize
Category
National
Discharge Database
We use our proprietary
methodology to assess each claim
amount based on actual
benchmark information stratified
by the following categories:
• Each inpatient claim is
compared to a benchmark
group of similar clinical
cases, in “like” hospitals, over
the most recently available 12
months.
• Wage Index Adjusted as
assigned by CMS.
20. The percentage difference between the highest and the lowest cost for the same service is on the average only 18%, while the
measure of dispersion for the charges is much higher – on the average, 44%.
BENCHMARK ANALYSIS OF COSTS & CHARGES
21. Medical Services Cost Charges
Major joint replacement or reattachment of lower extremity 11% 88.35%
Other Infectious & Parasitic Diagnoses 49% 69.69%
Urinary Stones w/o ESW Lithotripsy w/o MCC 27% 43.56%
Intracranial hemorrhage or cerebral infarction w cc 19% 46.03%
Cardiac Valve & Oth maj cardiothoracic proc w card cath w cc 6% 9.01%
Nutritional & Misc metabolic disorders age >17 w CC 20% 62.07%
Simple pneumonia & pleurisy w cc 11% 19.33%
Lower Extreme & humer pro except hip, foot, femur 23% 51.75%
Heart Failure & Shock w cc 36% 66.40%
Permanent Cardiac pacemaker implant w/o cc/mcc 9% 30.06%
Appendectomy w/o complicated principal diag w/o cc/mcc 15% 28.23%
Major joint replacement or reattachment of lower extremity w/o mcc 10% 46.06%
Respiratory System diagnosis with venlator support < 96 hours 11% 45.94%
Septicemia w/o mv 96 + hours age >17 12% 40.61%
Appendectomy w/o complicated prinicipal diag w cc 3% 20.55%
Perc cardiovasc proc w/o coronary artery stent w/o mcc 19% 43.26%
Peripheral vascular disorders w cc 11% 23.57%
Coagulation disorders 25% 57.52%
Percutaneous cardiovascular proc w drug-eluting stent w/o maj cv 6% 9.45%
Dysequilibrium 20% 98.27%
Major small & large bowel procedures w cc 20% 86.66%
Cellulitis w mcc 8% 31.67%
Other musculoskelet sys & conn tss o.r. proc w/o 27% 69.24%
Appendectomy w/o complicated principal diag w/o cc/mcc 18% 45.51%
Periph/cranial nerve & other nerv syst proc w mcc 35% 57.01%
Respiratory system diagnosis with ventilator support < 96 hours 11% 15.25%
Urinary stones w/o esw lithotripsy w/o mcc 12% 20.01%
Perc cardiovasc proc w drug-eluting stent 7% 8.37%
Otitis media & URI age 0-17 23% 22.30%
Extraocular procedures except orbit 29% 56.12%
Hip & femur procedures except major joint w/o 26% 19.89%
Rehabilitation w/o cc/mcc 34% 45.40%
Intracranial Hemorrage or Cerebral Infarction W CC 17% 73.21%
18% 44%
BENCHMARK ANALYSIS OF COSTS & CHARGES
% difference between the highest and lowest costs & retail charges
22. Model Components Facility A Facility B
Owner Private, Not
for Profit
Private, Not for
Profit
Teaching Status Teaching Non-Teaching
Bed Size Large Small
Region Northeast Midwest
Location Metropolitan Non-
Metropolitan
Actual Charges $9,202 $27,006
Actual LOS 1 day 1 day
Benchmark Average Charges $21,313 $19,420
Benchmark Average Cost $6,643 $7,212
Benchmark Average LOS 1.52 1.54
Facility Charge v. Benchmark -34% 118%
Benchmark % Mark Up from
Cost
221% 170%
Facility estimated % Mark Up 111% 478%
Baseline Reduction at
Benchmark
-52.64 53.23%
Actual Reimbursement $6,000.00 $14,000
% Mark Up from Cost 37% 199%
% Reduction 35% 48%
• Facility A: Mark-up from cost at 111%, which is below the
benchmark average of 221%.
• Facility B: Mark-up from cost for the same service is 478%,
significantly higher than its peers benchmarked at 170%.
• To maximize value to payer and achieve fair pricing for provider,
claims were repriced at a reduction of 35% and 48%, respectively,
from retail charges.
$0
$5,000
$10,000
$15,000
$20,000
$25,000
$30,000
Actual Charges Benchmark
Charges
Benchmark Cost
Appendectomy w/o complicated principal diag
w/o cc/mcc (DRG 343)
Facility A
Facility B
COMPARATIVE ANALYSIS
23. OUR REIMBURSEMENT METHODOLOGY
DRG: 149 - Disequilibrium
729%
201%
0%
200%
400%
600%
800%
Facility Mark up from Cost Benchmark Mark up from Cost
Cost of Care Analysis
Measures Actual Results
Actual Charges $15,834
Cost of Care $1,910
% Mark-up from Cost 729%
Payment to Provider $6,500
% Mark-up from Cost 240%
Gross Reduction $9,334
% Gross Reduction 59%
PF Access Fee $1,680
Net Cost of Claim $8,180
Net Reduction $7,654
Net % Reduction of Charges 48%
Cost-Plus Results – Example 1
24. OUR REIMBURSEMENT METHODOLOGY
Cost-Plus Results – Example 2
DRG: 343 - Appendectomy w/o complications
218%
196%
185%
190%
195%
200%
205%
210%
215%
220%
Facility Mark up from Cost Benchmark Mark up from
Cost
Cost of Care Analysis
Measures Actual Results
Actual Charges $27,006
Cost of Care $4,688
% Mark-up from Cost 476%
Payment to Provider $14,000
% Mark-up from Cost 199%
Gross Reduction $13,006
% Gross Reduction 48%
PF Access Fee $2,081
Net Cost of Claim $16,081
Net Reduction $10,925
Net % Reduction of Charges 40%
25. OUR REIMBURSEMENT METHODOLOGY
Cost-Plus Results – Example 3
DRG: 330 – Major sm & lrg bowel procedures w/ cc
218%
196%
185%
190%
195%
200%
205%
210%
215%
220%
Facility Mark up
from Cost
Benchmark Mark up
from Cost
Cost of Care Analysis
31%
21%9%
39%
Cost Plus Results
Cost of Care
Plus Mark-up
PayerFusion Fees
Net Reduction
Measures Actual Results
Actual Charges $76,618
Cost of Care $24,130
% Mark-up from Cost 218%
Payment to Provider $40,000
% Mark-up from Cost 66%
Gross Reduction $36,618
% Gross Reduction 48%
PF Access Fee $6,591
Net Cost of Claim $46,591
Net Reduction $30,027
Net % Reduction of Charges 39%
26. OUR REIMBURSEMENT METHODOLOGY
Cost-Plus Results – Example 4
DRG: 599 – Malignant breast disorders w/o cc/mcc
476%
170%
0%
100%
200%
300%
400%
500%
Facility Mark up from Cost Benchmark Mark up from Cost
Cost of Care Analysis
21%
45%
5%
29%
Cost Plus Results
Cost of Care
Plus Mark-up
PayerFusion Fees
Net Reduction
Measures Actual Results
Actual Charges $7,656
Cost of Care $1,582
% Mark-up from Cost 384%
Payment to Provider $5,000
% Mark-up from Cost 216%
Gross Reduction $2,656
% Gross Reduction 35%
PF Access Fee $425
Net Cost of Claim $5,425
Net Reduction $2,231
Net % Reduction of Charges 29%
27. Key Metrics July, 2012 YTD
Total Gross Charges Closed $20,200,478
Total Actual Reimbursement $11,110,262
Gross Reduction Amount $9,090,216
Gross Reduction % 45%
% Reduction Due to Claim Review 3.4%
% Reduction Due to Provider Contract 41.6%
PayerFusion Fees at 20%* $1,818,043
Net Reduction after PayerFusion Fees $7,272,173
Net Reduction % after PayerFusion Fees 36%
Claims Cost
Number of Claims Priced 8,782
Average Gross Cost per Claim $2,300
Average Cost after reduction $1,265
Average Net Cost after PayerFusion Fees $1,472
Other Statistics:
Total Number of Claims Closed 8,782
Average Claim Age (DOS) upon receipt 56
Average Turnaround days 18
Claim Status Gross Charges % of Total Total Count % of Total
Closed $20,200,478 80% 8,782 76%
In Process $3,282,578 13% 2,196 19%
Returned $505,012 2% 116 1%
Pending Authorization $757,518 3% 231 2%
Duplicate $505,012 2% 231 2%
Total $25,250,598 100% 11,555 100%
80%
13%
2%
3% 2%
% of Total Gross Charges by Status
As of July, 2012 YTD
Closed In Process Returned Pending Authorization Duplicate
SAMPLE CLAIMS SCORECARD
28. • Daily Ppay Batch report
• Case Update and Reserve Information
• Monthly invoice
• Zero Balance Report
• Monthly Dashboard
• Quarterly Performance Dashboard
• Productivity reports by Agent
• Claims Analyses
• Comparative Analyses
• Benchmark Cost Analyses
• Claims Status Reports
• Inventory Claims Management Reporting
• Data Analysis and modeling
Customized Client Reporting
Internal Reporting & Controls
REPORTING & PROCESS OUTPUTS
30. No Process Outcomes Measure Metric Target
1 Acknowledged receipt of new
case
Responsiveness Turnaround time 24 hours from
receipt of case
2 Delivery of estimated reserves
for each episode of care
Timeliness Turnaround time 48 hours from
receipt of case
3 Maintaining accurate reserves
for episode of care
Accuracy % of Actual Cost 95%
4 Follow-up on each case Effectiveness % of time cases are
followed up every 48
hours
99%
5 Reduction of claims Financial Efficiency Average % Gross
Reduction
43%
6 Claim processing and release
of Ppay
Process Efficiency Average turnaround
(from receipt of claim
to release of Ppay)
20 business days
7 Confirmed zero balance on
each patient account
Effectiveness % of closed accounts at
zero balance
100%
KEY QUALITY METRICS
31. PayerFusion is a technology driven company providing clients with
online access for monitoring the entire claims cycle, an online
provider search, advanced call-center technology and a user-friendly
mobile app.
• Claims Portal to review all claims statuses and claims results and ageing.
• On line provider search branded with your company name and logo featuring
interactive driving directions and Google maps integration in multiple languages.
• Dedicated phone numbers and toll free numbers when applicable answered in
the Client’s brand if required.
• Mobile application for the provider search with geo location feature to locate
closest providers.
PAYERFUSION TECHNOLOGY
32. PayerFusion Services - Specialty ServicesOUR PROVIDER NETWORK
• Avoids the use of multiple networks which are non-compliant and cause balance billing issues.
• Also includes pharmacy network, transplant services, dental, vision and second opinion services.
• Provider search available in 3 languages: English, Spanish & German
• Network design that defines the best place of service based on cost
and quality
• Patient pointed to the most cost effective facility, without
compromising freedom of choice
• Compliant with US regulations such as “Patient Balance Billing Act”
• Compliant with the “Network Leasing Act”
34. Web Portal - Fast Data Transfer
• Allows for the monitoring of claim
status changes
• Facilitates the real-time transmission of claim
information and associated documents
(EOB, invoices, etc.) to client claim system
• Supports the tracking of claim activity and changes
from the moment the claim is entered to final
pricing
PAYERFUSION TECHNOLOGY
35. • Accessible via the Internet
• Remotely hosted at a hardened data center
• 99.9% guaranteed up-time
• Utilizes 128-bit encryption (SSL-enabled)
• Open interfaces to integrate with legacy systems
• Multi-language support/multi time zone
• Electronic Claims – 837 Format
• Multi-currency real time conversion
Web Portal
• Electronic Payments
• Handles sophisticated client business
configurations
• Role-based security
• Developed using open-source technologies
• Friendly user interface
• Leverages strong workflow components and
transaction processing engine
PAYERFUSION TECHNOLOGY
36. • Automatic Call Distribution (ACD)
• Real-time management through web
interface
• 360 degree view of call activity with user
managed status
• Up-to-the-minute insight into call center
metrics to manage call center activity
• Account level control on routing calls and
running reports
Call Center Technology
PAYERFUSION TECHNOLOGY
37. • Phone calls are answered by live operator as per
SLA.
• Dedicated phone line to patients
• Toll free number available within the USA (1-800-
XXX-XXXX)
• Auto-attendant available as back-up to human
response failure.
CALL CENTER PROTOCOL
38. Home screen with one-touch access
to emergency contacts and closest
urgent care clinic.
Our Mobile Solution
Provider search enabling global
geo-targeted access to quality
providers
Patient health records including coverage
information, existing conditions,
medications and allergies.
Easily contact insurance carrier, user
designated providers and emergency
contacts.
PAYERFUSION TECHNOLOGY
39. • Financial - Superior cost containment results both in the
short and long-term savings by controlling growth year over
year in the average cost per claim.
• Service – Our expertise and experience in healthcare
reduces hassles and administrative burden both for our
clients and their insured’s.
• Compliance – We vigilantly monitor and adhere to
continuously changing state and Federal regulations so you
don't have to; that's how we are able to provide our clients
with a zero balance billing guarantee.
COMPETITIVE ADVANTAGES