1. Aarhus University | Room and Building Acoustic | Q4 | 2015
Page 1 of 14
Investigation of auditorium acoustics in Navitas
E.L. Nielsen, 11630
Department of Engineering, Aarhus University, Aarhus, Denmark
T.L. Basse, 11475
Department of Engineering, Aarhus University, Aarhus, Denmark
P. Burda, 201401791
Department of Engineering, Aarhus University, Aarhus, Denmark
ABSTRACT:
When designing the room acoustics of an auditorium it is vital that this type of room emphasizes
speech intelligibility. It is necessary to understand the auditory environment and be aware what
parameters are important for the function of this specific type of room. The paper explores the
acoustic quality of auditoriums through an investigation of the new auditorium in Navitas. It is
investigated what kind of measures should be used for the acoustic design. This is followed by
field measurements to map the actual performance of the space. To further investigate the vari-
ous parameter the space was analyzed using a computer-simulated model made in CATT acous-
tics. The investigation was decided to include the objective parameters C50, T60 (T30), EDT,
D50, SPL, STI and %Alcons, but the measurements was limited to T30, EDT and frequency re-
sponse. The results show a little too low reverberation time except for the measured values of
the low frequency bands. The Deutlichkeit, D50, and Clarity, C50, is good. There is a huge var-
iation in articulated percentage loss of consonants, depending on position. The frequency re-
sponds of the lower frequency bands are more damped than for the higher frequency bands. This
confirms that it is necessary to investigate the different measures, to ensure that the acoustic
quality satisfies all parameters.
2. Aarhus University | Room and Building Acoustic | Q4 | 2015
Page 2 of 14
1 INTRODUCTION
An auditorium is a large space intended for, as the name suggests, auditory dissemination. Lec-
ture auditoriums are speech rooms where a speaker can address a large audience while promot-
ing learning and understanding of the spoken word. Therefor it is a vital factor that this type of
room, from an acoustical point of view, emphasizes speech intelligibility. Auditoriums are
widely used, and its precise purpose clearly need a good acoustics design. However, it is also a
room where many users passes through and were the university (owner) invite guest to show off
its qualities. Whether it be auditorium for speech and lectures or music and entertainment, it is a
space that have tradition for high architectural enrichment. Therefore, the high requirements for
the function have to respect the architectural design to create a tectonic solution.
Literature describe how different acoustics environments can be designed. Much research is
made in this field, and give an indication of the necessary parameter for solving the highly com-
plex task of creating good acoustics in an auditorium.
2 PURPOSE AND RESEARCH METHODOLOGY
The room in which we listen to sounds has an important influence on what we hear. The pur-
pose of this paper is to identify some of the principal means currently available for judging the
acoustic quality of an auditorium. However, the design of such spaces is still considered an in-
exact science. The paper explores the acoustic quality of auditoriums through an investigation of
the new auditorium in Navitas. This is done in an explorative study by simple measurements of
actual present conditions in the auditorium and by detecting the means used to create its acous-
tical environment. This is further investigated through a computer-simulated model made in
CATT acoustics. The “real values” of chosen measures are compared with values from simula-
tion. The goal is to find out if Navitas auditorium fulfils the criteria for a good acoustic envi-
ronment based on literature and regulations.
3 MEASURES FOR A GOOD AUDITORIUM
3.1 Sound Propagation in an Auditorium
Sound waves travel about 345 meters/second. It means the sound coming directly from a source
within an auditorium will generally reach a listener after a time of anywhere from 0.01 to 0.2
seconds. Shortly after the arrival of the direct sound, a series of semi-distinct reflections from
various reflecting surfaces (walls and ceiling) will reach the listener. These early reflec-
tions typically will occur within about 50 milliseconds.
Much of the sound we hear in an auditorium is reflected sound. The reflections, which reach the
listener after the early reflections, are typically of lower amplitude and very closely spaced in
time. These reflections merge into what is called the reverberant sound or late reflections. For
impulsive sounds, the reverberant sound begins to decay immediately. (Scavone, 1999). A re-
flective stage area can provide the beneficial strong early reflections that are integrated with the
direct sound and enhance it. The audience creates much of the absorption, especially of the
higher frequencies. The frequencies above 1 kHz, specifically in the 2- to 4 kHz range, are pri-
marily responsible for speech intelligibility. The three bands at 1, 2, and 4 kHz provide 75% of
speech intelligibility content. This is because consonants, that occupy higher frequencies, are
more important for intelligibility than the vowels that occupy low frequencies. The majority of
speech power is in frequencies below 1000 Hz, and the maximum speech energy range is 200 to
3. Aarhus University | Room and Building Acoustic | Q4 | 2015
Page 3 of 14
600 Hz. Hench it is important to enhance 1, 2 and 4 kHz band, while having absorption of lower
frequencies to avoid late powerful reflections and echoes (Everest & Pohlmann, 2001).
Simple means for improving intelligibility can simply be to the speech delivery rate, decrease
from five syllables per second to three per second can significantly improve intelligibility
(Everest & Pohlmann, 2001).
3.2 Investigated measures
3.2.1 Speech clarity, C50 [dB]
“The measurement of Clarity is the ratio of the energy in the early sound compared to that in
the reverberant sound, expressed in dB. Early sound is what is heard in the first 50 msec after
the arrival of the direct sound. It is a measure of the degree to which the individual sounds
stand apart from one another.
If there is no reverberation in a dead room the sound will be very clear and C50 will have a
large positive value. If the reverberation time is large, the sound will be unclear and C50 will
have relatively high negative value. C50 becomes 0 dB, if the early and the reverberant sound is
equal.” (Kirkegaard, 2015)
(ISO 3382-1, 2009)
3.2.2 Deutlichkeit, D50[-]
Deutlichkeit is the ratio of early sound energy to the total sound energy. It is the percentage of
total sound reaching the listener within 50 ms after the initial pulse of sound.
“A “good” listening room from a speech-intelligibility perspective has D50 > 50%.” (Errede,
u.d.)
(Errede, u.d.)
3.2.3 Reverberation time RT, T60, T30, T20 [s]
Reverberation time, RT, is the time for the sound to decay to 10-6
of the original intensity.
(Will Steinhauser, Yuta Nakamura). Optimum reverberation time is a compromise between clar-
ity (requiring short reverberation time), sound intensity (requiring a high reverberant level), and
liveness (requiring a long reverberation time). The optimum reverberation time of an auditorium
is dependent on the use for which it is designed and the size of it (F. Alton Everest, Ken
Pohlmann, 2009). For the Navitas auditorium, the recommended mean reverberation time would
be 1.0 second with a tolerance range of (0.5/0.8)s – 1.2s depending on the frequency.
The lower recommendation is there because of the risk of disturbing echoes. An echo with a
higher level than the reverberation of the direct sound will be disturbing to listeners (F. Alton
Everest, Ken Pohlmann, 2009).
Measuring RT directly as a 60dB drop in sound level is difficult to do because of the ever occur-
ring background noise. A 60dB higher noise than the common background noise is simply hard
to make. Therefore the time of a 20dB or 30dB drop in sound level is made and then multiplied
by 3 or 2 respectively to make it comparable to a 60 dB drop. Depending on the room the decay
of the sound level can have slightly different slopes in the early and late decay. Especially in
room for music this can be important, and the measure early decay time, EDT, is used.
4. Aarhus University | Room and Building Acoustic | Q4 | 2015
Page 4 of 14
3.2.4 Early Decay time EDT [s]
EDT is the time for the first 10dB drop in sound level multiplied by 6 to make it comparable to
other measures of RT. This gives a more diverse evaluation of the reverberation time.
In highly diffuse space where the decay is completely linear, the two quantities, RT and EDT,
would be identical. (Barron, 2010)
3.2.5 Sound Pressure Level, SLP [dB]
A common measure of sound pressure in dB. It is defined as a logarithmic function of the abso-
lute sound pressure in [Pa] and a reference level of 20μPa.
(Everest & Pohlmann, 2001)
SPL is measured in decibels (dB), because of the incredibly broad range of intensities we can
hear. To fulfil good hearing conditions in addition to the classical objectives of room acoustic
optimum SPL value in auditorium is 65 – 70 dB(A). (Elkhateeb, 2012)
3.2.6 Speech Transmission Index, STI [-]
Objective descriptor of the speech intelligibility in a listener position taking the reverberation
and background noise into account. The STI is a 0 to 1 index, indicating the degree to which a
transmission channel degrades speech intelligibility. This means that perfectly intelligible
speech, when transferred through a channel with an associated STI of 1, will remain perfectly
intelligible. The closer the STI value approaches zero, the more information is lost. There are
standardized ratings linking certain ranges of the STI to subjectively experienced intelligibility.
To fulfil good hearing conditions in addition to the classical objectives of room acoustic opti-
mum STI value in auditorium is 0.6 – 0.75 (good speech intelligibility). (Elkhateeb, 2012)
3.2.7 Subjective Intelligibility
The articulation index (AI) uses acoustic measurements to estimate speech intelligibility. %Al-
cons stands for percentage articulation loss of consonants. (Everest & Pohlmann, 2001)
Table 3.2-1 Show subjective intelligibility base on the measure %Alcons (Everest & Pohlmann, 2001)
60
2
652,0% RT
h
r
lk
r
Alcons
rlh = distance from sound source to listener
rh = reverberation radius, or critical distance for directional sound sources
(Everest & Pohlmann, 2001)
According to one criterion, satisfactory speech intelligibility can be achieved by designing for
an appropriate reverberation time. In particular, reverberation time at 500 Hz, with the room
(1)
5. Aarhus University | Room and Building Acoustic | Q4 | 2015
Page 5 of 14
two-thirds occupied, should be selected so that at the most distant listening position, the ratio of
the reflected sound energy to the direct sound energy is no greater than 4. This corresponds to a
6-dB difference between the energy densities, and should provide a low (5%) consonant articu-
lation loss. (Everest & Pohlmann, 2001)
3.3 Investigated measures and their criteria for good acoustics
Table 3.3-1. Measures to have a good auditorium acoustic
Measure Type Goal Measured Simulated
Speech Clarity C50 > -2 dB 7.185 dB
Reverberation time T30 0.8 – 1.2 s 0.82 s 0.59 s
Early Decay time EDT10 0.8 - 1.2 s 0.64 s 0.45 s
Deutlichkeit D50 > 50 % 83.02 %
Sound Pressure Level SPL 70 dB(A) 69.62 dB
Speech Transmission Index STI 0.6-0.75
Speech Intelligibility %Alcons < 11% 9.065 %
4 DESCRIPTION OF INVESTIGATION
The acoustic is one of the main issue, which needs to be solved in this kind of spaces. The goal
of investigation was to evaluate acoustic quality of the new auditorium in Navitas. We chose
auditorium at our school because it was the best chance to gain practical experience by doing
measurements of acoustic characteristics in auditorium. This was then compared with results
from computer-simulated model made in CATT. It is also very new auditorium, hence we ex-
pected high quality results. Even though limited measuring possibilities we measured impact
noise (clapping by two wooden boards) and noise from loud speaker by Hand-held Sound Level
Analyzer on 4 different positions. The investigation was decided to include objective parameters
(C50, T60 (T30), EDT, D50, SPL, STI and %Alcons) to indicate acoustic quality of the audito-
rium.
Investigated
measures
Ideal
Auditorium
Goal according to
literature/regulations
Measured values Simulated values
Navitas
Auditorium
Conclusion
6. Aarhus University | Room and Building Acoustic | Q4 | 2015
Page 6 of 14
5 INVESTIGATION
5.1 Measurement
To measure a room’s acoustic performance can be many different things. The measurements
should be exercised based on both what acoustical measures wanted to be found and according
to how the room is used. Another defining parameter of measuring acoustics is the equipment.
The equipment and software needed to measure most acoustic measures is very expensive and
therefore not accessible to most people. For this investigation it was possible to measure:
- Sound pressure level
Total or for octaves or 1/3 octave bands
maximum, minimum or equivalent (“average”), for a measuring period.
- Reverberation time
T20, T30 and EDT
5.1.1 Measuring setup
The measurements were setup to imitate the normal usage of the auditorium with a sound source
(lecturer) in front of the white boards, and receivers (audience) seated in different positions as
illustrated in (Figure 5.1-1). This setup was used for all measurements.
3
2
1
4
Source
Measuring point
Figure 5.1-1 Measurement setup
All measurements were recorded in 1/3-octaves with Brüel & Kjær Hand-held Analyzer Types
2250 with Microphone Type 4189.
5.1.2 Reverberation time measurement
The measuring of reverberation time was done by the Impulsive Excitation Method, with a clap
using clapperboards as the impulse. To achieve a better precision and to make sure false meas-
urements could be identified and ignored, seven measurements was conducted at every measur-
ing point.
5.1.3 Frequency response measurement
The frequency response of a room is an indicator for how the room react to different frequen-
cies.
7. Aarhus University | Room and Building Acoustic | Q4 | 2015
Page 7 of 14
For this measurement pink noise was played at the source position and the equivalent sound
pressure level, Leq, was measured over 30 seconds in the four measuring points and right in front
of the source.
The measurement in front of the speaker emitting the pink noise is used as a baseline. The
measurements in the different positions are then normalized by the difference between sound
pressure level of frequency band of the 1000Hz baseline and that of the 1000Hz measured
value. This normalization factor is added to all measured equivalent sound pressure levels on all
frequency bands.
The procedure used is based on that found in (Moulton, 2001)
5.1.4 Results from measurements
The results of the measurements consist of the measured T30 reverberation time, the early decay
time and the frequency response.
5.1-2 T30, the mean of measurement in each position. Measurements with huge deviation from the rest
were left out.
There was a high reverberation time in the low frequencies, and only 125Hz was above the up-
per limit in the position for receiver P1 and P2. In general the reverberation time measured is
low and even slightly below the recommended minimum.
0
0.2
0.4
0.6
0.8
1
1.2
1.4
Time[s]
T30 P1 T30 P2 T30 P3
T30 P4 RT min. RT max.
8. Aarhus University | Room and Building Acoustic | Q4 | 2015
Page 8 of 14
5.1-3 Early decay time, the mean of measurements in each position. Measurements with huge diviation
from the rest were left out.
If the early decay time is compared to the recommended RT-values, it is too low in most fre-
quency bands. From around the 250Hz band and below the EDT is within the boundaries in P1
and P2. In the 125Hz and 160Hz band the EDT in P2 and P3 is also within the boundaries.
5.1-4 The analyzed frequency response of the auditorium (stuff for discussion?)
From the frequency response it is seen how the different frequency bands are reacting in the
room. Generally in this case, we see that the frequency bands lower than 1kHz are comparably
more damped than the higher frequency, except 6.3kHz and 8kHz and few other exceptions.
0
0.2
0.4
0.6
0.8
1
1.2
1.4
Time[s]
EDT P1 EDT P2 EDT P3
EDT P4 RT min. RT max.
-8
-6
-4
-2
0
2
4
6
Netroomfrequencyresponce[dB]
P1
P2
P3
P4
9. Aarhus University | Room and Building Acoustic | Q4 | 2015
Page 9 of 14
5.2 Simulation
5.2.1 Model build in CATT-acoustics.
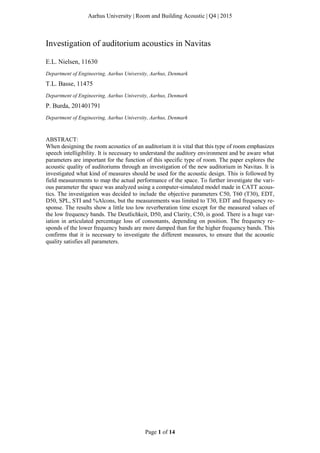
Figure 5.2-1 Perspective of auditorium. [1] Painted plaster wall, [2] White board, [3] Parquet floor, [4]
door, [5] Glass pane, [6] Concrete, bare wall [7] Acoustic wood panel with underlying felt, [8] Perforated
metal panels, [9] Seats, unoccupied, [10] Seats, occupied.
Figure 5.2-2 Pictures of the auditorium
5.2.2 Model and simulation assumptions
The surfaces in the simulation have been modelled to represent the different surfaces and their
properties, with respect to geometry, absorption and scatter and are listed in appendix 1. Seats
consists of long steps or platforms with slender chairs tucked closely together. Each row has
been modelled as a single unity consisting of a seat and a backrest with variable occupancy.
Occupation is modelled in four steps.
1. Empty: as a baseline to compare with measurement survey.
2. One third full: Low occupancy may occur.
3. Half full: Is the expected occupancy, based on experience. When half full majority of
audience is expected to be place on the bottom half of the auditorium
4. Full: In case of a full auditorium where the design max occupant number is reached.
Sources: One source representing the speaker or lecturer. The sound source is positioned in the
middle of the stage, 1.5m in front of the whiteboards.
The receivers are representing audience in the hall. Three receivers are positioned in the centre
of row no. 1, 8 and 15. One receiver is positioned at the outer seat in row 8.
5.2.3 Simulation results
With the CATT calculations of the parameters T30, SPL, C50 & D50 and from reverberation
sound the %Alcons are calculated. The considered acoustic indicators related to speech intelli-
gibility are then checked for their compatibility with their optimum criteria values mentioned
previously in (Table 3.1-1). Results from half occupancy and full occupancy can be found in
appendix 1.
[1] [2]
[3]
[9][8][5] [6] [7]
[4]
[10]
]
10. Aarhus University | Room and Building Acoustic | Q4 | 2015
Page 10 of 14
5.2.3.1 Results with no occupancy
Figure 5.2-3 T30, Reverberation time. Figure 5.2-4 EDT, Early decay time.
Figure 5.2-5 D50, Deutlichkeit Figure 5.2-6 C50, Clarity
Figure 5.2-7 Articulated loss of consonants Figure 5.2-8 SPL sound pressure level
5.2.4 Analysis of simulation results
The reverberation time in the different positions is lower than the set goal for all cases. This
means that for all cases the reverberant sound should be slightly increased to avoid disturbing
early echoes. In the case where the auditorium is full, there are T30 in 250Hz, 500Hz and 8 kHz
within the threshold time criteria for position 2.
0
0.2
0.4
0.6
0.8
1
1.2
1.4
125 250 500 1k 2k 4k 8k
Time[s]
T30 R01 (h) T30 R02 (h)
T30 R03 (h) T30 R04 (h)
RT goal min RT goal max
0
0.2
0.4
0.6
0.8
1
1.2
1.4
125 250 500 1k 2k 4k 8k
Time[s]
EDT R01 (h) EDT R02 (h)
EDT R03 (h) EDT R04 (h)
RT goal min RT goal max
30
40
50
60
70
80
90
100
125 250 500 1k 2k 4k 8k
%
D50 (h) R01 D50 (h) R02
D50 (h) R03 D50 (h) R04
D50 min criteria
-4
-2
0
2
4
6
8
10
12
14
125 250 500 1k 2k 4k 8k
dB
C50 (h) R01 C50 (h) R02
C50 (h) R03 C50 (h) R04
C50 criteria > -2dB
0
5
10
15
20
25
30
125 250 500 1k 2k 4k 8k
Articulationlossofconsonats
[%]
%Alcons R01 %Alcons R02
%Alcons R03 %Alcons R04
Poor
Satisfactory
Good
Ideal
0
10
20
30
40
50
60
70
80
90
100
125 250 500 1k 2k 4k 8k
dB
SPL (h) R01 SPL (h) R02
SPL goal max SPL (h) R03
SPL (h) R04 SPL goal min
11. Aarhus University | Room and Building Acoustic | Q4 | 2015
Page 11 of 14
Figure 5.2-9 Map of D50 dis-
tribution for 50% occupancy
show no areas are below the
50% criteria.
Figure 5.2-10 Map of T30
distribution for 50% occu-
pancy. Show an area in ap-
proximate in the middle of
the audience with a reasona-
ble reverberation time.
C50 and D50 are clearly suffi-
cient in all occupancy cases. In
all frequency bands but 500Hz at
least 80 % of total sound energy
reaches the listener within 50 ms.
500Hz is still well above the goal
of 60%.
Using the STI value it is also possible to describe the intelli-
gibility rating. The STI describes how much information is
lost from the subjective perceived sound phon. Here the rat-
ing is also good for the auditorium in all cases.
The percentage loss of consonants was calculated from the CATT calculated reverberation time
using formula (1). With this it is possible to rate the speech intelligibility from a different meas-
ure than the C50 and D50.
Table 5.2-1 Average %Alcons in the 4 positions and their respective subjective intelligibility rating from
table 3.2-1
Occupancy Position 1 Position 2 Position 3 Position 4
Empty 20.0 % (poor) 6.7 % (good) 1.9 % (ideal) 7.7 % (good)
Half full 16.8 % (poor) 9.6 % (satisfy) 1.7 % (ideal) 8.7 % (satisfy)
Full 12.9 % (poor) 7.7 % ( good) 1.8 % (ideal) 6.8 % (good)
When in the middle of the hall, position 2, there is a higher acoustical loss of consonants when it
is half-full, than when it is full or empty. For position 3 (front row) it does not make much dif-
ference if hall is empty, half full or full. When positioned in the back, there is a much lower loss
of consonants when hall is full and a lower loss when half full, than when it is empty, but the
quality of % Alcons are still considered to poor.
12. Aarhus University | Room and Building Acoustic | Q4 | 2015
Page 12 of 14
Figure 5.2-11 Example of echogram, show the sequence of reflections, #29 travel path is show on figure
to the right.
Many reflections are seen just after 20 ms and some more spread reflections from 45 ms to 85
ms. There are issues as the difference of direct and reflected path should not be more than 20ms
(Everest & Pohlmann, 2001). For example, there is the high ceiling, at the stage, here even 1.
order reflections can have a long travel path. There could be worked with eliminating more of
the later reflections and dense the early reflections.
Figure 5.2-12 Travel path for direct- and reflected- sound on the ceiling.
5.3 Comparison of measurement and model
For the value from 250Hz band and above the reverberation time is fairly stable for both meas-
urement and simulation. The values of the simulation are slightly lower than the measured.
When lower than 250 Hz band there is a large deviation between the simulated and measured
values due increased measured reverberation time. The results of early decay time both show a
larger deviation between the different positions and are both generally lower the T30 results.
There are many uncertainties from both measurement and model inputs, the difference between
these results give indication of the correctness of the investigation.
6 DISCUSSION
When conducting the measurements for the frequency response of the room, the measured base-
line was not as straight as expected from a pink noise source. From 250Hz 6.3kHz the equiva-
lent sound pressure level is approximately the same, but the from 250Hz there is a slope down
to 13Hz where Leq is around the level from the background noise. This is probably due to the
quality of the speaker used. Because of this the frequency responses in the lower frequency
bands have a higher uncertainty.
The sound source in the CATT simulation is defined with the sound pressure level at 1m from
the source from 125Hz to 4 kHz. There is used a source similar to the source of from a CATT
tutorial that is define as an Omni directional source, which is used for natural sources. It can be
questioned how well it fits the sound pressure from an actual person. Some literature state that
human speech have most of it sound pressure in the low frequency bands, this does not comply
fully with the source files used for the simulation.
long reflected path +30ms
direct path
60ms
13. Aarhus University | Room and Building Acoustic | Q4 | 2015
Page 13 of 14
The acoustic walls have a primary function as absorber. A source error in
simulation could be probable from the diffuse reflection of the wall as the
sound may be scattered incorrectly for the surface from the scatter coeffi-
cient used in CATT. The scattering coefficient indicates how much of the
incident energy is scattered in non-specular directions. (Whereas the diffu-
sion coefficient indicates how uniformly the incident energy is scattered)
(Tech Topic, 2013)
6.1.1 Suggestions for solutions
The geometry may cause issues, as there is a great distance to much of the audience because of
the rectangular shape of the room. There could have been considered a solution with splayed
side walls to increase seating area close to the stage, this could also increase the seating capacity
of the space (Everest & Pohlmann, 2001). Splayed wall can also help to reflect more sound to
the back of the auditorium.
There seemed to be issue with the flat ceiling with no ceiling reflectors. By using several small-
er, hard and stiff reflectors to send more of the high frequency reflected sound to the back of the
audience. Consider a graduation in ceiling, for example by using clouds above the stage to
shorten the travel time of reflections on the ceiling.
There have been made no consideration of loudspeakers. There are installed loudspeakers in the
auditorium, so some of the issues could have been solved by making up for missing sound by
the use of loudspeakers. It can also be questioned if the loudspeaker are used by the speaker.
7 CONCLUSION
The results for the calculated %Alcons differ compared to Deutlichkeit, clarity and STI. Where
the latter measures show no problem with speech intelligibility, %Alcons did show position 3
rated poor. This loss of sentence understanding should not be accepted in auditorium design.
This investigation have not taken into account the need for loudspeakers. Therefor solutions
could be made to improve the overall acoustic performance of the space. Of course the auditori-
um is never expected to be empty and in use where good acoustics are required, but much of the
absorption come from the audience.
The comparison of reverberation time results from experimental investigation and computer
simulation for empty auditorium shows that values hardly fulfil requirements. Whereas rever-
beration time T30 and early decay time ETD results from experimental investigation are slightly
below recommended minimum with considerable deviations through frequencies below 250Hz.
The reverberation time in position P1 and P2 was above upper limit for the 125Hz band. The
T30 and EDT results from computer simulation give smoother output but it is also below rec-
ommended minimum almost in all frequency spectrum. These differences could be created due
to inaccurate inputs in computer model and also by disturbing sound during physical measure-
ment. This confirms that it is necessary to investigate the different measures, to ensure that the
acoustic quality satisfies all parameters.
14. Aarhus University | Room and Building Acoustic | Q4 | 2015
Page 14 of 14
8 REFERENCES
Barron, M., 2010. Auditorium Acoustic and Architectural Design. 2nd ed. Oxon: Spon Press.
C.C.J.M. Hak, R.H.C. Wenmaekers, J.P.M. Hak, L.C.J. van Luxemburg, A.C. Gade, 2010.
Sound Strength Calibration Methods. Sydney: s.n.
Elkhateeb, A. A., 2012. The acoustical design of the new lecture auditorium, Faculty of Law,
Ain Shams University. Ain Shams Engineering Journal, 3(3), pp. 219-235.
Errede, S., n.d. UIUC Physics 406, Acoustical Physics of Music. [Online]
Available at:
https://courses.physics.illinois.edu/phys406/Lecture_Notes/P406POM_Lecture_Notes/P406PO
M_Lect9.pdf
[Accessed 4 June 2015].
Everest, F. A. & Pohlmann, K. C., 2001. Master Handbook of Acoustics. 5th ed. s.l.:The
McGraw-Hill Companie.
F. Alton Everest, Ken Pohlmann, 2009. Master Handbook of Acoustic. s.l.:McGraw-Hill/TAB
Electronics; 5 edition.
ISO 3382-1, 2009. ISO 3382-1. Acoustics - Measurement of room acoustic parameters - Part 1:
Performance spaces. geneva: International Organization for Standardization.
Kirkegaard, P., 2004. Building and Room Acoustic. s.l.:s.n.
Kirkegaard, P., 2015. Building and room acoustic - notes from lecture 9. s.l.:s.n.
Moulton, D., 2001. Acoustical Measurements For The Rest of Us. [Online]
Available at:
http://www.moultonlabs.com/more/acoustical_measurements_for_the_rest_of_us/P0/
[Accessed 4 June 2015].
Odeon, 2014. Odeon Application Note - Calculation of Speech Transmission Index in rooms.
s.l.:s.n.
Purebits.com, 2004. Purebits.com. [Online]
Available at: http://www.purebits.com/appnote11.html
[Accessed 4 June 2015].
Scavone, G. P., 1999. Center for computer research in music and acoustic. [Online]
Available at:
https://ccrma.stanford.edu/CCRMA/Courses/152/auditorium_acoustics.html#SECTION000318
600000000000000
[Accessed 02 06 2015].
Tech Topic, 2013. Scattering versus Diffusion Coefficients. s.l.:Tech Topic.
Will Steinhauser, Yuta Nakamura, n.d. Lecture Hall or Music Hall: Acoustic Properties of
Foellinger Auditorium. PHYS 406 Project ed. s.l.:s.n.
15. Page i of v
1 Appendix - Material
Table 2.1-1 full absorption is 1 whilst full reflection is 0
Absorption coefficients of common building
materials and finishes
CATT
Color
Material 125 250 500 1000 2000 4000
Concrete
rough finish, unpainted
concrete
0.01 0.02 0.04 0.06 0.08 0.10
Glasspane 0.18 0.06 0.04 0.03 0.02 0.02
Wood parquet
parquet on concrete 0.04 0.04 0.07 0.06 0.06 0.07
Door 0.10 0.07 0.05 0.04 0.04 0.04
Plasterboard 0.29 0.10 0.06 0.05 0.04 0.04
Metal panel
Underlay in perforated
metal panels(25mm
batts)
0.51 0.78 0.57 0.77 0.90 0.79
Whiteboard 0.29 0.10 0.06 0.05 0.04 0.04
Acoustic panel
Open linear wood
panels with acoustical
felt covered.
0.57 0.83 0.76 0.65 0.47 0.33
Seat
Seat
Padded
0.49 0.66 0.80 0.88 0.82 0.70
Seat
occupied
0.60 0.74 0.88 0.96 0.93 0.85
Backrest
Bare
0.15 0.19 0.22 0.39 0.38 0.30
Backrest
occupied
0.57 0.61 0.75 0.86 0.91 0.86
16. Page ii of v
Scatter Frequencies (Hz)
125 250 500 1000 2000 4000
Chairs 0.19 0.2 0.22 0.38 0.5 0.41
Model build in CATT-acoustics.
Figure 2.1-1 Perspective of auditorium. [1] Painted plaster wall, [2] White board, [3] Parquet floor, [4] door, [5] Glass pane, [6]
Concrete, bare wall [7] Acoustic wood panel with underlying felt, [8] Perforated metal panels, [9] Seats, unoccupied,
[10] Seats, occupied,
Figure 2.1-2 Plan of auditorium. A0 is the sound source, points 01, 02, 03, 04 is the receivers.
Figure 2.1-3 Section of the side of the auditorium. In pictures, you can see the acoustic panel and windows.
[1]
[2]
[3]
[9][8][5] [6] [7]
[4]
[10]
]