SlideShare a Scribd company logo
-50
-40
-30
-20
-10
0
10
20
30
40
50
1873 1887 1897 1908 1918 1928 1938 1948 1958 1968 1978 1988 1998 2008
AxisTitle
Annual Temperatures Summary
Highest Recorded High Recorded High Recorded (Avg) All
High (Avg) High (Avg) All Median (Avg)
Median (Avg) All Low (Avg) Low (Avg) All
Low Recorded Low Recorded (Avg) All Lowest Recorded (Avg) All
Linear (High Recorded) Linear (High (Avg)) Linear (Median (Avg))
-40
-30
-20
-10
0
10
20
1873 1887 1897 1908 1918 1928 1938 1948 1958 1968 1978 1988 1998 2008
AxisTitle
Annual Temperatures January
Highest Recorded High Recorded High Recorded (Avg) All
High (Avg) High (Avg) All Median (Avg)
Median (Avg) All Low (Avg) Low (Avg) All
Low Recorded Low Recorded (Avg) All Lowest Recorded (Avg) All
Linear (High Recorded) Linear (High (Avg)) Linear (Median (Avg))
-50
-40
-30
-20
-10
0
10
20
1873 1887 1897 1908 1918 1928 1938 1948 1958 1968 1978 1988 1998 2008
AxisTitle
Annual Temperatures February
Highest Recorded High Recorded High Recorded (Avg) All
High (Avg) High (Avg) All Median (Avg)
Median (Avg) All Low (Avg) Low (Avg) All
Low Recorded Low Recorded (Avg) All Lowest Recorded (Avg) All
Linear (High Recorded) Linear (High (Avg)) Linear (Median (Avg))
-40
-30
-20
-10
0
10
20
30
1873 1887 1897 1908 1918 1928 1938 1948 1958 1968 1978 1988 1998 2008
AxisTitle
Annual Temperatures March
Highest Recorded High Recorded High Recorded (Avg) All
High (Avg) High (Avg) All Median (Avg)
Median (Avg) All Low (Avg) Low (Avg) All
Low Recorded Low Recorded (Avg) All Lowest Recorded (Avg) All
Linear (High Recorded) Linear (High (Avg)) Linear (Median (Avg))
-30
-20
-10
0
10
20
30
40
1873 1887 1897 1908 1918 1928 1938 1948 1958 1968 1978 1988 1998 2008
AxisTitle
Annual Temperatures April
Highest Recorded High Recorded High Recorded (Avg) All
High (Avg) High (Avg) All Median (Avg)
Median (Avg) All Low (Avg) Low (Avg) All
Low Recorded Low Recorded (Avg) All Lowest Recorded (Avg) All
Linear (High Recorded) Linear (High (Avg)) Linear (Median (Avg))
-10
-5
0
5
10
15
20
25
30
35
40
1873 1887 1897 1908 1918 1928 1938 1948 1958 1968 1978 1988 1998 2008
AxisTitle
Annual Temperatures May
Highest Recorded High Recorded High Recorded (Avg) All
High (Avg) High (Avg) All Median (Avg)
Median (Avg) All Low (Avg) Low (Avg) All
Low Recorded Low Recorded (Avg) All Lowest Recorded (Avg) All
Linear (High Recorded) Linear (High (Avg)) Linear (Median (Avg))
0
5
10
15
20
25
30
35
40
1873 1887 1897 1908 1918 1928 1938 1948 1958 1968 1978 1988 1998 2008
AxisTitle Annual Temperatures June
Highest Recorded High Recorded High Recorded (Avg) All
High (Avg) High (Avg) All Median (Avg)
Median (Avg) All Low (Avg) Low (Avg) All
Low Recorded Low Recorded (Avg) All Lowest Recorded (Avg) All
Linear (High Recorded) Linear (High (Avg)) Linear (Median (Avg))
0
5
10
15
20
25
30
35
40
45
1873 1887 1897 1908 1918 1928 1938 1948 1958 1968 1978 1988 1998 2008
AxisTitle Annual Temperatures July
Highest Recorded High Recorded High Recorded (Avg) All
High (Avg) High (Avg) All Median (Avg)
Median (Avg) All Low (Avg) Low (Avg) All
Low Recorded Low Recorded (Avg) All Lowest Recorded (Avg) All
Linear (High Recorded) Linear (High (Avg)) Linear (Median (Avg))
0
5
10
15
20
25
30
35
40
1873 1887 1897 1908 1918 1928 1938 1948 1958 1968 1978 1988 1998 2008
AxisTitle Annual Temperatures August
Highest Recorded High Recorded High Recorded (Avg) All
High (Avg) High (Avg) All Median (Avg)
Median (Avg) All Low (Avg) Low (Avg) All
Low Recorded Low Recorded (Avg) All Lowest Recorded (Avg) All
Linear (High Recorded) Linear (High (Avg)) Linear (Median (Avg))
-10
-5
0
5
10
15
20
25
30
35
40
45
1873 1887 1897 1908 1918 1928 1938 1948 1958 1968 1978 1988 1998 2008
AxisTitle
Annual Temperatures September
Highest Recorded High Recorded High Recorded (Avg) All
High (Avg) High (Avg) All Median (Avg)
Median (Avg) All Low (Avg) Low (Avg) All
Low Recorded Low Recorded (Avg) All Lowest Recorded (Avg) All
Linear (High Recorded) Linear (High (Avg)) Linear (Median (Avg))
-15
-10
-5
0
5
10
15
20
25
30
35
1873 1887 1897 1908 1918 1928 1938 1948 1958 1968 1978 1988 1998 2008
AxisTitle
Annual Temperatures October
Highest Recorded High Recorded High Recorded (Avg) All
High (Avg) High (Avg) All Median (Avg)
Median (Avg) All Low (Avg) Low (Avg) All
Low Recorded Low Recorded (Avg) All Lowest Recorded (Avg) All
Linear (High Recorded) Linear (High (Avg)) Linear (Median (Avg))
-40
-30
-20
-10
0
10
20
30
1873 1887 1897 1908 1918 1928 1938 1948 1958 1968 1978 1988 1998 2008
AxisTitle
Annual Temperatures November
Highest Recorded High Recorded High Recorded (Avg) All
High (Avg) High (Avg) All Median (Avg)
Median (Avg) All Low (Avg) Low (Avg) All
Low Recorded Low Recorded (Avg) All Lowest Recorded (Avg) All
Linear (High Recorded) Linear (High (Avg)) Linear (Median (Avg))
-40
-30
-20
-10
0
10
20
1873 1887 1897 1908 1918 1928 1938 1948 1958 1968 1978 1988 1998 2008
AxisTitle
Annual Temperatures December
Highest Recorded High Recorded High Recorded (Avg) All
High (Avg) High (Avg) All Median (Avg)
Median (Avg) All Low (Avg) Low (Avg) All
Low Recorded Low Recorded (Avg) All Lowest Recorded (Avg) All
Linear (High Recorded) Linear (High (Avg)) Linear (Median (Avg))
0
10
20
30
40
50
60
70
80
90
100
1873 1887 1897 1908 1918 1928 1938 1948 1958 1968 1978 1988 1998 2008
AxisTitle
Above Freezing Annual Percentile
Above Freezing % (High) Above Freezing % (High) All Avg Above Freezing % (Med)
Above Freezing % (Med) All Avg Above Freezing % (Low) Above Freezing % (Low) All Avg
Linear (Above Freezing % (High)) Poly. (Above Freezing % (High)) Linear (Above Freezing % (Med))
Poly. (Above Freezing % (Med)) Linear (Above Freezing % (Low)) Poly. (Above Freezing % (Low))
0
10
20
30
40
50
60
70
80
90
100
1873 1887 1897 1908 1918 1928 1938 1948 1958 1968 1978 1988 1998 2008
AxisTitle
Above Freezing January Percentile
Above Freezing % (High) Above Freezing % (High) All Avg Above Freezing % (Med)
Above Freezing % (Med) All Avg Above Freezing % (Low) Above Freezing % (Low) All Avg
Linear (Above Freezing % (High)) Poly. (Above Freezing % (High)) Linear (Above Freezing % (Med))
Poly. (Above Freezing % (Med)) Linear (Above Freezing % (Low)) Poly. (Above Freezing % (Low))
0
10
20
30
40
50
60
70
80
90
100
1873 1887 1897 1908 1918 1928 1938 1948 1958 1968 1978 1988 1998 2008
AxisTitle
Above Freezing February Percentile
Above Freezing % (High) Above Freezing % (High) All Avg Above Freezing % (Med)
Above Freezing % (Med) All Avg Above Freezing % (Low) Above Freezing % (Low) All Avg
Linear (Above Freezing % (High)) Poly. (Above Freezing % (High)) Linear (Above Freezing % (Med))
Poly. (Above Freezing % (Med)) Linear (Above Freezing % (Low)) Poly. (Above Freezing % (Low))
0
10
20
30
40
50
60
70
80
90
100
1873 1887 1897 1908 1918 1928 1938 1948 1958 1968 1978 1988 1998 2008
AxisTitle
Above Freezing March Percentile
Above Freezing % (High) Above Freezing % (High) All Avg Above Freezing % (Med)
Above Freezing % (Med) All Avg Above Freezing % (Low) Above Freezing % (Low) All Avg
Linear (Above Freezing % (High)) Poly. (Above Freezing % (High)) Linear (Above Freezing % (Med))
Poly. (Above Freezing % (Med)) Linear (Above Freezing % (Low)) Poly. (Above Freezing % (Low))
0
10
20
30
40
50
60
70
80
90
100
1873 1887 1897 1908 1918 1928 1938 1948 1958 1968 1978 1988 1998 2008
AxisTitle
Above Freezing April Percentile
Above Freezing % (High) Above Freezing % (High) All Avg Above Freezing % (Med)
Above Freezing % (Med) All Avg Above Freezing % (Low) Above Freezing % (Low) All Avg
Linear (Above Freezing % (High)) Poly. (Above Freezing % (High)) Linear (Above Freezing % (Med))
Poly. (Above Freezing % (Med)) Linear (Above Freezing % (Low)) Poly. (Above Freezing % (Low))
0
10
20
30
40
50
60
70
80
90
100
1873 1887 1897 1908 1918 1928 1938 1948 1958 1968 1978 1988 1998 2008
AxisTitle
Above Freezing May Percentile
Above Freezing % (High) Above Freezing % (High) All Avg Above Freezing % (Med)
Above Freezing % (Med) All Avg Above Freezing % (Low) Above Freezing % (Low) All Avg
Linear (Above Freezing % (High)) Poly. (Above Freezing % (High)) Linear (Above Freezing % (Med))
Poly. (Above Freezing % (Med)) Linear (Above Freezing % (Low)) Poly. (Above Freezing % (Low))
0
10
20
30
40
50
60
70
80
90
100
1873 1887 1897 1908 1918 1928 1938 1948 1958 1968 1978 1988 1998 2008
AxisTitle
Above Freezing June Percentile
Above Freezing % (High) Above Freezing % (High) All Avg Above Freezing % (Med)
Above Freezing % (Med) All Avg Above Freezing % (Low) Above Freezing % (Low) All Avg
Linear (Above Freezing % (High)) Poly. (Above Freezing % (High)) Linear (Above Freezing % (Med))
Poly. (Above Freezing % (Med)) Linear (Above Freezing % (Low)) Poly. (Above Freezing % (Low))
100% of all recorded temperatures for this month are above freezing.
0
10
20
30
40
50
60
70
80
90
100
1873 1887 1897 1908 1918 1928 1938 1948 1958 1968 1978 1988 1998 2008
AxisTitle
Above Freezing July Percentile
Above Freezing % (High) Above Freezing % (High) All Avg Above Freezing % (Med)
Above Freezing % (Med) All Avg Above Freezing % (Low) Above Freezing % (Low) All Avg
Linear (Above Freezing % (High)) Poly. (Above Freezing % (High)) Linear (Above Freezing % (Med))
Poly. (Above Freezing % (Med)) Linear (Above Freezing % (Low)) Poly. (Above Freezing % (Low))
100% of all recorded temperatures for this month are above freezing.
0
10
20
30
40
50
60
70
80
90
100
1873 1887 1897 1908 1918 1928 1938 1948 1958 1968 1978 1988 1998 2008
AxisTitle
Above Freezing August Percentile
Above Freezing % (High) Above Freezing % (High) All Avg Above Freezing % (Med)
Above Freezing % (Med) All Avg Above Freezing % (Low) Above Freezing % (Low) All Avg
Linear (Above Freezing % (High)) Poly. (Above Freezing % (High)) Linear (Above Freezing % (Med))
Poly. (Above Freezing % (Med)) Linear (Above Freezing % (Low)) Poly. (Above Freezing % (Low))
100% of all recorded temperatures for this month are above freezing.
0
10
20
30
40
50
60
70
80
90
100
1873 1887 1897 1908 1918 1928 1938 1948 1958 1968 1978 1988 1998 2008
AxisTitle
Above Freezing September Percentile
Above Freezing % (High) Above Freezing % (High) All Avg Above Freezing % (Med)
Above Freezing % (Med) All Avg Above Freezing % (Low) Above Freezing % (Low) All Avg
Linear (Above Freezing % (High)) Poly. (Above Freezing % (High)) Linear (Above Freezing % (Med))
Poly. (Above Freezing % (Med)) Linear (Above Freezing % (Low)) Poly. (Above Freezing % (Low))
0
10
20
30
40
50
60
70
80
90
100
1873 1887 1897 1908 1918 1928 1938 1948 1958 1968 1978 1988 1998 2008
AxisTitle
Above Freezing October Percentile
Above Freezing % (High) Above Freezing % (High) All Avg Above Freezing % (Med)
Above Freezing % (Med) All Avg Above Freezing % (Low) Above Freezing % (Low) All Avg
Linear (Above Freezing % (High)) Poly. (Above Freezing % (High)) Linear (Above Freezing % (Med))
Poly. (Above Freezing % (Med)) Linear (Above Freezing % (Low)) Poly. (Above Freezing % (Low))
0
10
20
30
40
50
60
70
80
90
100
1873 1887 1897 1908 1918 1928 1938 1948 1958 1968 1978 1988 1998 2008
AxisTitle
Above Freezing November Percentile
Above Freezing % (High) Above Freezing % (High) All Avg Above Freezing % (Med)
Above Freezing % (Med) All Avg Above Freezing % (Low) Above Freezing % (Low) All Avg
Linear (Above Freezing % (High)) Poly. (Above Freezing % (High)) Linear (Above Freezing % (Med))
Poly. (Above Freezing % (Med)) Linear (Above Freezing % (Low)) Poly. (Above Freezing % (Low))
0
10
20
30
40
50
60
70
80
90
100
1873 1887 1897 1908 1918 1928 1938 1948 1958 1968 1978 1988 1998 2008
AxisTitle
Above Freezing December Percentile
Above Freezing % (High) Above Freezing % (High) All Avg Above Freezing % (Med)
Above Freezing % (Med) All Avg Above Freezing % (Low) Above Freezing % (Low) All Avg
Linear (Above Freezing % (High)) Poly. (Above Freezing % (High)) Linear (Above Freezing % (Med))
Poly. (Above Freezing % (Med)) Linear (Above Freezing % (Low)) Poly. (Above Freezing % (Low))
0
10
20
30
40
50
60
70
80
90
100
1873 1887 1897 1908 1918 1928 1938 1948 1958 1968 1978 1988 1998 2008
Above Freezing Annual Percentile Highs (by month)
Poly. (January) Poly. (February) Poly. (March)
Poly. (April) Poly. (October) Poly. (November)
Poly. (December)
Never below 100%:
May, June, July, August,
September
0
10
20
30
40
50
60
70
80
90
100
1873 1887 1897 1908 1918 1928 1938 1948 1958 1968 1978 1988 1998 2008
Above Freezing Annual Percentile Median (by month)
Poly. (January) Poly. (February) Poly. (March)
Poly. (April) Poly. (May) Poly. (October)
Poly. (November) Poly. (December)
Never below 100%:
June, July, August,
September
0
10
20
30
40
50
60
70
80
90
100
1873 1887 1897 1908 1918 1928 1938 1948 1958 1968 1978 1988 1998 2008
Above Freezing Annual Percentile Lows (by month)
Poly. (January) Poly. (February) Poly. (March)
Poly. (April) Poly. (May) Poly. (September)
Poly. (October) Poly. (November) Poly. (December)
Never below 100%:
June, July, August
0
10
20
30
40
50
60
70
80
90
100
1873 1887 1897 1908 1918 1928 1938 1948 1958 1968 1978 1988 1998 2008
Population, CO2 and temperatures compared to recorded MAX
Poly. (Canadian Pop.) Poly. (World Pop.) Poly. (World CO2 Growth)
Poly. (Above Freeze Low) Poly. (High (Avg)) Poly. (Median (Avg))
Poly. (Low (Avg))
These trend-lines are based on the percentages of the year value compared to the maximum value.

More Related Content

Featured

2024 State of Marketing Report – by Hubspot
2024 State of Marketing Report – by Hubspot2024 State of Marketing Report – by Hubspot
2024 State of Marketing Report – by Hubspot
Marius Sescu
 
Everything You Need To Know About ChatGPT
Everything You Need To Know About ChatGPTEverything You Need To Know About ChatGPT
Everything You Need To Know About ChatGPT
Expeed Software
 
Product Design Trends in 2024 | Teenage Engineerings
Product Design Trends in 2024 | Teenage EngineeringsProduct Design Trends in 2024 | Teenage Engineerings
Product Design Trends in 2024 | Teenage Engineerings
Pixeldarts
 
How Race, Age and Gender Shape Attitudes Towards Mental Health
How Race, Age and Gender Shape Attitudes Towards Mental HealthHow Race, Age and Gender Shape Attitudes Towards Mental Health
How Race, Age and Gender Shape Attitudes Towards Mental Health
ThinkNow
 
AI Trends in Creative Operations 2024 by Artwork Flow.pdf
AI Trends in Creative Operations 2024 by Artwork Flow.pdfAI Trends in Creative Operations 2024 by Artwork Flow.pdf
AI Trends in Creative Operations 2024 by Artwork Flow.pdf
marketingartwork
 
Skeleton Culture Code
Skeleton Culture CodeSkeleton Culture Code
Skeleton Culture Code
Skeleton Technologies
 
PEPSICO Presentation to CAGNY Conference Feb 2024
PEPSICO Presentation to CAGNY Conference Feb 2024PEPSICO Presentation to CAGNY Conference Feb 2024
PEPSICO Presentation to CAGNY Conference Feb 2024
Neil Kimberley
 
Content Methodology: A Best Practices Report (Webinar)
Content Methodology: A Best Practices Report (Webinar)Content Methodology: A Best Practices Report (Webinar)
Content Methodology: A Best Practices Report (Webinar)
contently
 
How to Prepare For a Successful Job Search for 2024
How to Prepare For a Successful Job Search for 2024How to Prepare For a Successful Job Search for 2024
How to Prepare For a Successful Job Search for 2024
Albert Qian
 
Social Media Marketing Trends 2024 // The Global Indie Insights
Social Media Marketing Trends 2024 // The Global Indie InsightsSocial Media Marketing Trends 2024 // The Global Indie Insights
Social Media Marketing Trends 2024 // The Global Indie Insights
Kurio // The Social Media Age(ncy)
 
Trends In Paid Search: Navigating The Digital Landscape In 2024
Trends In Paid Search: Navigating The Digital Landscape In 2024Trends In Paid Search: Navigating The Digital Landscape In 2024
Trends In Paid Search: Navigating The Digital Landscape In 2024
Search Engine Journal
 
5 Public speaking tips from TED - Visualized summary
5 Public speaking tips from TED - Visualized summary5 Public speaking tips from TED - Visualized summary
5 Public speaking tips from TED - Visualized summary
SpeakerHub
 
ChatGPT and the Future of Work - Clark Boyd
ChatGPT and the Future of Work - Clark Boyd ChatGPT and the Future of Work - Clark Boyd
ChatGPT and the Future of Work - Clark Boyd
Clark Boyd
 
Getting into the tech field. what next
Getting into the tech field. what next Getting into the tech field. what next
Getting into the tech field. what next
Tessa Mero
 
Google's Just Not That Into You: Understanding Core Updates & Search Intent
Google's Just Not That Into You: Understanding Core Updates & Search IntentGoogle's Just Not That Into You: Understanding Core Updates & Search Intent
Google's Just Not That Into You: Understanding Core Updates & Search Intent
Lily Ray
 
How to have difficult conversations
How to have difficult conversations How to have difficult conversations
How to have difficult conversations
Rajiv Jayarajah, MAppComm, ACC
 
Introduction to Data Science
Introduction to Data ScienceIntroduction to Data Science
Introduction to Data Science
Christy Abraham Joy
 
Time Management & Productivity - Best Practices
Time Management & Productivity -  Best PracticesTime Management & Productivity -  Best Practices
Time Management & Productivity - Best Practices
Vit Horky
 
The six step guide to practical project management
The six step guide to practical project managementThe six step guide to practical project management
The six step guide to practical project management
MindGenius
 
Beginners Guide to TikTok for Search - Rachel Pearson - We are Tilt __ Bright...
Beginners Guide to TikTok for Search - Rachel Pearson - We are Tilt __ Bright...Beginners Guide to TikTok for Search - Rachel Pearson - We are Tilt __ Bright...
Beginners Guide to TikTok for Search - Rachel Pearson - We are Tilt __ Bright...
RachelPearson36
 

Featured (20)

2024 State of Marketing Report – by Hubspot
2024 State of Marketing Report – by Hubspot2024 State of Marketing Report – by Hubspot
2024 State of Marketing Report – by Hubspot
 
Everything You Need To Know About ChatGPT
Everything You Need To Know About ChatGPTEverything You Need To Know About ChatGPT
Everything You Need To Know About ChatGPT
 
Product Design Trends in 2024 | Teenage Engineerings
Product Design Trends in 2024 | Teenage EngineeringsProduct Design Trends in 2024 | Teenage Engineerings
Product Design Trends in 2024 | Teenage Engineerings
 
How Race, Age and Gender Shape Attitudes Towards Mental Health
How Race, Age and Gender Shape Attitudes Towards Mental HealthHow Race, Age and Gender Shape Attitudes Towards Mental Health
How Race, Age and Gender Shape Attitudes Towards Mental Health
 
AI Trends in Creative Operations 2024 by Artwork Flow.pdf
AI Trends in Creative Operations 2024 by Artwork Flow.pdfAI Trends in Creative Operations 2024 by Artwork Flow.pdf
AI Trends in Creative Operations 2024 by Artwork Flow.pdf
 
Skeleton Culture Code
Skeleton Culture CodeSkeleton Culture Code
Skeleton Culture Code
 
PEPSICO Presentation to CAGNY Conference Feb 2024
PEPSICO Presentation to CAGNY Conference Feb 2024PEPSICO Presentation to CAGNY Conference Feb 2024
PEPSICO Presentation to CAGNY Conference Feb 2024
 
Content Methodology: A Best Practices Report (Webinar)
Content Methodology: A Best Practices Report (Webinar)Content Methodology: A Best Practices Report (Webinar)
Content Methodology: A Best Practices Report (Webinar)
 
How to Prepare For a Successful Job Search for 2024
How to Prepare For a Successful Job Search for 2024How to Prepare For a Successful Job Search for 2024
How to Prepare For a Successful Job Search for 2024
 
Social Media Marketing Trends 2024 // The Global Indie Insights
Social Media Marketing Trends 2024 // The Global Indie InsightsSocial Media Marketing Trends 2024 // The Global Indie Insights
Social Media Marketing Trends 2024 // The Global Indie Insights
 
Trends In Paid Search: Navigating The Digital Landscape In 2024
Trends In Paid Search: Navigating The Digital Landscape In 2024Trends In Paid Search: Navigating The Digital Landscape In 2024
Trends In Paid Search: Navigating The Digital Landscape In 2024
 
5 Public speaking tips from TED - Visualized summary
5 Public speaking tips from TED - Visualized summary5 Public speaking tips from TED - Visualized summary
5 Public speaking tips from TED - Visualized summary
 
ChatGPT and the Future of Work - Clark Boyd
ChatGPT and the Future of Work - Clark Boyd ChatGPT and the Future of Work - Clark Boyd
ChatGPT and the Future of Work - Clark Boyd
 
Getting into the tech field. what next
Getting into the tech field. what next Getting into the tech field. what next
Getting into the tech field. what next
 
Google's Just Not That Into You: Understanding Core Updates & Search Intent
Google's Just Not That Into You: Understanding Core Updates & Search IntentGoogle's Just Not That Into You: Understanding Core Updates & Search Intent
Google's Just Not That Into You: Understanding Core Updates & Search Intent
 
How to have difficult conversations
How to have difficult conversations How to have difficult conversations
How to have difficult conversations
 
Introduction to Data Science
Introduction to Data ScienceIntroduction to Data Science
Introduction to Data Science
 
Time Management & Productivity - Best Practices
Time Management & Productivity -  Best PracticesTime Management & Productivity -  Best Practices
Time Management & Productivity - Best Practices
 
The six step guide to practical project management
The six step guide to practical project managementThe six step guide to practical project management
The six step guide to practical project management
 
Beginners Guide to TikTok for Search - Rachel Pearson - We are Tilt __ Bright...
Beginners Guide to TikTok for Search - Rachel Pearson - We are Tilt __ Bright...Beginners Guide to TikTok for Search - Rachel Pearson - We are Tilt __ Bright...
Beginners Guide to TikTok for Search - Rachel Pearson - We are Tilt __ Bright...
 

Ottawa Climat Charts 1873 to 2015

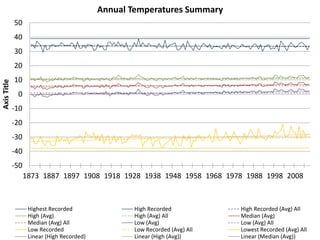
  • 1. -50 -40 -30 -20 -10 0 10 20 30 40 50 1873 1887 1897 1908 1918 1928 1938 1948 1958 1968 1978 1988 1998 2008 AxisTitle Annual Temperatures Summary Highest Recorded High Recorded High Recorded (Avg) All High (Avg) High (Avg) All Median (Avg) Median (Avg) All Low (Avg) Low (Avg) All Low Recorded Low Recorded (Avg) All Lowest Recorded (Avg) All Linear (High Recorded) Linear (High (Avg)) Linear (Median (Avg))
  • 2. -40 -30 -20 -10 0 10 20 1873 1887 1897 1908 1918 1928 1938 1948 1958 1968 1978 1988 1998 2008 AxisTitle Annual Temperatures January Highest Recorded High Recorded High Recorded (Avg) All High (Avg) High (Avg) All Median (Avg) Median (Avg) All Low (Avg) Low (Avg) All Low Recorded Low Recorded (Avg) All Lowest Recorded (Avg) All Linear (High Recorded) Linear (High (Avg)) Linear (Median (Avg))
  • 3. -50 -40 -30 -20 -10 0 10 20 1873 1887 1897 1908 1918 1928 1938 1948 1958 1968 1978 1988 1998 2008 AxisTitle Annual Temperatures February Highest Recorded High Recorded High Recorded (Avg) All High (Avg) High (Avg) All Median (Avg) Median (Avg) All Low (Avg) Low (Avg) All Low Recorded Low Recorded (Avg) All Lowest Recorded (Avg) All Linear (High Recorded) Linear (High (Avg)) Linear (Median (Avg))
  • 4. -40 -30 -20 -10 0 10 20 30 1873 1887 1897 1908 1918 1928 1938 1948 1958 1968 1978 1988 1998 2008 AxisTitle Annual Temperatures March Highest Recorded High Recorded High Recorded (Avg) All High (Avg) High (Avg) All Median (Avg) Median (Avg) All Low (Avg) Low (Avg) All Low Recorded Low Recorded (Avg) All Lowest Recorded (Avg) All Linear (High Recorded) Linear (High (Avg)) Linear (Median (Avg))
  • 5. -30 -20 -10 0 10 20 30 40 1873 1887 1897 1908 1918 1928 1938 1948 1958 1968 1978 1988 1998 2008 AxisTitle Annual Temperatures April Highest Recorded High Recorded High Recorded (Avg) All High (Avg) High (Avg) All Median (Avg) Median (Avg) All Low (Avg) Low (Avg) All Low Recorded Low Recorded (Avg) All Lowest Recorded (Avg) All Linear (High Recorded) Linear (High (Avg)) Linear (Median (Avg))
  • 6. -10 -5 0 5 10 15 20 25 30 35 40 1873 1887 1897 1908 1918 1928 1938 1948 1958 1968 1978 1988 1998 2008 AxisTitle Annual Temperatures May Highest Recorded High Recorded High Recorded (Avg) All High (Avg) High (Avg) All Median (Avg) Median (Avg) All Low (Avg) Low (Avg) All Low Recorded Low Recorded (Avg) All Lowest Recorded (Avg) All Linear (High Recorded) Linear (High (Avg)) Linear (Median (Avg))
  • 7. 0 5 10 15 20 25 30 35 40 1873 1887 1897 1908 1918 1928 1938 1948 1958 1968 1978 1988 1998 2008 AxisTitle Annual Temperatures June Highest Recorded High Recorded High Recorded (Avg) All High (Avg) High (Avg) All Median (Avg) Median (Avg) All Low (Avg) Low (Avg) All Low Recorded Low Recorded (Avg) All Lowest Recorded (Avg) All Linear (High Recorded) Linear (High (Avg)) Linear (Median (Avg))
  • 8. 0 5 10 15 20 25 30 35 40 45 1873 1887 1897 1908 1918 1928 1938 1948 1958 1968 1978 1988 1998 2008 AxisTitle Annual Temperatures July Highest Recorded High Recorded High Recorded (Avg) All High (Avg) High (Avg) All Median (Avg) Median (Avg) All Low (Avg) Low (Avg) All Low Recorded Low Recorded (Avg) All Lowest Recorded (Avg) All Linear (High Recorded) Linear (High (Avg)) Linear (Median (Avg))
  • 9. 0 5 10 15 20 25 30 35 40 1873 1887 1897 1908 1918 1928 1938 1948 1958 1968 1978 1988 1998 2008 AxisTitle Annual Temperatures August Highest Recorded High Recorded High Recorded (Avg) All High (Avg) High (Avg) All Median (Avg) Median (Avg) All Low (Avg) Low (Avg) All Low Recorded Low Recorded (Avg) All Lowest Recorded (Avg) All Linear (High Recorded) Linear (High (Avg)) Linear (Median (Avg))
  • 10. -10 -5 0 5 10 15 20 25 30 35 40 45 1873 1887 1897 1908 1918 1928 1938 1948 1958 1968 1978 1988 1998 2008 AxisTitle Annual Temperatures September Highest Recorded High Recorded High Recorded (Avg) All High (Avg) High (Avg) All Median (Avg) Median (Avg) All Low (Avg) Low (Avg) All Low Recorded Low Recorded (Avg) All Lowest Recorded (Avg) All Linear (High Recorded) Linear (High (Avg)) Linear (Median (Avg))
  • 11. -15 -10 -5 0 5 10 15 20 25 30 35 1873 1887 1897 1908 1918 1928 1938 1948 1958 1968 1978 1988 1998 2008 AxisTitle Annual Temperatures October Highest Recorded High Recorded High Recorded (Avg) All High (Avg) High (Avg) All Median (Avg) Median (Avg) All Low (Avg) Low (Avg) All Low Recorded Low Recorded (Avg) All Lowest Recorded (Avg) All Linear (High Recorded) Linear (High (Avg)) Linear (Median (Avg))
  • 12. -40 -30 -20 -10 0 10 20 30 1873 1887 1897 1908 1918 1928 1938 1948 1958 1968 1978 1988 1998 2008 AxisTitle Annual Temperatures November Highest Recorded High Recorded High Recorded (Avg) All High (Avg) High (Avg) All Median (Avg) Median (Avg) All Low (Avg) Low (Avg) All Low Recorded Low Recorded (Avg) All Lowest Recorded (Avg) All Linear (High Recorded) Linear (High (Avg)) Linear (Median (Avg))
  • 13. -40 -30 -20 -10 0 10 20 1873 1887 1897 1908 1918 1928 1938 1948 1958 1968 1978 1988 1998 2008 AxisTitle Annual Temperatures December Highest Recorded High Recorded High Recorded (Avg) All High (Avg) High (Avg) All Median (Avg) Median (Avg) All Low (Avg) Low (Avg) All Low Recorded Low Recorded (Avg) All Lowest Recorded (Avg) All Linear (High Recorded) Linear (High (Avg)) Linear (Median (Avg))
  • 14. 0 10 20 30 40 50 60 70 80 90 100 1873 1887 1897 1908 1918 1928 1938 1948 1958 1968 1978 1988 1998 2008 AxisTitle Above Freezing Annual Percentile Above Freezing % (High) Above Freezing % (High) All Avg Above Freezing % (Med) Above Freezing % (Med) All Avg Above Freezing % (Low) Above Freezing % (Low) All Avg Linear (Above Freezing % (High)) Poly. (Above Freezing % (High)) Linear (Above Freezing % (Med)) Poly. (Above Freezing % (Med)) Linear (Above Freezing % (Low)) Poly. (Above Freezing % (Low))
  • 15. 0 10 20 30 40 50 60 70 80 90 100 1873 1887 1897 1908 1918 1928 1938 1948 1958 1968 1978 1988 1998 2008 AxisTitle Above Freezing January Percentile Above Freezing % (High) Above Freezing % (High) All Avg Above Freezing % (Med) Above Freezing % (Med) All Avg Above Freezing % (Low) Above Freezing % (Low) All Avg Linear (Above Freezing % (High)) Poly. (Above Freezing % (High)) Linear (Above Freezing % (Med)) Poly. (Above Freezing % (Med)) Linear (Above Freezing % (Low)) Poly. (Above Freezing % (Low))
  • 16. 0 10 20 30 40 50 60 70 80 90 100 1873 1887 1897 1908 1918 1928 1938 1948 1958 1968 1978 1988 1998 2008 AxisTitle Above Freezing February Percentile Above Freezing % (High) Above Freezing % (High) All Avg Above Freezing % (Med) Above Freezing % (Med) All Avg Above Freezing % (Low) Above Freezing % (Low) All Avg Linear (Above Freezing % (High)) Poly. (Above Freezing % (High)) Linear (Above Freezing % (Med)) Poly. (Above Freezing % (Med)) Linear (Above Freezing % (Low)) Poly. (Above Freezing % (Low))
  • 17. 0 10 20 30 40 50 60 70 80 90 100 1873 1887 1897 1908 1918 1928 1938 1948 1958 1968 1978 1988 1998 2008 AxisTitle Above Freezing March Percentile Above Freezing % (High) Above Freezing % (High) All Avg Above Freezing % (Med) Above Freezing % (Med) All Avg Above Freezing % (Low) Above Freezing % (Low) All Avg Linear (Above Freezing % (High)) Poly. (Above Freezing % (High)) Linear (Above Freezing % (Med)) Poly. (Above Freezing % (Med)) Linear (Above Freezing % (Low)) Poly. (Above Freezing % (Low))
  • 18. 0 10 20 30 40 50 60 70 80 90 100 1873 1887 1897 1908 1918 1928 1938 1948 1958 1968 1978 1988 1998 2008 AxisTitle Above Freezing April Percentile Above Freezing % (High) Above Freezing % (High) All Avg Above Freezing % (Med) Above Freezing % (Med) All Avg Above Freezing % (Low) Above Freezing % (Low) All Avg Linear (Above Freezing % (High)) Poly. (Above Freezing % (High)) Linear (Above Freezing % (Med)) Poly. (Above Freezing % (Med)) Linear (Above Freezing % (Low)) Poly. (Above Freezing % (Low))
  • 19. 0 10 20 30 40 50 60 70 80 90 100 1873 1887 1897 1908 1918 1928 1938 1948 1958 1968 1978 1988 1998 2008 AxisTitle Above Freezing May Percentile Above Freezing % (High) Above Freezing % (High) All Avg Above Freezing % (Med) Above Freezing % (Med) All Avg Above Freezing % (Low) Above Freezing % (Low) All Avg Linear (Above Freezing % (High)) Poly. (Above Freezing % (High)) Linear (Above Freezing % (Med)) Poly. (Above Freezing % (Med)) Linear (Above Freezing % (Low)) Poly. (Above Freezing % (Low))
  • 20. 0 10 20 30 40 50 60 70 80 90 100 1873 1887 1897 1908 1918 1928 1938 1948 1958 1968 1978 1988 1998 2008 AxisTitle Above Freezing June Percentile Above Freezing % (High) Above Freezing % (High) All Avg Above Freezing % (Med) Above Freezing % (Med) All Avg Above Freezing % (Low) Above Freezing % (Low) All Avg Linear (Above Freezing % (High)) Poly. (Above Freezing % (High)) Linear (Above Freezing % (Med)) Poly. (Above Freezing % (Med)) Linear (Above Freezing % (Low)) Poly. (Above Freezing % (Low)) 100% of all recorded temperatures for this month are above freezing.
  • 21. 0 10 20 30 40 50 60 70 80 90 100 1873 1887 1897 1908 1918 1928 1938 1948 1958 1968 1978 1988 1998 2008 AxisTitle Above Freezing July Percentile Above Freezing % (High) Above Freezing % (High) All Avg Above Freezing % (Med) Above Freezing % (Med) All Avg Above Freezing % (Low) Above Freezing % (Low) All Avg Linear (Above Freezing % (High)) Poly. (Above Freezing % (High)) Linear (Above Freezing % (Med)) Poly. (Above Freezing % (Med)) Linear (Above Freezing % (Low)) Poly. (Above Freezing % (Low)) 100% of all recorded temperatures for this month are above freezing.
  • 22. 0 10 20 30 40 50 60 70 80 90 100 1873 1887 1897 1908 1918 1928 1938 1948 1958 1968 1978 1988 1998 2008 AxisTitle Above Freezing August Percentile Above Freezing % (High) Above Freezing % (High) All Avg Above Freezing % (Med) Above Freezing % (Med) All Avg Above Freezing % (Low) Above Freezing % (Low) All Avg Linear (Above Freezing % (High)) Poly. (Above Freezing % (High)) Linear (Above Freezing % (Med)) Poly. (Above Freezing % (Med)) Linear (Above Freezing % (Low)) Poly. (Above Freezing % (Low)) 100% of all recorded temperatures for this month are above freezing.
  • 23. 0 10 20 30 40 50 60 70 80 90 100 1873 1887 1897 1908 1918 1928 1938 1948 1958 1968 1978 1988 1998 2008 AxisTitle Above Freezing September Percentile Above Freezing % (High) Above Freezing % (High) All Avg Above Freezing % (Med) Above Freezing % (Med) All Avg Above Freezing % (Low) Above Freezing % (Low) All Avg Linear (Above Freezing % (High)) Poly. (Above Freezing % (High)) Linear (Above Freezing % (Med)) Poly. (Above Freezing % (Med)) Linear (Above Freezing % (Low)) Poly. (Above Freezing % (Low))
  • 24. 0 10 20 30 40 50 60 70 80 90 100 1873 1887 1897 1908 1918 1928 1938 1948 1958 1968 1978 1988 1998 2008 AxisTitle Above Freezing October Percentile Above Freezing % (High) Above Freezing % (High) All Avg Above Freezing % (Med) Above Freezing % (Med) All Avg Above Freezing % (Low) Above Freezing % (Low) All Avg Linear (Above Freezing % (High)) Poly. (Above Freezing % (High)) Linear (Above Freezing % (Med)) Poly. (Above Freezing % (Med)) Linear (Above Freezing % (Low)) Poly. (Above Freezing % (Low))
  • 25. 0 10 20 30 40 50 60 70 80 90 100 1873 1887 1897 1908 1918 1928 1938 1948 1958 1968 1978 1988 1998 2008 AxisTitle Above Freezing November Percentile Above Freezing % (High) Above Freezing % (High) All Avg Above Freezing % (Med) Above Freezing % (Med) All Avg Above Freezing % (Low) Above Freezing % (Low) All Avg Linear (Above Freezing % (High)) Poly. (Above Freezing % (High)) Linear (Above Freezing % (Med)) Poly. (Above Freezing % (Med)) Linear (Above Freezing % (Low)) Poly. (Above Freezing % (Low))
  • 26. 0 10 20 30 40 50 60 70 80 90 100 1873 1887 1897 1908 1918 1928 1938 1948 1958 1968 1978 1988 1998 2008 AxisTitle Above Freezing December Percentile Above Freezing % (High) Above Freezing % (High) All Avg Above Freezing % (Med) Above Freezing % (Med) All Avg Above Freezing % (Low) Above Freezing % (Low) All Avg Linear (Above Freezing % (High)) Poly. (Above Freezing % (High)) Linear (Above Freezing % (Med)) Poly. (Above Freezing % (Med)) Linear (Above Freezing % (Low)) Poly. (Above Freezing % (Low))
  • 27. 0 10 20 30 40 50 60 70 80 90 100 1873 1887 1897 1908 1918 1928 1938 1948 1958 1968 1978 1988 1998 2008 Above Freezing Annual Percentile Highs (by month) Poly. (January) Poly. (February) Poly. (March) Poly. (April) Poly. (October) Poly. (November) Poly. (December) Never below 100%: May, June, July, August, September
  • 28. 0 10 20 30 40 50 60 70 80 90 100 1873 1887 1897 1908 1918 1928 1938 1948 1958 1968 1978 1988 1998 2008 Above Freezing Annual Percentile Median (by month) Poly. (January) Poly. (February) Poly. (March) Poly. (April) Poly. (May) Poly. (October) Poly. (November) Poly. (December) Never below 100%: June, July, August, September
  • 29. 0 10 20 30 40 50 60 70 80 90 100 1873 1887 1897 1908 1918 1928 1938 1948 1958 1968 1978 1988 1998 2008 Above Freezing Annual Percentile Lows (by month) Poly. (January) Poly. (February) Poly. (March) Poly. (April) Poly. (May) Poly. (September) Poly. (October) Poly. (November) Poly. (December) Never below 100%: June, July, August
  • 30. 0 10 20 30 40 50 60 70 80 90 100 1873 1887 1897 1908 1918 1928 1938 1948 1958 1968 1978 1988 1998 2008 Population, CO2 and temperatures compared to recorded MAX Poly. (Canadian Pop.) Poly. (World Pop.) Poly. (World CO2 Growth) Poly. (Above Freeze Low) Poly. (High (Avg)) Poly. (Median (Avg)) Poly. (Low (Avg)) These trend-lines are based on the percentages of the year value compared to the maximum value.
  • 31. 0 10 20 30 40 50 60 70 80 90 100 1873 1887 1897 1908 1918 1928 1938 1948 1958 1968 1978 1988 1998 2008 Population, CO2 and temperatures compared to recorded MAX Poly. (Canadian Pop.) Poly. (World Pop.) Poly. (World CO2 Growth) Poly. (Above Freeze Low) Poly. (High (Avg)) Poly. (Median (Avg)) Poly. (Low (Avg)) These trend-lines are based on the percentages of the year value compared to the maximum value.
  • 32. 0 10 20 30 40 50 60 70 80 90 100 1873 1887 1897 1908 1918 1928 1938 1948 1958 1968 1978 1988 1998 2008 Population, CO2 and temperatures compared to recorded MAX Poly. (Canadian Pop.) Poly. (World Pop.) Poly. (World CO2 Growth) Poly. (Above Freeze Low) Poly. (High (Avg)) Poly. (Median (Avg)) Poly. (Low (Avg)) These trend-lines are based on the percentages of the year value compared to the maximum value.
  • 33. 0 10 20 30 40 50 60 70 80 90 100 1873 1887 1897 1908 1918 1928 1938 1948 1958 1968 1978 1988 1998 2008 Population, CO2 and temperatures compared to recorded MAX Poly. (Canadian Pop.) Poly. (World Pop.) Poly. (World CO2 Growth) Poly. (Above Freeze Low) Poly. (High (Avg)) Poly. (Median (Avg)) Poly. (Low (Avg)) These trend-lines are based on the percentages of the year value compared to the maximum value.
  • 34. 0 10 20 30 40 50 60 70 80 90 100 1873 1887 1897 1908 1918 1928 1938 1948 1958 1968 1978 1988 1998 2008 Population, CO2 and temperatures compared to recorded MAX Poly. (Canadian Pop.) Poly. (World Pop.) Poly. (World CO2 Growth) Poly. (Above Freeze Low) Poly. (High (Avg)) Poly. (Median (Avg)) Poly. (Low (Avg)) These trend-lines are based on the percentages of the year value compared to the maximum value.