Download to read offline
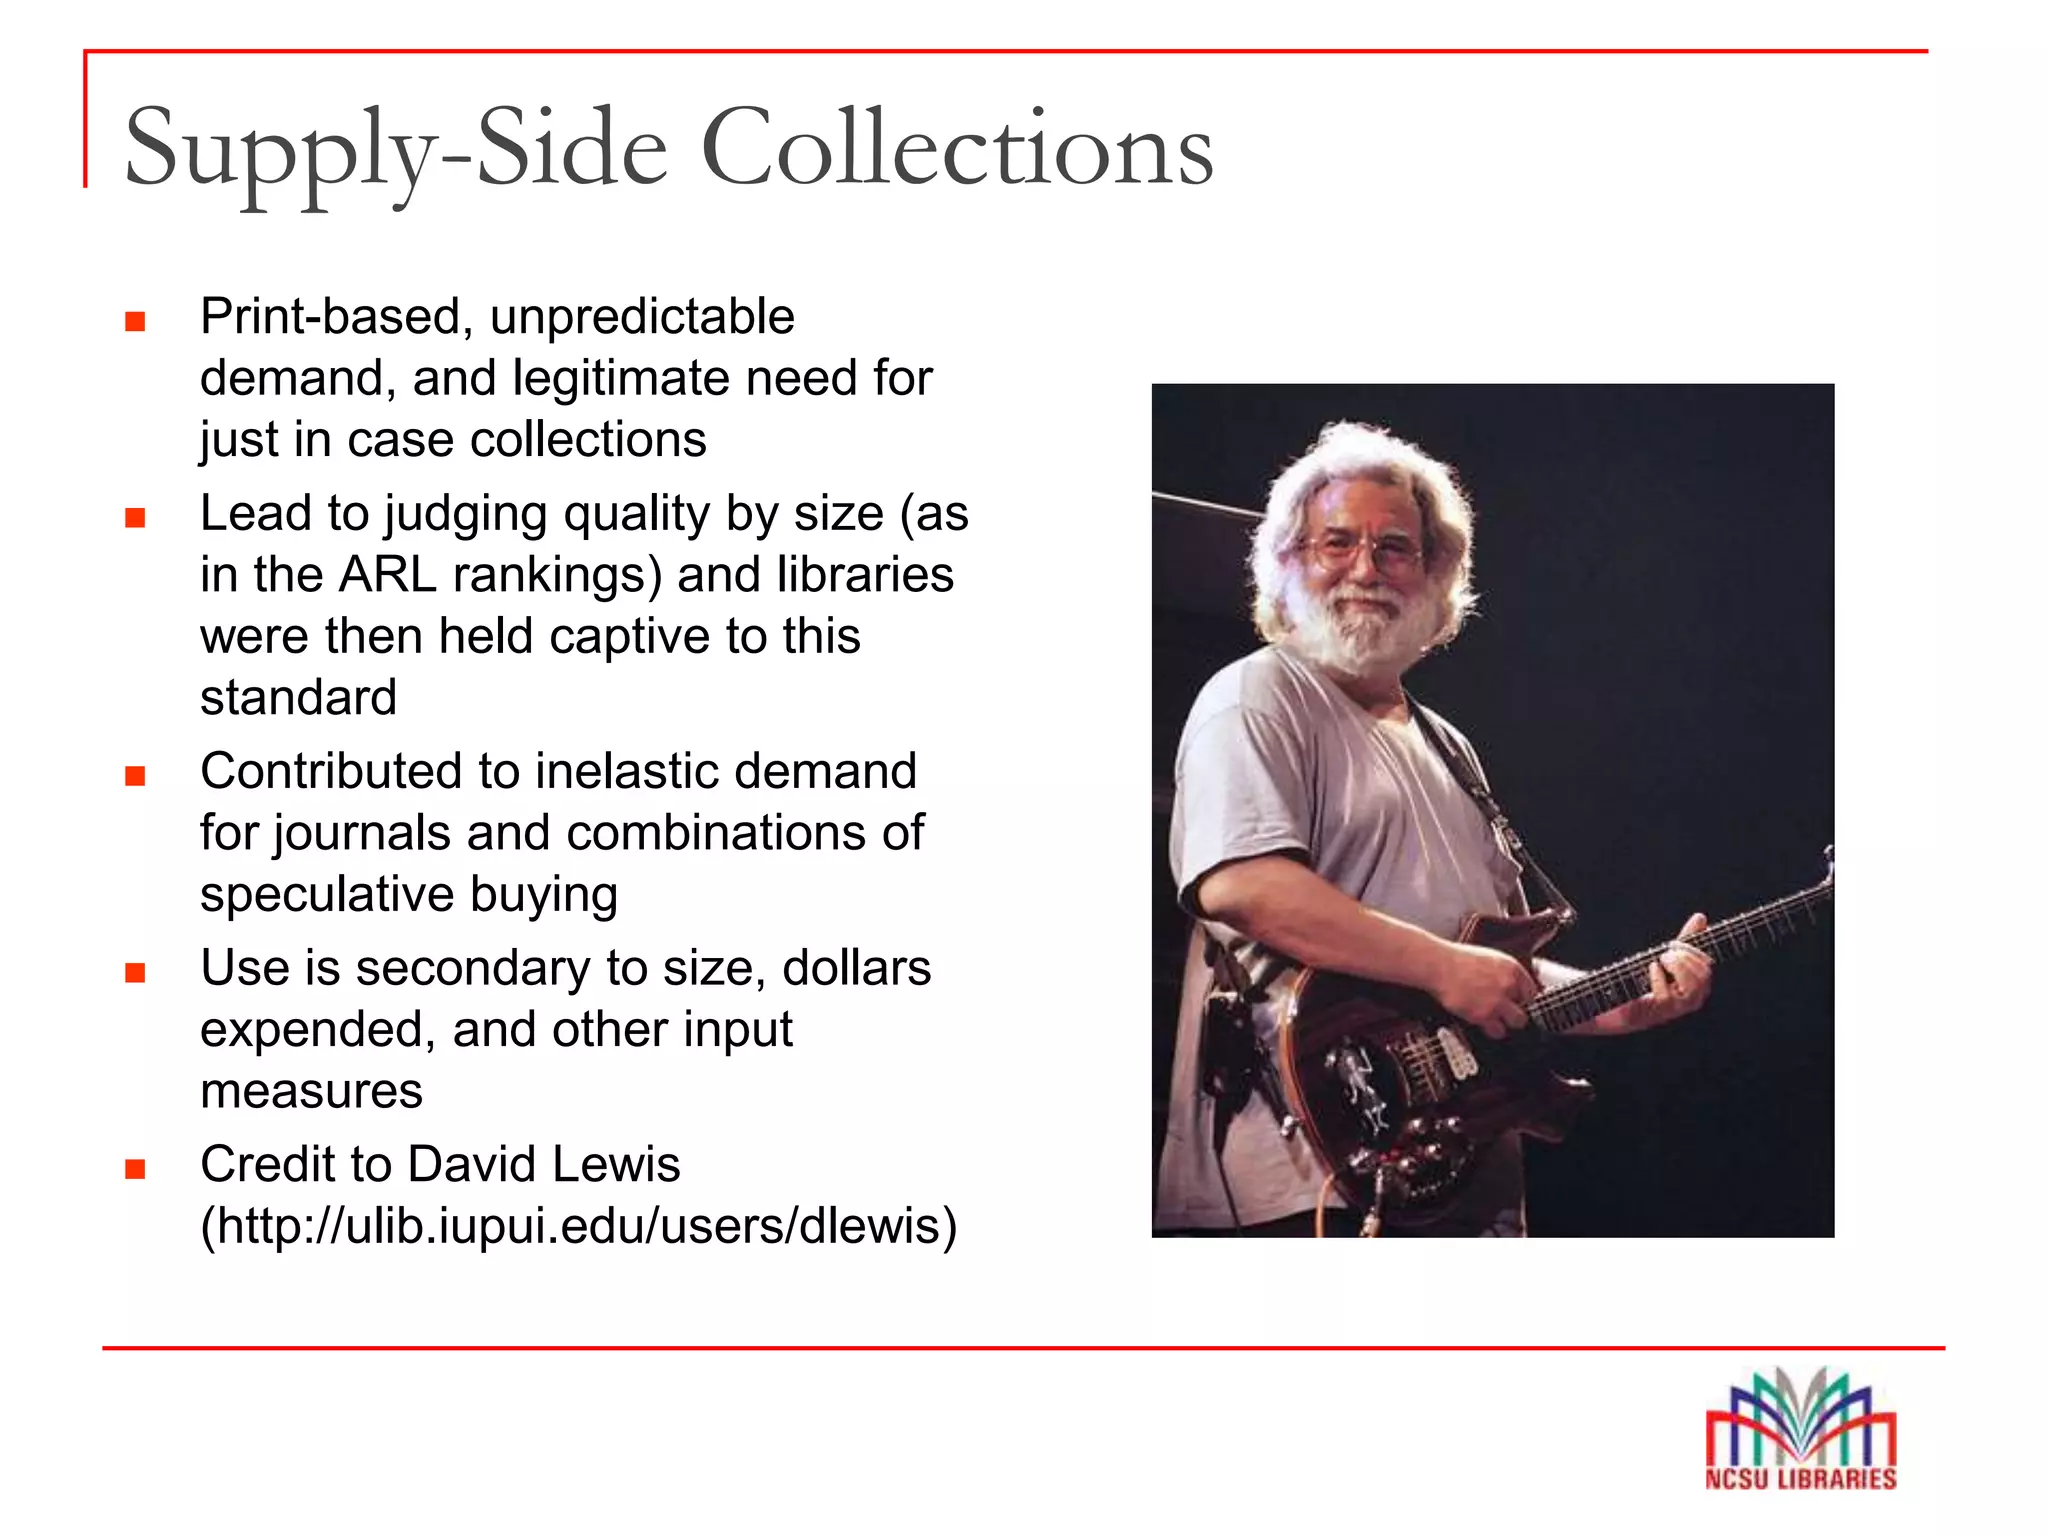
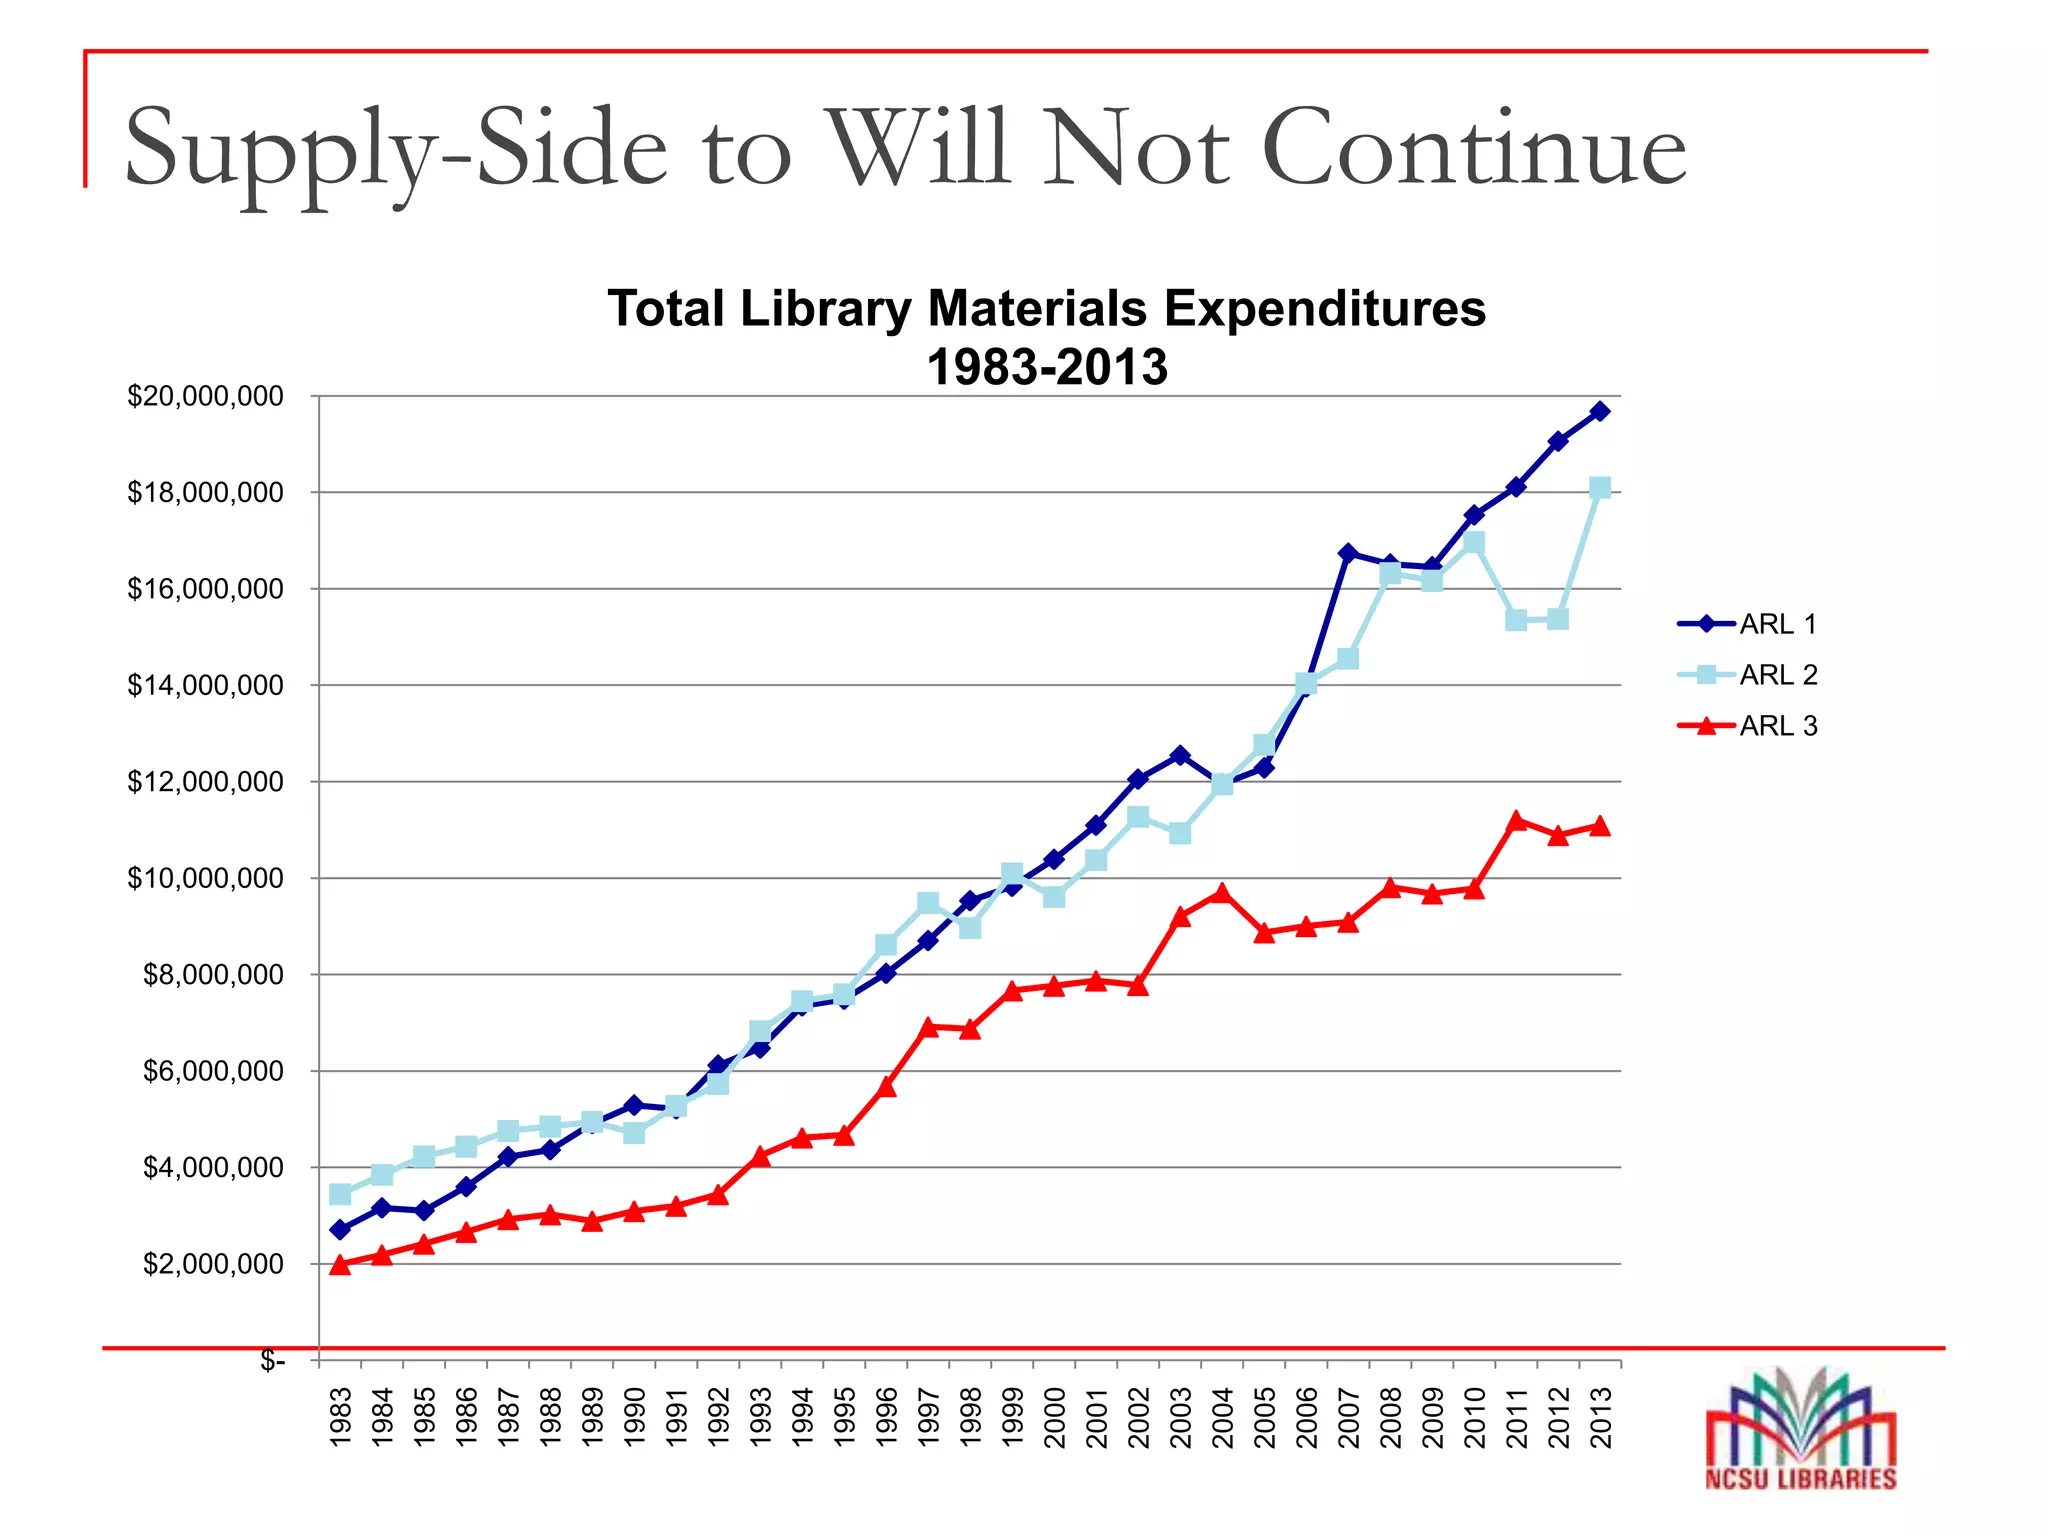
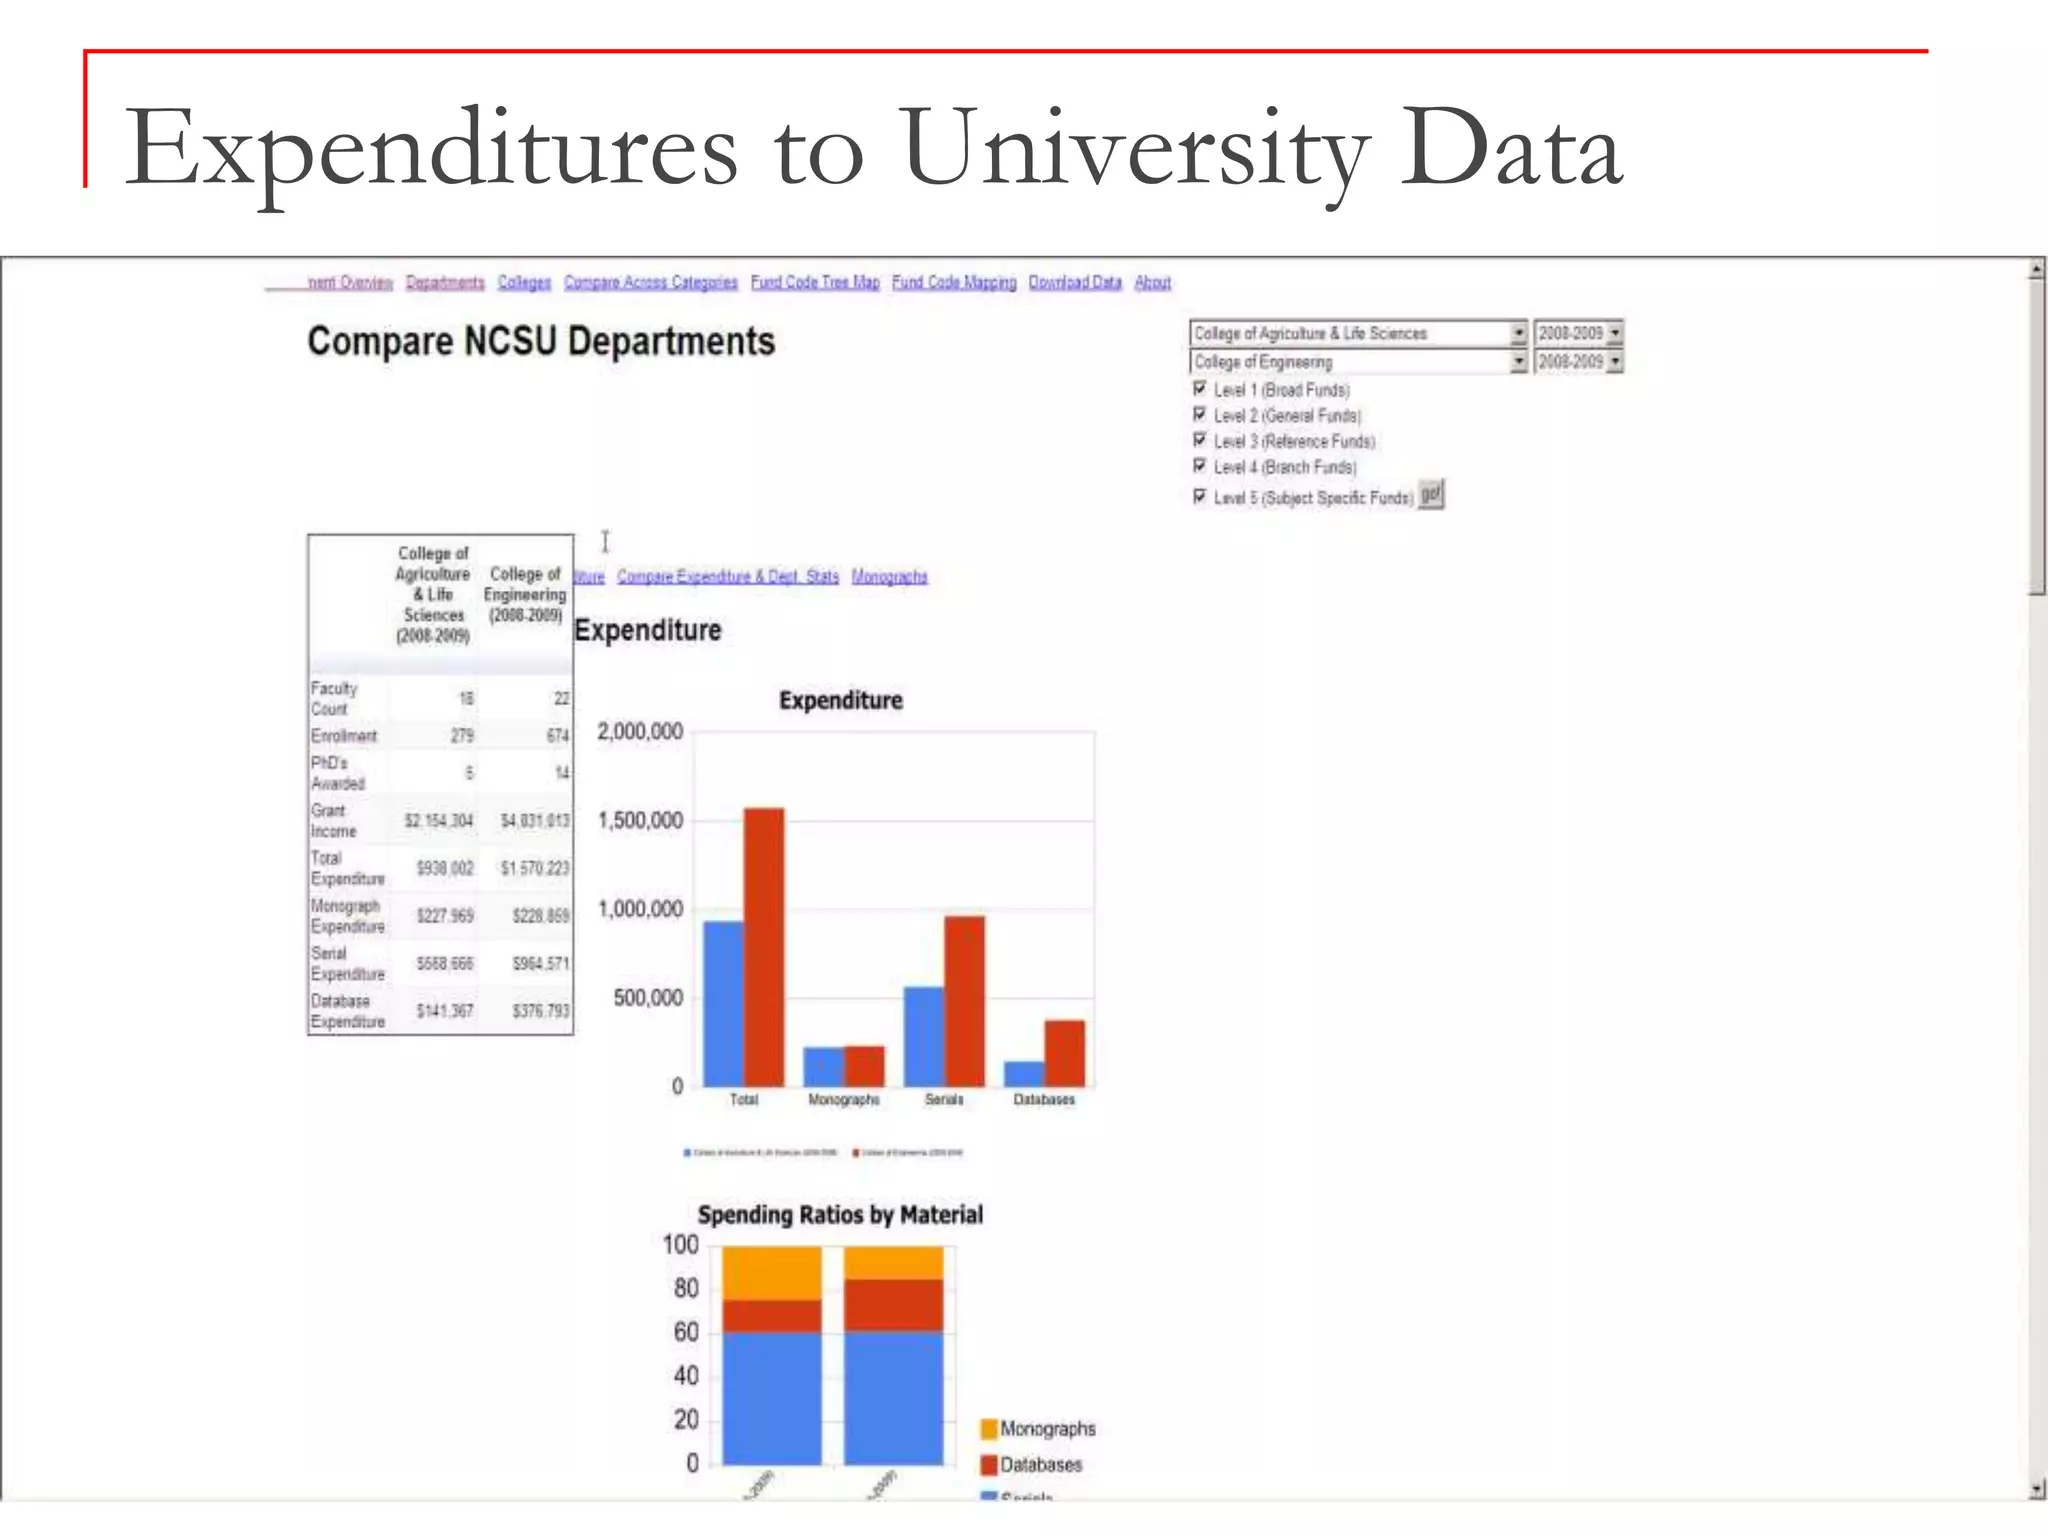

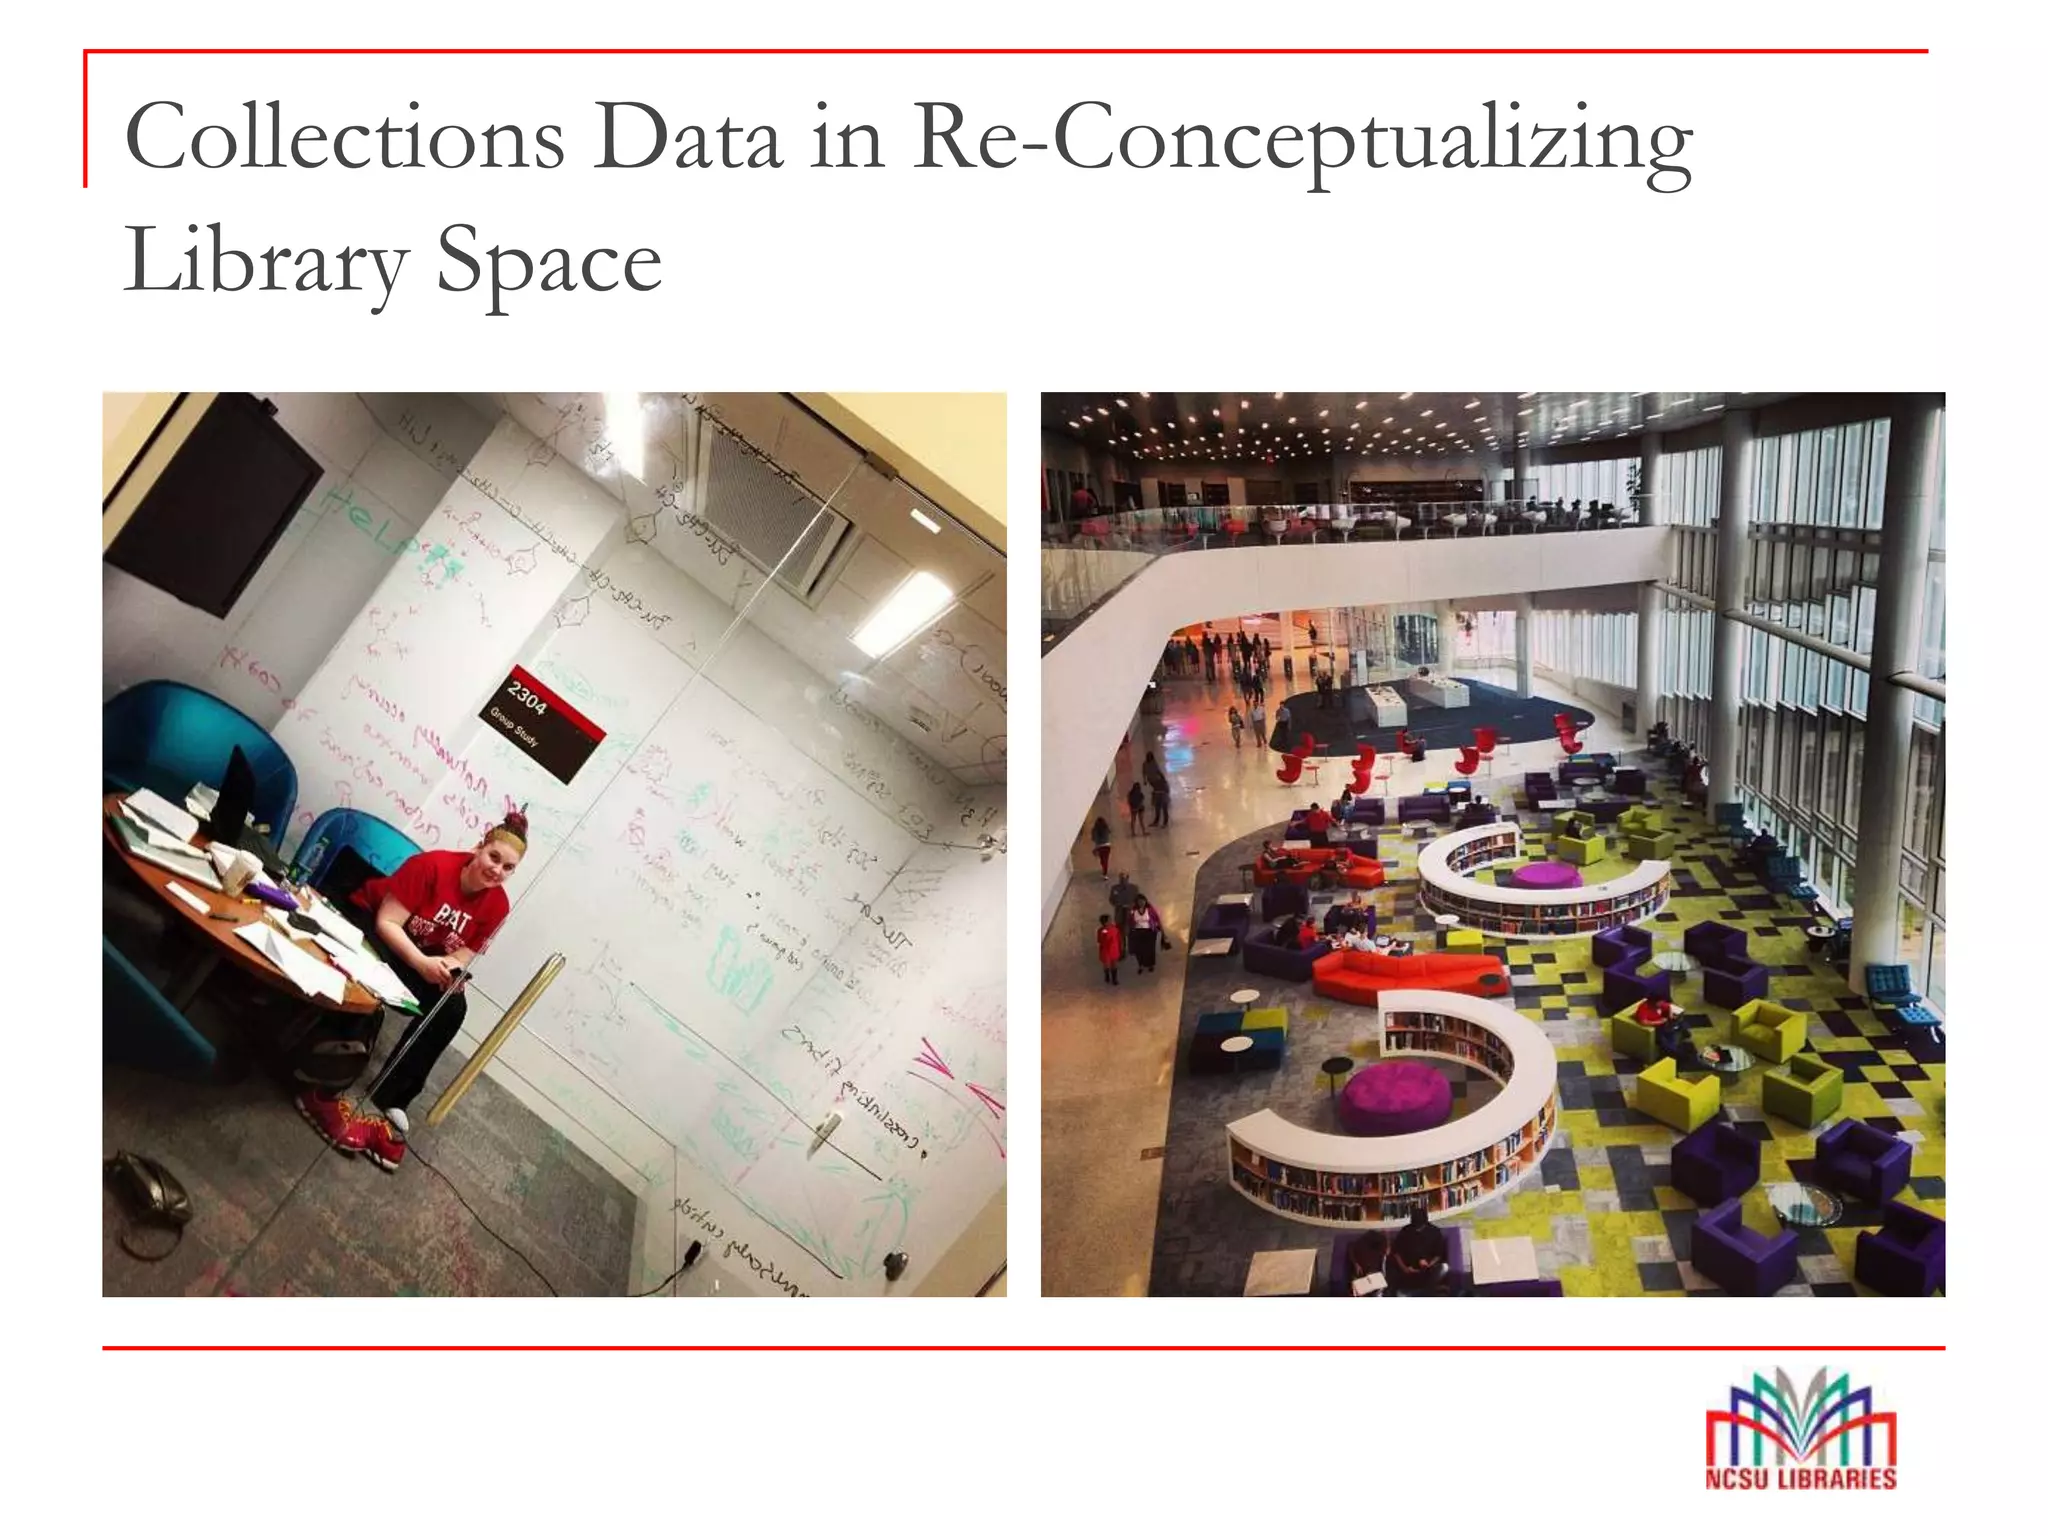
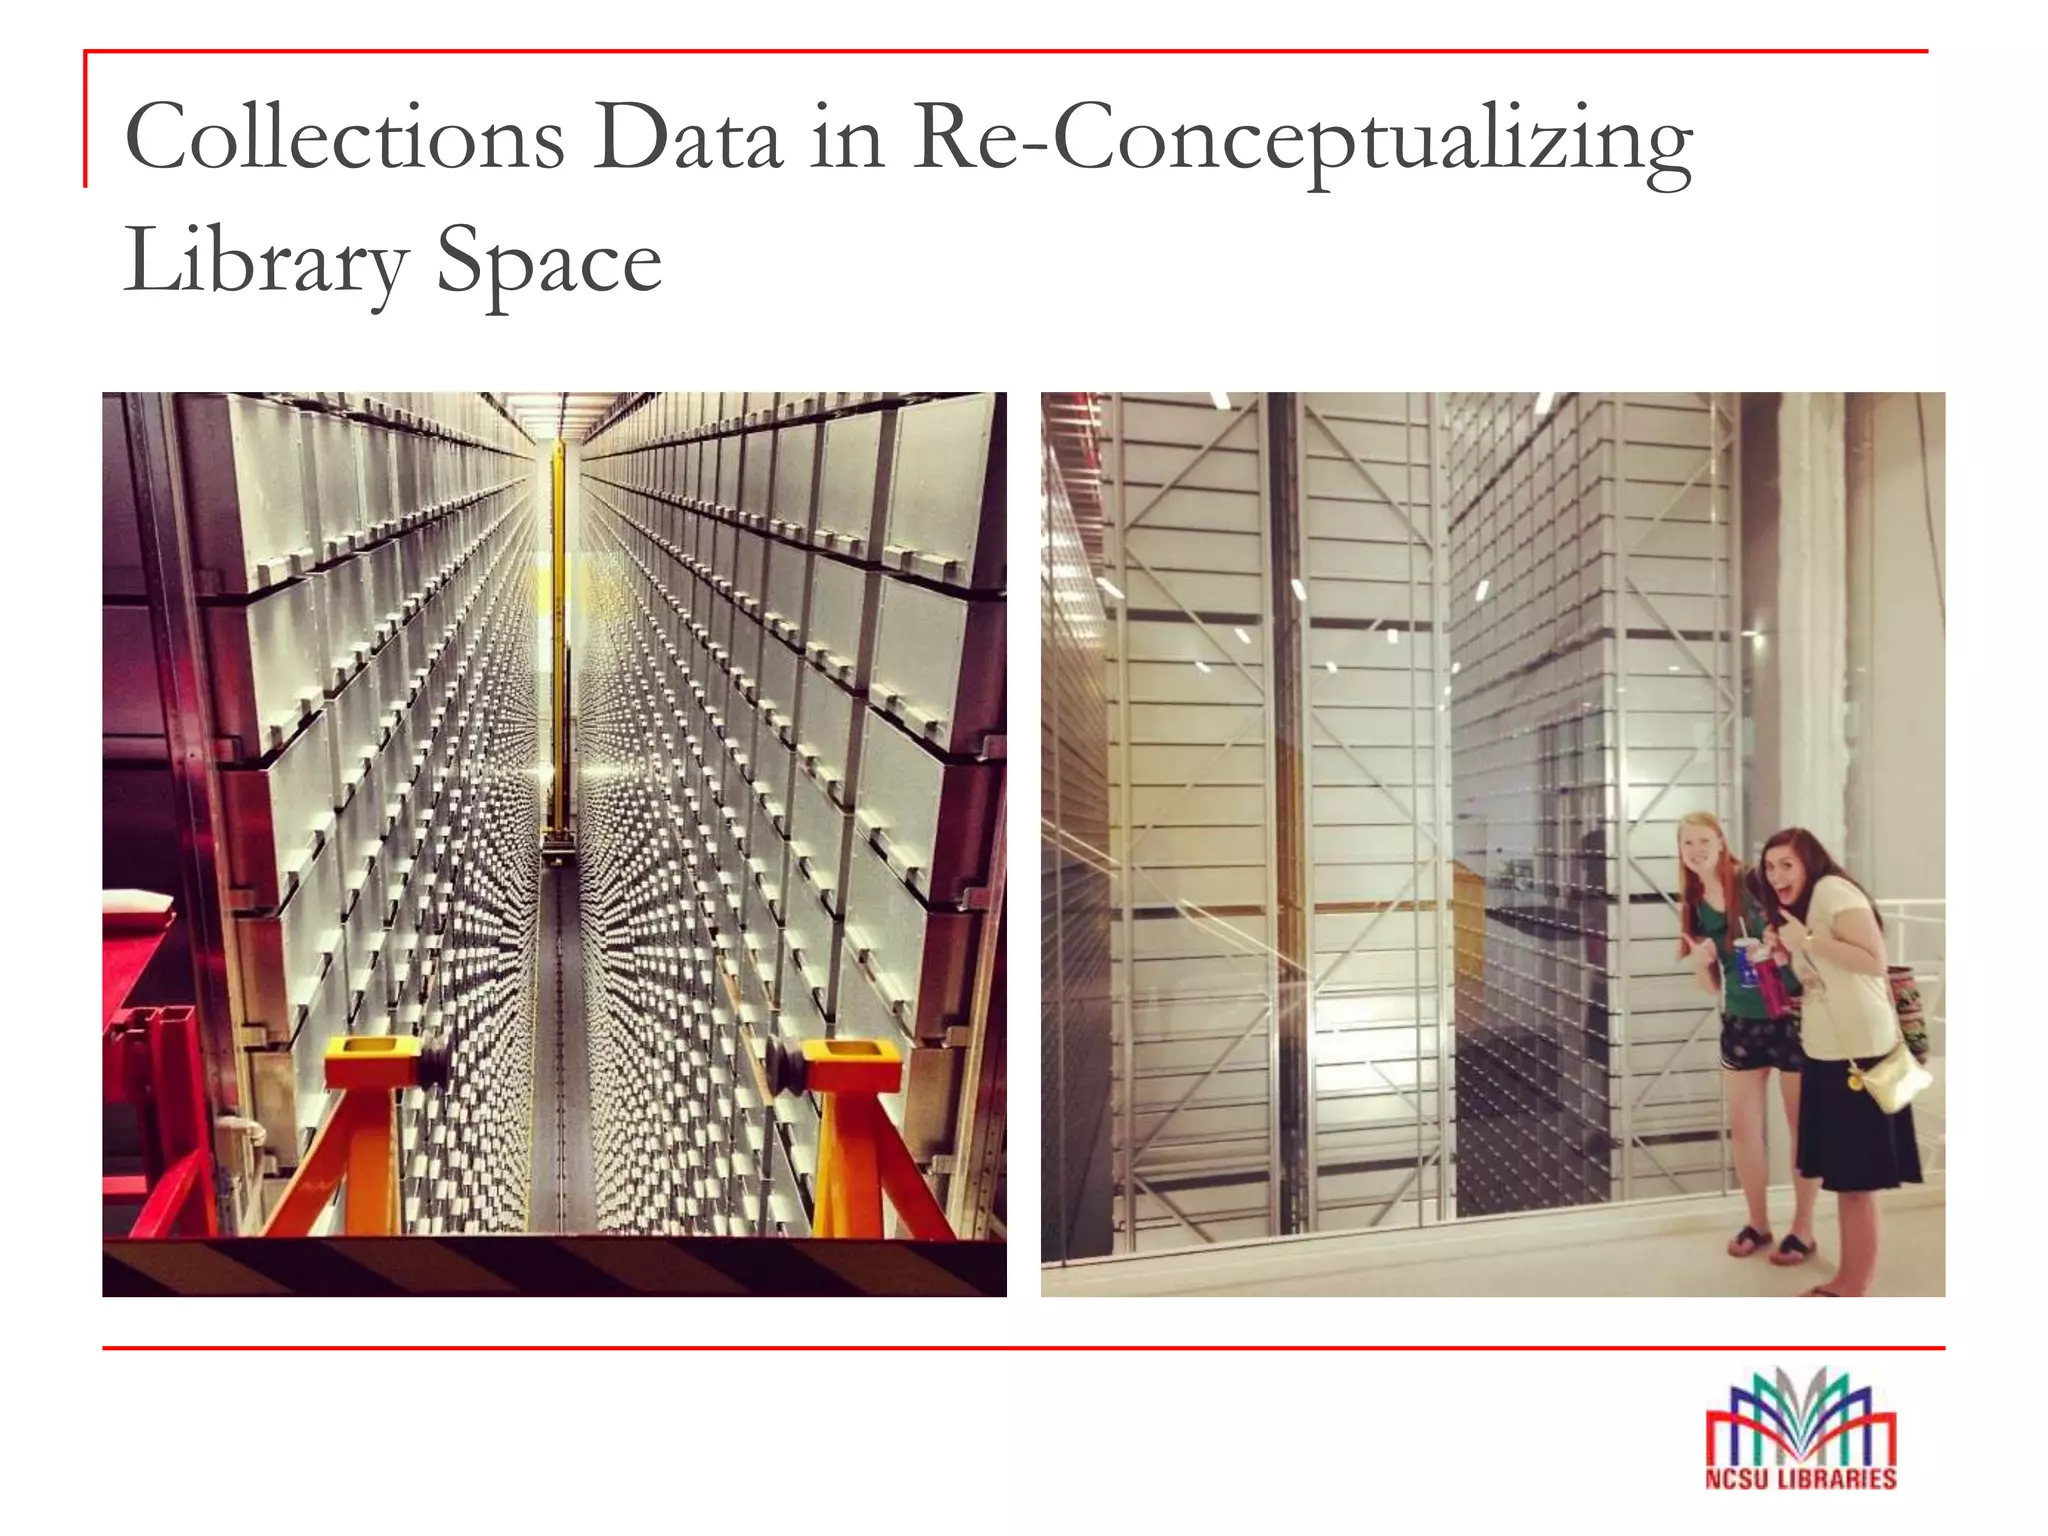
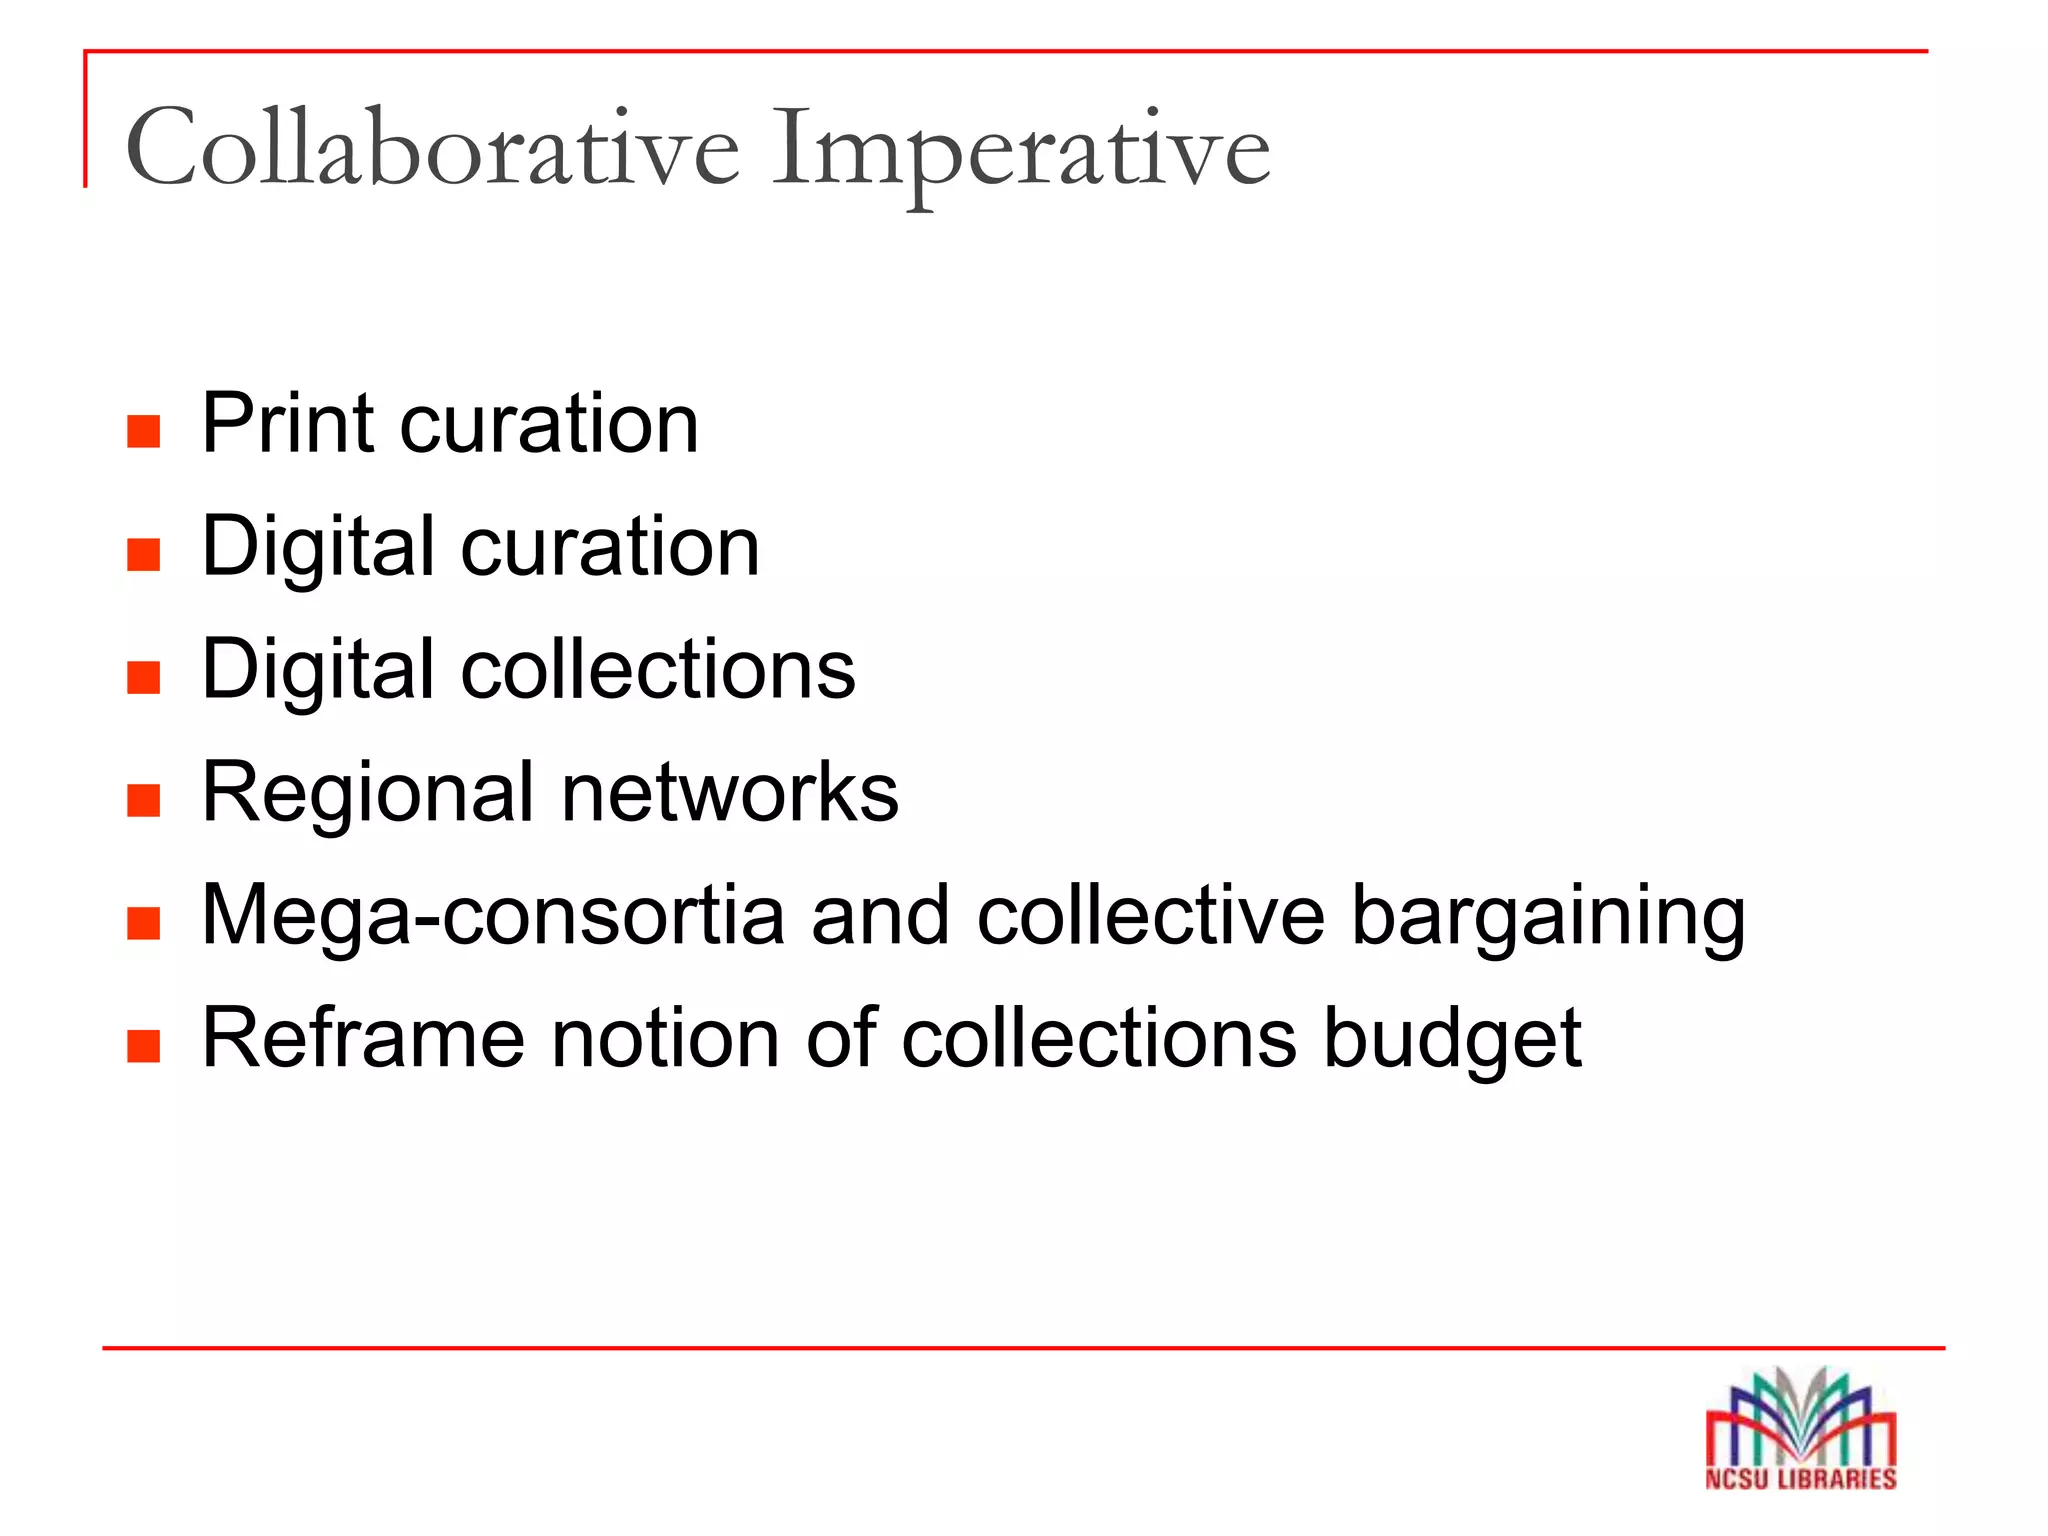

This document discusses how libraries can transition from traditional supply-driven collection models to more demand-driven, data-driven models that are more sustainable. It argues that usage data and analytics should be used more in collection decisions to lower costs and better meet user needs. Specific strategies mentioned include analyzing print and e-book usage patterns, using data to inform space planning, and collaborating through resource sharing networks. Challenges discussed include resistance to change and accounting for niche areas. The document advocates growing analytical skills, experimenting, and using data to make collections more vital to researchers.


