SlideShare a Scribd company logo
1 of 48
Download to read offline
®                    Oilseed Report                                                                               First year - No 1 / 26 April 2012 - English version


stratégiegrains           •	 EU rapeseed production revised down to 17.6 Mt following winter losses
                          •	 Very tight EU rapeseed market for remainder of 2011/12 – 2012/13: rapeseed stocks set to
                             fall despite 1 Mt decline in crush volume; world export availability expected in decline
                          •	 Sunseed production and crush volumes expected very high in EU in 2011/12 and 2012/13 –
                             balanced situation for both crop years
                          •	 Global soybean stock forecast to decline in 2011/12 – further reduction expected for
                             2012/13 despite sharp growth in production
                          •	 Demand for meals in 2011/12 expected down in EU – no growth forecast for 2012/13
                          •	 EU vegetable oil supply revised down sharply for 2012/13: EU biodiesel production revised
                             down to 10.4 Mt

                                                                                                                    Production	                3
                                       Rapeseed 2011/12                               2012/13                           Oilseed rape 3
                                          July-June                                  as of    as of                     Sunflower and soybean 5
                                                                                 27/03/12 26/04/12
                                             carry-in stock             1.3            1.2      1.3                 European Union Rapeseed balances	                                   6
                                               production              19.1          19.1     17.6                      Supply and internal demand 6
                                                   imports              3.0            3.1      3.1                     Prices comparison dated 20/04/2012  9
                                              domestic use             22.1          22.4     21.0                      Intra-EU rapeseed trade 9
                                                    exports             0.1            0.0      0.0                     World rapeseed market 11
                                           carry-out stock              1.3            1.0      1.0                     Analysis of ending stocks and conclusion 13
                                  surplus / required stock             -0.4           -0.7     -0.6
                                                                                                                    European Union Sunseed balances	 5
                                                                                                                                                   1
                                                                                                                        Supply and internal demand 15
                                                                                                                        Intra-EU Sunseed trade 17
                                      Sunflower 2011/12                               2012/13                           World sunseed market 19
                                     August-July                                     as of    as of                     Analysis of ending stocks and conclusion 21
                                                                                 27/03/12 26/04/12
                                             carry-in stock             0.7            0.8     0.7                  European Union soybean balances	22
                                               production               8.3            8.1     8.1                      Supply and internal demand 22
                                                   imports              0.4            0.4     0.4                      intra-EU trade 24
                                              domestic use              8.0            7.8     7.9                      World soybean market 26
                                                    exports             0.6            0.6     0.6                      Analysis of ending stock and conclusion 29
                                           carry-out stock              0.7            0.9     0.7
                                  surplus / required stock              0.1            0.3     0.1                  EU vegetable oil market	 30
                                                                                                                        Prices comparison 30
                                                                                                                        Rape oil supply and demand in the EU 30
                                                                                                                        Sun oil supply and demand in the EU 33
                                         Soybean 2011/12                              2012/13                           Soy oil supply and demand in the EU 34
                          October-September                                          as of    as of                     Palm oil supply and demand in the EU 35
                                                                                 27/03/12 26/04/12                      Vegetable Oils - global supply and demand 35
                                             carry-in stock             1.4            1.2      1.3                     EU vegetable oil market: conclusion 38
                                               production               1.3            1.2      1.2
                                                   imports             11.7          11.9     12.0                  EU meal market	39
                                              domestic use             13.1          13.5     13.7                      Supply of oilmeals in the EU 39
   strategie-grains.com                             exports             0.0            0.0      0.0                     EU industrial feed production 40
                                           carry-out stock              1.3            0.8      0.8                     Consumption in animal feeds in 2011/12 41
                                  surplus / required stock              0.4           -0.2     -0.2                     Consumption in animal feeds 2012/13 43
                                                                                                                        World soymeal market and conclusion 45


                                   The next issue of Stratégie grains Oilseed Report will be available on 30 May 2012
                           © 2012 Tallage SAS. All rights reserved. No part of this publication may be reproduced, photocopied, stored in a retrieval system or transmitted, in any form or by
                           any means, nor otherwise circulated without the prior consent of the publisher. Action will be taken against any person, company or organisation infringing copyright.
graphs and tables
  2
Graphs
Graphic 1.1: variation in water balance compared with the norm for period: September 1 2011 through April 19 2012 4
Graphic 1.2: Rapeseed production in the EU27 (Mt) 4
Graphic 1.3: Sunseed production in the EU27 (Mt) 5
Graphic 1.4: Soybean production in the EU27 (Mt) 5
Graphic 2.1: rapeseed crush demand in the EU (Mt) 6
Graphic 2.2: rapeseed crush margins in Hamburg (€/t seeds) 8
Graphic 2.3: comparison between rapeseed and sunseed crush margins in France (€/t seeds) 8
Graphic 2.4: Euronext prices (€/t) 9
Graphic 2.5: world rapeseed prices (US $/t) 11
Graphic 3.1: human/industrial demand for sunseed in the EU27 (Mt) 15
Graphic 3.2 : Sunseed crush margin in France (€/t) 17
Graphic 3.3: world sun seed prices (FOB in US $/t) 19
Graphic 4.1: demand for soybean for crush usage in the EU27 (Mt) 22
Graphic 4.2: world demand for soybean (kt) 27
Graphic 4.3: world soybean prices (CBOT, $/bushel) 28
Graphic 4.4: soybean/maize price ratio in the USA for November/December (CBOT) 28
Graphic 5.1: biodiesel and vegetable oil prices (€/t) 31
Graphic 6.1: changes in cattle numbers in the EU 41
Graphic 6.2: changes in milk collection in the EU compared with quota 41
Graphic 6.3: changes in pig numbers in the EU 41
Graphic 6.4: soy/wheat price ratio in France 42
Graphic 6.5: prices of soymeal, rapemeal and sunmeal in the EU (€/t) 43
Tables
Table 1.1: Oilseed rape planted areas, yields and production 3
Table 1.2: Sunflower planted areas, yields and production 5
Table 1.3: Changes to main arable crop areas (EU27) 4
Table 2.1: breakdown of EU rapeseed imports by country of origin 6
Table 2.2: rapeseed balance sheet July-June 2012/13 and 2011/12 (kt) 7
Table 2.3: rapeseed prices in main EU countries dated 20/04/2012 9
Table 2.4: intra-EU rapeseed trade 2012/13 and 2011/12 (kt) 10
Table 2.5 estimated rapeseed balance sheets for Ukraine, Canada and Australia (July/June) 11
Table 2.6: world rapeseed/canola balance sheet (July/June) 12
Table 2.7: world import requirements and export forecasts (Mt) — July-June 13
Table 3.1: EU sunseed imports by origin (kt) 15
Table 3.2: EU sunseed balance sheet, August-July 2012/13 and 2011/12 (kt) 16
Table 3.3: intra-EU sunseed trade 2012/13 and 2011/12 (kt) 18
Table 3.4: world sunseed supply and demand balance sheet – August-July (Mt) 19
Table 3.5: sunseed balance sheets for Ukraine, Russia, Moldova, and Argentina – August-July 19
Table 3.6: estimated sun seed import requirements and export volumes (Mt) – August–July crop year 20
Table 4.1: EU soybean imports by country of origin (kt) 22
Table 4.2: EU27 soybean balance sheet October-September 2012/13 and 2011/12 (kt) 23
Table 4.3: intra-EU soybean trade 2012/13 and 2011/12 October-September (kt) 25
Table 4.4: world soybean balance sheet October-September (Mt) 26
Table 4.5: FOB prices for main soybean origins dated 19/04/2012 26
Table 4.6: soybean balance sheets for main exporting and importing countries - October-September (Mt) 27
Table 4.7: soybean balance sheets for Ukraine and Russia - October-September (Mt) 27
Table 4.8: monthly soybean imports for China (Mt) 27
Table 5.1: vegetable oil prices in Rotterdam on 20/04/12 ($/t) 30
Table 5.2: supply and demand balance sheet of rape oil in 2010/11, 2011/12 and 2012/13 (Mt) –July/June 31
Table 5.3: supply and demand balance sheet for biodiesel in 2010/11, 2011/12 and 2012/13 (Mt) –July/june 31
Table 5.4: supply and demand balance sheet for sun oil in 2010/11, 2011/12 and 2012/13 (Mt) –August/July 33
Table 5.5: supply and demand balance sheet for soy oil in 2010/11, 2011/12 and 2012/13 (Mt) –October/September 34
Table 5.6: supply and demand balance sheet for palm oil in 2010/11, 2011/12 and 2012/13 (Mt) –July/June 35
Table 5.7: world supply and demand for the main oils (Mt) 36
Table 5.8: FOB prices of the main oils ($/t) 37
Table 5.9: EU supply and demand balance sheet for the 4 main vegetable oils * 2010/11, 2011/12 and 2012/13 (Mt) 38
Table 6.1: soymeal imports in the EU27 (Mt) 39
Table 6.2: prices of the main soymeal and sunmeal origins dated 23/04/12 ($/t) 39
Table 6.3: changes in industrial animal feed production in EU countries xxx voir période xxx 40
Table 6.4: demand for soymeal, rapemeal and sunmeal in industrial animal feeds* and on-farm feeds* (October-September) 42
Table 6.5 EU soymeal balance sheets – October-September 2012/13 and 2011/12 (kt) 43
Table 6.6: EU rapemeal balance sheets – July-June 2012/13 and 2011/12 (kt) 44
Table 6.7: EU sunmeal balance sheets – August-July 2012/13 and 2011/12 (kt) 44
Table 6.8: World soymeal balance sheets – October-September 2010/11, 2011/12, 2012/13 (Mt) 45
         S   t r a t é g i e    g r a i n s    — O      i l s e e d    R   e p o r t     1 — 26 A             p r i l   2012
EU   production of rapeseed       &   sunseed
                                                                                                                                                   3

                                                        Production
•	 Winterkill and damage on oilseed rape revised up sharply in Germany, Poland and France since last
   month
•	 Rapeseed yield revised down in main producer countries due to frost and drought in the southeastern
   EU countries
•	 Rapeseed production revised down sharply (-1.5 Mt) to 17.6 Mt in 2012
•	 Large fall in sunflower area in Spain due to drought, but increase in several countries due to
   replanting of lost winter crop fields
•	 Sunseed production still expected at 8.1 Mt in 2012
•	 Soybean production expected down slightly compared with 2011/12

Oilseed rape
Rapeseed production now expected sharply down on previous years
Crop year 2012/13                                oilseed rape.                                       in Romania, Bulgaria and Hungary and
At the start of the crop year, good conditions   Meanwhile in the north EU countries, rains          prevented plant emergence in some fields.
                                                 at planting time in Germany and Denmark             A mild autumn in Europe in most countries
at planting time and attractive margins
                                                 caused a decline in oilseed rape acreage.           allowed the rapeseed plants to develop more
in France, UK and Poland generated an            In the southeast EU, a severe autumn drought        quickly than normal and raised the possibility
increase in oilseed rape plantings. Farmers      restricted oilseed rape plantings. This drought     that the plants would exit the rosette stage too
in the central EU countries also planted more    continued through the start of the winter           early. During this stage of the growth cycle, the
                                    Table 1.1: Oilseed rape planted areas, yields and production
                                    Area (kha)                          Yield (t/ha)                               Production (kt)
                                                                                                                                              ∆ / prev.
                          2009/10 2010/11 2011/12 2012/13 2009/10 2010/11 2011/12 2012/13 2009/10 2010/11 2011/12 2012/13
                                                                                                                                               month
            Germany         1471     1461    1328     1280      4.28      3.90      2.94      3.38      6301      5697      3904      4324        -466
         Belgium-Lux          14       16      17       17      4.17      3.83      4.29      4.04        60        61        73        69           0
            Denmark          163      167     151      101      3.91      3.48      3.36      3.63       638       580       508       366           0
                 Spain        22       21      31       32      1.60      1.82      1.98      1.89        35        38        62        61           0
                France      1481     1465    1556     1528      3.77      3.29      3.45      3.19      5589      4815      5368      4874        -571
               Greece          4        8       7        7      1.50      1.50      1.50      1.50         6        12        10        10           0
               Ireland         6        8       9       10      3.76      3.51      4.10      4.02        24        28        35        38           0
                  Italy       25       20      19       16      2.04      2.47      2.34      2.45        50        50        44        39           0
         The Netherl.          3        3       2        2      4.54      4.38      3.44      4.05        12        12         7         8           0
             Portugal          0        0       0        0                                                 0         0         0         0
        United Kingd.        570      642     705      761      3.35      3.47      3.91      3.52      1912      2230      2756      2682         121
               Austria        57       54      53       53      3.01      3.17      3.35      3.29       171       171       179       173           0
              Finland         81      158      91       79      1.73      1.13      1.26      1.38       140       179       115       109         -19
              Sweden          98      109      99      106      3.04      2.57      2.70      2.65       298       280       266       281           0
               Poland        810      946     827      713      3.08      2.36      2.23      2.38      2497      2229      1847      1700        -404
             Hungary         261      259     233      171      2.41      2.05      2.26      2.20       630       531       527       377         -42
       Czech Republic        355      369     373      386      3.18      2.83      2.80      2.92      1128      1042      1046      1128         -59
              Slovakia       166      164     145       96      2.32      1.97      2.43      2.28       387       322       353       218         -11
               Estonia        82       98      89       88      1.66      1.33      1.61      1.70       136       131       144       149         -26
                Latvia        93      111     121      119      2.19      2.05      1.81      2.07       205       226       219       246           0
            Lithuania        192      252     253      241      2.17      1.65      1.81      1.82       416       417       458       439           0
              Slovenia         4        6       5        6      2.23      2.68      2.92      2.58        10        16        14        15           0
        Cyprus/Malta           0        0       0        0                                                 0         0         0         0
            Romania          442      506     384       54      1.59      1.95     1.73      1.51        702       986       664        81          -5
              Bulgaria       108      186     219       95      2.17      2.93     2.37      2.17        235       545       519       207         -55
               EU 27        6509     7027    6717     5959      3.32      2.93     2.85      2.95      21580     20597     19119     17593      -1539


        S   t r a t é g i e        g r a i n s   — O     i l s e e d      R   e p o r t      1 — 26 A                p r i l     2012
EU   production of rapeseed         &   sunseed
   4
plants have a high degree of resistance           Graphic 1.1: variation in water balance                March. There was some rainfall in
to the cold, but once grown out of it,             compared with the norm for period:                    the first half of April, but most EU
they are more vulnerable. The risk                September 1 2011 through April 19 2012                 countries are currently suffering
of frost damage and winterkill was                                                                       from a low to record-low water
therefore higher than normal even                                                                        balance (see graphic 1.1). Rainfall
as soon as winter started.                                                                               levels in the coming weeks will need
Freezing conditions finally arrived                                                                      to be closely monitored. In central
at the end of January. With little or                                                                    Europe, the drought has coincided
no snow in much of east and central                                                                      with very sharp temperature swings
Europe, there was significant damage                                                                     between sub-zero temperatures at
to the crops. In Bulgaria and Romania,                                                                   night and positive temperatures
the depth of the snow blanket varied                                                                     during the day. This phenomenon
                                                                                                         ended in the week of April 16-20 as
sharply from place to place because of
                                                                                                         temperatures began to increase. This
extremely high winds. The oilseed rape
                                                                                                         kind of weather scenario during the
plants in these countries were already
                                                                                                         spring (rains following severe drought)
in a vulnerable condition because of
                                                                                                         could cause an increased risk of disease,
the dry conditions at planting time                                                                      notably rapeseed blackspot disease
and hence were less able to resist the                                                                   (Alternaria). This situation will need
cold.                                                                                                    to be closely monitored.
With the resumption of plant growth                                                                      With the oilseed rape plants currently
in most rapeseed-growing countries,                                                                      flowering in most EU producer
since March we have gradually got                                                   Source: MARS JRC countries, weather conditions are
more accurate picture of winterkill/                                                                     at present not ideal for pollination
crop damage:                                       Graphic 1.2: Rapeseed production in because temperatures are too low. However,
	 Romania and Bulgaria – according to                          the EU27 (Mt)                   given the rapeseed plants’ good capacity for
     current estimates, respectively 80 % and                                                   recovery, it is too early to further decrease our
     60 % of winter rapeseed acreage has been                                                   yield forecasts as a result of this.
     impacted since this year’s crop was planted;                                               We currently estimate oilseed rape area
	 Slovakia - 40 % of winter rapeseed                                                           in the EU at 6 Mha, down 0.8 Mha from
     plantings will no longer be harvested,                                                     the level of 2011/12 (this will be the lowest
     either due to the autumn drought of the            20,6           19,1                     acreage since 2006).
                                                                                    17,6
     freezing spell;                                                                            We currently expect EU rapeseed yield at 2.95
	 Poland – damage is estimated at 25 % of                                                      t/ha (2.85 t/ha in 2011/12). Yield in many
     acreage (compared with 9 % in 2011/12);                                                    countries has been reduced to take into account
	 Czech Republic - damage is estimated at 8                                                    the fields which were impacted by the freezing
     % of acreage;                                                                              conditions but will not be replanted and for
	 Austria - 6 % of acreage will be replanted;        2010/11 2011/12 2012/13                   which yield potential is therefore reduced. We
	 Germany – winterkill will force farmers to
                                                                                                currently expect rapeseed production in the
     replant 5 % of winter rapeseed acreage;          Bourgogne and Champagne-Ardenne (10 EU at 17.6 Mt (19.1 Mt in 2011/12). This will
                                                      % replanted in each).                     be the lowest level since the harvest of 2006.
	 France – around 3 % of acreage will need
                                                                                                If the weather continues to be very unfavourable
     to be replanted. Damage is mostly centred The weather has been extremely dry across
                                                                                                for oilseed rape development, yield could fall to
     on Lorraine (20 % to be replanted), Europe since the end of winter and through
                                                                                                2.81 t/ha, as in 2007/08, with EU production
                 Table 1.3: Changes to main arable crop areas (EU27)                            at 16.7 Mt. By contrast, if yields were reasonable
                                                                                                (with good conditions from now until harvest
                                                          commercial crop years
                  areas (kha)                                                                   time), it might still be possible to obtain a yield
                                                   2009/10    2010/11       2011/12    2012/13
Total cereals                                       58 230      55 360       55 570     55 780  of 3 t/ha and a harvest of 18 Mt.
Total oilseeds (included crops grown on set-aside)           11 210       11 670        11 920         11 150   N.B: Subscribers to the Oilseed crop module
Total protein crops                                           1 190        1 510         1 390          1 250
                                                                                                                on our website www. strategie-grains.com may
Silage                                                        5 310        5 530         5 730          6 050
                                                                                                                consult our full area, yield and production
EU set-aside & fallow land (non food crops exclud.)           6 050        6 670         5 940          6 190
                                  of which EU 15 set-aside    4 060        4 330         3 990          4 240
                                                                                                                estimates with historical database and forecasts
Sugar beet                                                    1 600        1 580         1 630          1 650   by country and crop year.
Total area cultivated + set-aside *                          83 590       82 320        82 180         82 070

             S   t r a t é g i e           g r a i n s       — O      i l s e e d   R    e p o r t         1 — 26 A             p r i l     2012
EU   production of rapeseed        &   sunseed
                                                                                                                                                    5
Sunflower and soybean
Sunflower area expected to increase again in 2012/13
Crop year 2012/13
                                                    Graphic 1.3: Sunseed production in                   Graphic 1.4: Soybean production in
Like the other spring crops, sunflower area                   the EU27 (Mt)                                        the EU27 (Mt)
is expected to increase because farmers will
replant winter crop fields lost or destroyed
because of drought or cold with spring crops.
We currently estimate that sunflower area will
increase from 4.2 Mha in 2011 to 4.3 Mha in
2012, which will be the highest level since the                           8,3              8,1                                 1,3
                                                          6,9                                                   1,2                       1,2
harvest of 2003.
The countries where sunflower area will
increase most sharply are Romania (+150
kha), Bulgaria (+30 kha), Slovakia (+ 30 kha),         2010/11         2011/12        2012/13                2010/11         2011/12   2012/13
Czech Republic (+20 kha) and France (+15
kha). In Spain, the current drought is forcing     We currently expect sunseed yield in the              place in France and Spain and in the southeast
farmers to leave fields unplanted instead of       EU at 1.9 t/ha (1.97 t/ha in 2011/12), with           EU countries.
sowing sunflower, because expected sunseed         production at 8.1 Mt (8.3 Mt in 2011/12).             We estimate soybean area in the EU at 430
yields are too low to definitively guarantee a     The increase in acreage will not be sufficient        kha (down 20 kha compared with 2011/12).
profit. Sunflower area is therefore expected       to offset the relative fall in yield compared with    With yield estimated at 2.8 t/ha (2.92 t/ha in
sharply down on last year (-170 kha) in Spain,     last year’s excellent results.                        2011/12), the harvest is expected at 1.2 Mt in
at 680 kha.                                        Sunflower plantings are currently taking              2012/13 (1.3 Mt in 2011/12).


                                       Table 1.2: Sunflower planted areas, yields and production
                                      Area (kha)                           Yield (t/ha)                               Production (kt)
                                                                                                                                                ∆ / prev.
                            2009/10 2010/11 2011/12 2012/13 2009/10 2010/11 2011/12 2012/13 2009/10 2010/11 2011/12 2012/13
                                                                                                                                                 month
               Germany          24       25      27        29      2.41       1.89      1.99      2.17       57         47       53      64           12
                   Spain       851      698     858       682      1.02       1.22      1.21      1.18      870        850     1035     804         -177
                  France       725      695     741       756      2.37       2.36      2.54      2.47     1720       1641     1885    1867           44
                 Greece         24       64      66        69      1.20       2.53      1.69      1.62       28        161      112     112            0
                    Italy      124      101     118       114      2.26       2.12      2.32      2.31      280        213      274     262            9
                Portugal        21       14      15        15      0.52       0.54      1.02      0.69       11          8       15      10            0
          United Kingd.          1        1       1         1      2.00       2.00      2.00      2.00        2          2        2       2            0
                 Austria        26       25      26        26      2.74       2.62      2.83      2.72       71         67       74      71            0
                 Poland          2        2       2         2      1.78       1.52      1.78      1.78        4          3        4       4            0
               Hungary         535      502     574       585      2.35       1.93      2.38      2.40     1256        970     1368    1406            0
         Czech Republic         26       27      29        51      2.38       2.11      2.48      2.39       61         57       71     123           55
                Slovakia        83       83      90       107      2.26       1.81      2.45      2.38      187        150      219     255           32
               Romania         766      791     985      1132      1.43       1.60      1.82      1.57     1098       1263     1792    1779           23
                Bulgaria       662      648     682       709      1.89       2.19      2.03      1.95     1250       1419     1385    1381            0
          oth. Countries         0        0       0         0      1.45       2.34      2.61      1.84        0          0        1       1            0
                 EU 27        3869     3676    4213      4281      1.78       1.86      1.97      1.90     6896       6851     8290    8140           -2


          S   t r a t é g i e        g r a i n s   — O      i l s e e d      R   e p o r t        1 — 26 A              p r i l      2012
European Union Rapeseed          balances
  6

                      European Union Rapeseed balances
•	   EU rapeseed production expected sharply down in 2012 to 17.6 Mt
•	   Crush volume expected down sharply in 2012/13 –rapeseed imports limited by lack of global availability
•	   EU rapeseed stock expected down to 0.9 Mt and global stock to 4.9 Mt at end-2012/13
•	   Extremely tight outlook for new crop year

Supply and internal demand
2011/12: crush volume in EU expected at 21.5 Mt – 2012/13: production and
crush activity expected down sharply
Crop year 2011/12                                   compared with 2010/11.                            crush volume in the EU is estimated down
                                                    Rapeseed imports from Ukraine are currently       to 21.5 Mt in 2011/12 (-1 Mt compared with
Production                                          forecast at 960 kt (-50 kt compared with last     2010/11). Since the start of crop year 2011/12,
EU rapeseed production in 2011 remains              month and -250 kt compared with 2010/11).         the crush margin average in Hamburg is slight-
estimated at 19.1 Mt. It has increased very         Rapeseed imports from other Black Sea coun-       ly above 20 €/t, which is also the case on the
slightly (+20 kt) since last month due to an in-    tries (Russia, Moldova and Kazakhstan) are        last quarter of the campaign. There are thus
crease for production in France.                    expected up at 125 kt (+35 kt compared with       around 10 €/t below last year, and about 20 €/t
Most of the reduction compared with 2010            last month; +55 kt compared with 2010/11).        below 2009/10.
(-1.5 Mt, see Production) corresponds to small-     We forecast a sharp rise in imports from Aus-     Likewise, rapeseed crush margins in Rouen are
er harvests in Germany (-1.8 Mt), Poland (-380      tralia to 1.63 Mt (+0.1 Mt compared with          currently low, and have on occasion dropped
kt), north EU countries (-150 kt in total) and      last month; +0.6 Mt compared with last year).     as low as 30 €/t (on crushed seed) and are at
Romania (-320 kt); these falls are partly offset    Rapeseed exports recorded from Australia          around 40 €/t averaged for the entire crop year,
by increases in France and Britain (+550 kt and     are high (around 300 kt per month since De-       which is 10 €/t below the averaged value in
+530 kt respectively).                              cember), and should arrive in 2011/12. This       2010/11. The current margin is around 30 €/t
                                                    estimate has an increase potential if shipments   spot/near-term.
N.B: Subscribers to the “EU crop – Oilseed”                                                           We have increased estimated crush volume
                                                    arrive more quickly than expected.
module on our website www.strategie-grains.com                                                        in the EU by 50 kt since last month; crush is
                                                    Canadian rapeseed exports to the EU are also
may consult our full area, yield and production                                                       revised up 180 kt in the Netherlands (to 1.16
                                                    forecast up in 2011/12, although on a smaller
estimates with historical database and forecasts    scale, to 275 kt (no change since last month,     Mt) but this is partly offset by reductions in
by country and crop year.                           +60 kt vs. 2010/11). Canadian rapeseed can-       Germany (-100 kt to 7.3 Mt) and Spain (-20
Imports                                             not be used in all EU countries because it com-   kt to 90 kt). These adjustments are made to
Our forecasts now include the latest available      prises GM content, which limits its access to     reflect the latest statistics for crush demand, oil
                                                    the EU market. Portugal and France are the        production and/or imports.
customs statistics for crop year 2011/12 (Feb-
                                                    main importers of Canadian rapeseed: Por-         Industrial rapeseed usage is expected down
ruary 2012 for EU trade with third countries).
                                                    tugal had imported 150 kt as of February 29       in most other EU countries compared with
Given recorded imports shown in these sta-
                                                    2012 and we expect that the EU will import an     2010/11, most notably France (-465 kt to 4
tistics and current price spreads between EU
                                                    additional 95 kt from Canada by the end of the    Mt), Germany (-325 kt to 7.3 Mt) and Poland
rapeseed and other main export origins, EU
                                                    crop year. However, Canadian statistics do not    (-210 kt to 2 Mt). However, it is expected up
rapeseed imports from third countries are
                                                    show any exports to the EU since December;        in the Netherlands (+150 kt) and the United-
now forecast at 3 Mt in 2011/12, up 0.46 Mt
                                                    our estimate therefore has a decrease potential   Graphic 2.1: rapeseed crush demand
Table 2.1: breakdown of EU rapeseed                 in the event that exports do not pick up.                   in the EU (Mt)
   imports by country of origin                     Since last month, we have increased our fore-
               kt 09/10 10/11 11/12 12/13           cast for EU rapeseed imports (+90 kt), notably           22.5
         Ukraine 1371 1209 960 850                  for Germany to 350 kt and France to 370 kt
        Other CIS 328      69 125 300                                                                                        21.5
                                                    (+30 kt each); there are also smaller increases
         Australia 314 1035 1625 1525
                                                    (+10/15 kt) for the Netherlands (to 1 Mt) and                                            20.5
          Canada     95 216 275 400
           Others    39    46    51    40
                                                    Poland (to 280 kt).
            Total 2147 2575 3036 3115               Demand for industrial usage
          Source: Stratégie grains (based on data                                                         2010/11          2011/12          2012/13
                                                    Due to limited supply and low rape oil pro-
                                 from Eurostats)    duction margins (see graphic 2.2), rapeseed
          S   t r a t é g i e      g r a i n s      — O      i l s e e d     R   e p o r t      1 — 26 A              p r i l       2012
European Union Rapeseed                          balances
                                                                                                                                                                                                                           7
                                               Table 2.2: rapeseed balance sheet July-June 2012/13 and 2011/12 (kt)
                                                        imports                              grains exports                        animal consump.


                                                                                                                                                                 seeds, waste and
                                                                                                                                                                 overseas usage
July-June


                                       ex-farm sales


                                                                                                                                                                                                                       requirement
2012/13


                                                        from EU 27
                          production


                                                                                                                                            compound
                                                                                                            to non-EU
                                                                     from non-


                                                                                                                                                                                                                       free stock
                                       of which:


                                                                                                to EU 27


                                                                                                                                                                                                carry-out
                                                                                                                                                       on-farm


                                                                                                                                                                                       demand


                                                                                                                                                                                                            surplus/
              carry-in


                                                                                    supply


                                                                                                                                                                                                            deficit
                                                                                                                          crush
              stock


                                                                                                                                                                                                stock
                                                                                                                                    total


                                                                                                                                                       feed
                                                                                                                                            feed
                                                                     EU
     Ger.          319 4324             3508           2786            621        8050         406            6          7000      227         10       217              0           7639         411        -130        538
   Bel/L            77    69                            904            525        1576         392                       1100       10          0        10              0           1502          74         -10         85
    Den.            16   366                            324             37         743         154           0            501       60          0        60              0            714          29         -10         39
    Spn.            22    61                             31              0         114           5           0             90        0                                   0             95          20          10          7
Fra-new.           206 4874             4808            210            548        5839        1629          11           3984       47                                  60           5731         108        -200        306
    Gre.             0    10                              2             10          23           0                         20        0                                   0             20           3           0          2
       Irl.          4    38                              6              2          50          18                         29        0                                   0             47           3           0          2
      Ita.           2    39                             45              4          90          10            1            75        0                                   0             86           4           0          6
   Neth.           219     8                            484            846        1557         517            0           935       23                                   0           1476          81          10         72
     Por.           14     0                              5            194         212           1                        197        0                                   0            198          14           0         15
    U.K.           143 2682                             128             23        2976         715            1          2102       38           0        38             0           2857         119         -40        162
    Aust.           28   173               173          206              9         417          62            1           348        5           0         5             0            416           1         -30         27
     Fin.           15   109                            122             11         257           0            0           250        5           0         5             0            255           2         -20         19
   Swed.             7   281                             61              2         350          30            0           310        5           0         5             0            345           5         -20         24
     Pol.          106 1700                             163            216        2185         243            0          1880       17           0        17             0           2141          44        -100        145
   Hun.             10   377                            204             13         605         412            1           180        0                                   7            600           5         -10         14
   Cz.R.            37 1128                             107              3        1275         355            1           900        0                                   0           1256          20         -50         69
     Slk.           22   218                            138              7         385         289                         95        0                                   0            384           1         -10          7
     Est.            9   149                             48              1         208         137                         68        0           0         0             0            206           2           0          5
     Lat.            3   246                             45             22         314         197                        110        7           0         7             0            314           1         -10          8
     Lit.            9   439                             49             20         517         279                        235        0                                   0            514           3         -10         18
     Sln.            5    15                              8              1          29          24                          4        0           0         0             0             28           1           0          0
    Cyp.             0     0                              0              0           0           0                          0        0                                   0              0           0           0          0
    Mal.             1     0                              0              0           1           0                          0        0                                   0              0           1           0          0
   Rom.              7    81                            126              1         215         145           5             60        0                                   0            210           5           0          5
     Bul.            2   207                              2              0         211         185           1             19        0                                   0            205           6           0          1
  EU 27           1284 17593                           6205           3115       28197        6205          28          20491      444                                  67          27236         962        -630       1576


                                                        imports                              grains exports                        animal consump.
                                                                                                                                                                 seeds, waste and
                                                                                                                                                                 overseas usage
July-June


                                       ex-farm sales


                                                                                                                                                                                                                       requirement
2011/12


                                                        from EU 27
                          production


                                                                                                                                            compound
                                                                                                            to non-EU
                                                                     from non-


                                                                                                                                                                                                                       free stock
                                       of which:


                                                                                                to EU 27


                                                                                                                                                                                                carry-out
                                                                                                                                                       on-farm


                                                                                                                                                                                       demand


                                                                                                                                                                                                            surplus/
              carry-in


                                                                                    supply


                                                                                                                                                                                                            deficit
                                                                                                                          crush
              stock


                                                                                                                                                                                                stock
                                                                                                                                    total


                                                                                                                                                       feed
                                                                                                                                            feed
                                                                     EU


     Ger.          310 3904             3087           3534            348        8096         232           8           7311      227         10       217              0           7777         319        -240        562
   Bel/L           122    73                            891            620        1706         384           0           1230       15          0        15              0           1629          77         -20         95
    Den.             9   508                            192             70         779         169           0            509       85          0        85              0            762          16         -20         39
    Spn.             4    62                             51              0         116           4           0             90        0                                   0             94          22          20          7
     Fra.          220 5368             5302            352            370        6310        1930          16           4000       97         89          8            60           6103         206        -100        308
    Gre.             3    10                              2              9          25           0                         24        0                                   0             24           0           0          2
       Irl.         11    35                              5              3          55          25                         25        0                                   0             50           4           0          2
      Ita.           7    44                             31              6          88          11            0            75        0                                   0             86           2           0          6
   Neth.           214     7                            634            995        1850         451            0          1156       23                                   0           1631         219         130         89
     Por.           14     0                              7            237         258           1                        243        0                                   0            244          14         -10         19
    U.K.           121 2756                              62              2        2941         660            0          2080       58           0        58             0           2798         143         -20        160
    Aust.           34   179               179          182             12         408          69            0           305        5           0         5             0            379          28          10         23
     Fin.           21   115                            116             18         270           0            0           250        5           0         5             0            255          15           0         19
   Swed.            27   266                             41              2         336          13            0           311        5           0         5             0            329           7         -20         24
     Pol.           59 1847                             209            280        2396         275            0          1987       27           0        27             0           2290         106         -50        153
   Hun.              8   527                            371             14         920         698            1           205        0                                   7            910          10         -10         16
   Cz.R.            53 1046                             104              2        1204         270            0           897        0                                   0           1167          37         -30         69
     Slk.           17   353                            208             12         591         404                        165        0                                   0            569          22          10         13
     Est.            5   144                              1              1         150          81                         60        0           0         0             0            141           9           0          5
     Lat.           17   219                             51             27         314         204                        100        7           0         7             0            311           3         -10          8
     Lit.           16   458                             46              4         524         263                        252        0                                   0            515           9         -10         19
     Sln.           15    14                              3              1          33          22                          6        0           0         0             0             28           5           0          0
    Cyp.             0     0                              0              0           0           0                          0        0                                   0              0           0           0          0
    Mal.             1     0                              0              0           1           0                          0        0                                   0              0           1           0          0
   Rom.             20   664                            102              0         787         555          30            195        0                                   0            780           7         -10         15
     Bul.           19   519                              3              0         541         476          44             19        0                                   0            539           2           0          1
  EU 27           1346 19119                           7197           3036       30698        7197         100          21495      554                                  67          29413        1284        -380       1653
              S   t r a t é g i e                 g r a i n s                — O         i l s e e d                R   e p o r t            1 — 26 A                               p r i l       2012
European Union Rapeseed           balances
  8
Kingdom (+65 kt).                                  other countries, notably               Graphic 2.2: rapeseed crush margins in
                                                   the Netherlands (-180 kt),                     Hamburg (€/t seeds)
Other usage                                        Belgium (-95 kt) and Po- 100,0                     2009/10                     2010/11
No change this month: Rapeseed consump-            land (-65 kt, due to lower                         2011/12                     2012/13
tion for animal feed and other uses remains        imports from Ukraine).
forecast at 620 kt in 2011/12.                                                80,0
                                                   These estimates are
                                                   provisional and will be
Crop year 2012/13                                  amended as the year un-    60,0
                                                   folds to reflect harvest
Production
                                                   volumes and spreads be-    40,0
Rapeseed production in the EU27 is now
                                                   tween the prices of EU
expected at 17.6 Mt, sharply down on last
                                                   and other world rapeseed
year’s level (-1.53 Mt compared with 2011/12                                  20,0
                                                   origins.
- see Production). Since last month, we have
sharply reduced our harvest forecasts for          N.B: Subscribers to our
                                                                                    0,0
France (-570 kt to 4.88 Mt), Poland (-405 kt       online “EU trade with
                                                                                             jul     sept      nov        jan      march may
to 1.7 Mt) and Germany (-465 kt to 4.32 Mt).       third countries” module
These reductions mostly correspond to higher       can consult the full trade                          this month reduced projected crush volumes
than previously expected levels of winterkill/     breakdown for 2011/12 and 2012/13 (for each in Germany (-320 kt), Poland (-300 kt), France
damage. Production is still forecast higher than   origin and destination) at our website strategie-
                                                                                                       (-250 kt) and Belgium (-200 kt). Crush in Ro-
last year in the UK (+120 kt to 2.68 Mt). Since    grains.com”.
                                                                                                       mania (-25 kt) and Bulgaria (-20 kt) was again
last month, our estimate for rapeseed pro-
                                                   Demand for industrial usage                         revised down.
duction in 2012 has decreased by 1.54 Mt.
                                                   Rapeseed crush volume in the EU is ex-
Compared with 2011, rapeseed production is
                                                   pected down sharply in 2012/13 to 20.5 Other usage
expected sharply down in Romania (-585 kt),
                                                   Mt (-1 Mt compared with 2011/12). Our Rapeseed consumption for animal feed and
Bulgaria (-345 kt), France (-500 kt), UK (-195
                                                   first estimates for crush margins, based on cur- other uses is forecast lower than the level of
kt), Poland (-150 kt), Hungary (-150 kt) and
                                                   rently quoted prices (prices on futures markets 2011/12 at 545 kt, with decreases compared
Slovakia (-135 kt). After the unfavourable
                                                   and prices for oils and meals delivered in the with last year for France (-50 kt) and Denmark
weather impact of 2011, production is ex-
                                                   new crop year) indicate margins potentially at
pected up in Germany (+0.5 Mt to 4.4 Mt); it                                                           (-25 kt) due to sharply reduced availabilities.
                                                   around 30 €/t in France, 20-25 €/t in the UK,
should also increase slightly in Czech Republic
                                                   and in Germany between 15 €/t (in Neuss) Since last month, we have decreased other
(+80 kt) and Latvia (+25 kt).
                                                   and 20 €/t (in Hamburg). These levels are rapeseed usages in France (-100 kt) to reflect
Imports                                            around 10 €/t less than averaged values in the lower harvest forecast.
EU rapeseed imports in 2012/13 are expect-         2011/12 and in some places will not be suffi-
ed up slightly compared with 2011/12 (+80          cient to cover fixed produc-
kt) at 3.12 Mt (see table 2.1). Despite high       tion costs. Hence these crush       Graphic 2.3: comparison between rapeseed and
demand in the EU, this increase is fairly small    margins are extremely low.             sunseed crush margins in France (€/t seeds)
and stems from reduced supplies elsewhere in       The reduction in crush vol-
the world (see below: World market).               umes will impact several EU            150
Compared with 2011/12 (Table 2.1), we fore-        countries, notably Germany
                                                   (-300 kt), Netherlands (-220           130                                    rape
cast small reductions in imports from Australia
(-100 kt to 1.53 Mt) and Ukraine (-110 kt to       kt), Belgium (-130 kt), Po-            110
850 kt). The other Black Sea countries could       land (-105 kt) and Romania                                                    sun
                                                                                            90
export around 300 kt to the EU (+175 kt no-        (-135 kt).
                                                   Since last month, we have                70
tably from Belarus, assuming an end to export
restrictions in that country). Canada could also   sharply reduced our estimate             50
export slightly more in 2012/13 to the EU          for crush volume in the EU
                                                                                            30
(+125 kt to 400 kt).                               by 1.3 Mt; this reflects the
We forecast higher import volumes in Ger-          lower harvest forecast, high-            10
many (+275 kt to 620 kt) and France (+180 kt       er prices and the fall in mar-          -10
to 545 kt), but lower import volumes in most       gins (see above). We have


          S   t r a t é g i e     g r a i n s      — O      i l s e e d     R   e p o r t       1 — 26 A             p r i l     2012
European Union Rapeseed           balances
                                                                                                                                                         9

Prices comparison dated 20/04/2012 
New increase for rapeseed prices
Table 2.3 shows the main price changes since              On most market points
last month.                                                                                       Graphic 2.4: Euronext prices (€/t)
                                                          in the EU, the higher
In Germany, the C&F Hamburg price in-                     world soybean price and        525
creased sharply, rising almost 35 €/t since last          the sharp fall in expected     Rapeseed price                May 12
month to 505 €/t. The delivered Neuss and                 rapeseed       production      (€/t)
                                                                                                                       Aug 12
                                                                                         500
Rostock prices both rose by 18 €/t to 500 €/t             pushed prices upward in                                      Nov 12
and 492 €/t respectively.                                 conjunction with a new
Rapeseed prices in France also rose sharply: the                                         475
                                                          decline in the value of the
FOB Moselle price rose 22 €/t to 500 €/t and              euro against the dollar (to
the FOB Rouen price by 26 €/t to 488 €/t. In              1.31 $/€, down from 1.32       450
the UK, the rapeseed price also followed this             last month).
trend increasing by 25 €/t (+10 £/t with ster-            French and UK prices           425
ling up slightly against the euro). The Hungar-           evolved in the same
ian price rose slightly in Budapest (almost by 20         manner and hence the           400
€/t).                                                     competitive spread be-
 Table 2.3: rapeseed prices in main EU                    tween the two origins is       375
     countries dated 20/04/2012                           unchanged. Hungarian                Jul Aug Sep Oct Nov Dec Jan Feb Mar Apr May
                                                                                             2011 2011 2011 2011 2011 2011 2012 2012 2012 2012 2012
                          Mar. 23 Apr. 20    evolution    rapeseed’s competitive-
          c&f Hamburg      470.5   505.1    34.6   7,4%   ness improved slightly
delivered Neuss/Hamm       482.0   500.0    18.0   3,7%   again.                                          (+26.5 €/t), and 474.25 €/t for November
         rendu Rostock     474.0   492.0    18.0   3,8%   On Euronext on April 20 2012, rapeseed (+21 €/t). Contrary to last month, new crop
            Fob Moselle    477.0   500.0    23.0   4,8%   closed at 501.25 €/t for May (+20 €/t com- prices rose more sharply than old crop prices
        delivered Rouen    462.0   488.0    26.0   5,6%
                                                          pared with last month), 484.5 €/t for August and hence the inverse spread has narrowed.
         c&f South UK      469.9   493.2    23.3   5,0%

Intra-EU rapeseed trade
Trade volume in 2011/12 still expected at record high — 1 Mt reduction for
2012/13
Crop year 2011/12                                         are also forecast up in Hungary (+195 kt) and       Crop year 2012/13
Our forecasts now include the latest statistics           Slovakia (+70 kt), with increased tranship-         Based on our current harvest forecasts and esti-
published for crop year 2011/12 (February                 ment of east-EU rapeseeds to Germany. By            mates for industrial demand for rapeseeds (no-
2012 for France and Spain, and January 2012               contrast, rapeseed imports are forecast lower       tably for crush), we expect a 1 Mt reduction
for the other countries). The volume of intra-            than last year in France (-150 kt), UK (-70 kt),    in the volume of intra-EU rapeseed trade
EU rapeseed trade in 2011/12 is now ex-                   Romania (-105 kt) and Belgium (-75 kt).             in 2012/13 to 6.2 Mt. The better harvest in
pected at 7.2 Mt, down 70 kt compared with                Rapeseed exports are forecast up sharply            Germany and the very sharp falls in produc-
last month. This fall corresponds to a lower              from France (+710 kt to 1.9 Mt), from the           tion in Romania and Bulgaria will significantly
forecast for Dutch exports (-95 kt to 510 kt),            UK (+230 kt to 660 kt) and from Hungary             alter the pattern of trade between the east and
and to a smaller extent, UK exports (-10 kt). By          (+250 kt). Dutch exports are also forecast up       west EU.
contrast, we have increased projected exports             (+185 kt), as are Belgian exports (+85 kt);         Compared with 2011/12, German imports
from Czech Republic and Bulgaria (+15 kt                  these increases correspond to transhipments         are expected down 720 kt to 2.8 Mt; we also
and +10 kt respectively).                                 from third countries to other EU countries.         forecast smaller import requirements for the
On the import side, we have revised down pro-             Exports are expected sharply down from Ro-          Netherlands (-150 kt), France (-140 kt), Hun-
jected import volumes in Germany (-105 kt)                mania (-320 kt) and Poland (-105 kt), due to        gary (-165 kt) and Slovakia (-70 kt). Imports
but increased projected imports in Hungary,               the smaller harvests in these countries.            are expected up compared with last year in
Belgium and Poland (around +10 kt each).                  These forecasts will be subject to variation over   Denmark (+130 kt), UK (+65 kt) and in sev-
Compared with 2010/11, imports are still                  the coming months to reflect trade statistics       eral other countries (Estonia, Austria, Sweden).
forecast sharply up in Germany at 3.53 Mt                 and changes in price spreads between the dif-       German exports are expected up 175 kt com-
(+1.44 Mt compared with 2010/11). Imports                 ferent origins.                                     pared with 2011/12, mainly to Scandinavia;

           S   t r a t é g i e         g r a i n s        — O      i l s e e d      R   e p o r t       1 — 26 A             p r i l     2012
European Union Rapeseed         balances
 10
                                   Table 2.4: intra-EU rapeseed trade 2012/13 and 2011/12 (kt)
origins                         destinations                                                                                             2012/13
         Ger. B/L Den. Spn. Fra. Gre. Irl. Ita.Neth. Por. U.K. Aust. Fin. Swe. Pol. Hun. Cze. Slk. Est. Lat. Lit. Sln. Cyp. Mal. Rom. Bul.   EU
  Ger.         33 83     0 19        0     0  2 55     0 55 18 50           3 32      2 41      4    0    0    1    7    0    0     1   0    406
  B/L 313           0    4 29        0     0  0 45     0     0    0    0    0    0    0    0    0    0    0    0    0    0    0     0   0    392
 Den. 117       0        0    4      0     0  0   5    0     4    0 15      7    0    0    0    0    0    0    1    0    0    0     0   0    154
 Spn.      0    0   0         3      0     0  0   0    2     0    0    0    0    0    0    0    0    0    0    0    0    0    0     0   0      5
  Fra. 844 405 129 10                0     1  1 192    3 33       0    0    5    1    1    0    0    0    0    0    0    0    0     2   1 1629
 Gre.      0    0   0    0    0            0  0   0    0     0    0    0    0    0    0    0    0    0    0    0    0    0    0     0   0      0
    Irl.   0    5   0    0    0      0        0   3    0 10       0    0    0    0    0    0    0    0    0    0    0    0    0     0   0     18
   Ita.    1    1   2    0    2      0     0      1    0     0    0    0    0    0    0    0    0    0    0    0    0    0    0     3   0     10
Neth. 353 121       0 15      9      0     0  0        0 16       0    0    0    2    0    0    0    0    0    0    0    0    0     0   0    517
  Por.     0    0   0    1    0      0     0  0   0          0    0    0    0    0    0    0    0    0    0    0    0    0    0     0   0      1
 U.K. 181 215 19         0 123       0     5  0 109    0          0    7 31 26        0    0    0    0    0    0    0    0    0     0   0    715
 Aust. 35       0   0    0    0      0     0 10   0    0     0         0    0    0    2    6    7    0    0    0    0    0    0     0   0     62
  Fin.     0    0   0    0    0      0     0  0   0    0     0    0         0    0    0    0    0    0    0    0    0    0    0     0   0      0
Swed.      1    0 26     0    0      0     0  0   0    0     0    0    1         1    0    0    0    0    0    0    0    0    0     0   0     30
  Pol. 224      0   0    0    0      0     0  0   0    0     0    0    0    0         9    8    1    0    0    0    0    0    0     0   0    243
Hun. 179        0   0    0    0      0     0  9   9    0     0 127     0    0    8         6 60      0    0    0    0    0    0 14      0    412
Cz.R. 265       0   0    0    0      0     0  0   0    0     0    6    0    0 16      8        60    0    0    0    0    0    0     0   0    355
  Slk.     7    0   0    0    0      0     0  0   0    0     0 47      0    0 27 167 41              0    0    0    0    0    0     0   0    289
  Est. 85       0   9    0    0      0     0  0   4    0     7    0 20 10        0    0    0    0         1    1    0    0    0     0   0    137
  Lat. 75       8 25     1    5      0     0  0   7    0     0    0 15      4    8    0    0    0    2        46    0    0    0     0   0    197
  Lit. 73 37 21          0    4      0     0  0   1    0     1    0 13      0 40      0    0    0 46 43             0    0    0     0   0    279
  Sln.     0    0   0    0    0      0     0 17   0    0     0    3    0    0    0    3    0    1    0    0    0         0    0     0   0     24
 Cyp.      0    0   0    0    0      0     0  0   0    0     0    0    0    0    0    0    0    0    0    0    0    0         0     0   0      0
 Mal.      0    0   0    0    0      0     0  0   0    0     0    0    0    0    0    0    0    0    0    0    0    0    0          0   0      0
Rom. 30 34          0    0 12        2     0  4 34     0     2    4    0    0    2 11      4    5    0    0    0    0    0    0         1    145
  Bul.     4 44 10       0    0      0     0  0 21     0     0    0    0    0    0    0    0    0    0    0    0    0    0    0 105          185
  EU 2786 904 324 31 210             2     6 45 484    5 128 206 122 61 163 204 107 138 48 45 49                    8    0    0 126     2 6205

origins                         destinations                                                                                             2011/12
         Ger. B/L Den. Spn. Fra. Gre. Irl. Ita.Neth. Por. U.K. Aust. Fin. Swe. Pol. Hun. Cze. Slk. Est. Lat. Lit. Sln. Cyp. Mal. Rom. Bul.   EU
  Ger.         25 14     0 28        0     0  2 65     0     8    3 14      3 35      0 27      4    0    0    0    2    0    0     1   0    232
  B/L 318           0    9 21        0     0  0 36     0     0    0    0    0    0    0    0    0    0    0    0    0    0    0     0   0    384
 Den. 144       0        0    2      0     0  0   0    0     1    0 14      6    0    0    0    0    0    0    0    0    0    0     0   0    169
 Spn.      0    0   0         3      0     0  0   0    1     0    0    0    0    0    0    0    0    0    0    0    0    0    0     0   0      4
  Fra. 1203 466     6 12             0     1  1 189    7 33       0    0    4    1    1    0    0    0    0    0    0    0    0     2   1 1930
 Gre.      0    0   0    0    0            0  0   0    0     0    0    0    0    0    0    0    0    0    0    0    0    0    0     0   0      0
    Irl.   0 10     0    0    0      0        0   6    0     9    0    0    0    0    0    0    0    0    0    0    0    0    0     0   0     25
   Ita.    1    3   1    0    2      0     0      1    0     0    0    0    0    0    0    0    0    0    0    0    0    0    0     4   0     11
Neth. 374 52        0    2 10        0     0  0        0 10       0    0    0    3    0    0    0    0    0    0    0    0    0     0   0    451
  Por.     0    0   0    1    0      0     0  0   0          0    0    0    0    0    0    0    0    0    0    0    0    0    0     0   0      1
 U.K. 313 18 14          0 127       0     4  0 127    0          0    7 24 27        0    0    0    0    0    0    0    0    0     0   0    660
 Aust. 41       0   0    0    0      0     0  7   0    0     0         0    0    0    3 12      4    0    0    0    0    0    0     0   0     69
  Fin.     0    0   0    0    0      0     0  0   0    0     0    0         0    0    0    0    0    0    0    0    0    0    0     0   0      0
Swed.      1    0   8    0    0      0     0  0   0    0     0    0    1         3    0    0    0    0    0    0    0    0    0     0   0     13
  Pol. 247      0   0    0    0      0     0  0   0    0     0    0    0    0        13 15      1    0    0    0    0    0    0     0   0    275
Hun. 380        0   0    0    0      0     0  5   5    0     0 113     0    0    5        10 162     0    0    0    0    0    0 17      0    698
Cz.R. 209       0   0    0    0      0     0  0   0    0     0    4    0    0 15 16            27    0    0    0    0    0    0     0   0    270
  Slk. 21       0   0    0    0      0     0  0   0    0     0 53      0    0 31 261 38              0    0    0    0    0    0     0   0    404
  Est. 22       0 19     0    0      0     0  0   0    0     1    0 36      0    0    0    0    0         0    3    0    0    0     0   0     81
  Lat. 55       5 49     3    1      0     0  0   5    0     0    0 26      3 16      0    0    0    1        42    0    0    0     0   0    204
  Lit. 49 32 33          0    1      0     0  0   7    0     0    0 18      0 73      0    0    0    0 50           0    0    0     0   0    263
  Sln.     0    0   0    0    0      0     0 11   0    0     0    5    0    0    0    4    0    1    0    0    0         0    0     0   0     22
 Cyp.      0    0   0    0    0      0     0  0   0    0     0    0    0    0    0    0    0    0    0    0    0    0         0     0   0      0
 Mal.      0    0   0    0    0      0     0  0   0    0     0    0    0    0    0    0    0    0    0    0    0    0    0          0   0      0
Rom. 71 236         0    0 39        2     0  5 115    0     0    3    0    0    2 73      1    9    0    0    0    0    0    0         0    555
  Bul. 85 45 48 23 117               0     0  0 78     0     0    0    0    0    0    0    0    1    0    0    0    0    0    0 79           476
  EU 3534 891 192 50 352             2     5 31 634    7 62 182 116 41 209 371 104 208               1 51 46        3    0    0 102     3 7197
          S   t r a t é g i e   g r a i n s     — O      i l s e e d     R   e p o r t      1 — 26 A             p r i l    2012
European Union Rapeseed             balances
                                                                                                                                                                11
Czech exports are expected up 85 kt. However,                and Romania (-40 kt), partly offset by higher          ferent origins. The forecasts will be amended
we envisage a sharp decline for Romanian ex-                 import forecasts for the UK (+70 kt) and the           during the coming months to reflect the latest
ports to just 145 kt (-410 kt), and Bulgarian                Netherlands (+55 kt). These changes have a
                                                                                                                    available data.
exports to just 185 kt (-290 kt), due to the very            downward impact compared with last month
small harvests forecasts for 2012 in these coun-             on exports form the central EU countries (-170         N.B: Subscribers to our online “Intra-EU
tries. Lastly, French exports are expected down              kt) and from Bulgaria (-35 kt).                        Trade” web module can consult the full break-
300 kt to 1.63 Mt.                                           These forecasts will be subject to very signifi-
                                                                                                                    down of intra-EU rapeseed trade (including
We have reduced our intra-EU trade forecast                  cant variations over the coming months to re-
by 115 kt since last month. This results from                flect harvest outcomes in the EU and globally,         recorded and projected volumes for each country)
lower import forecasts for Germany (-55 kt)                  and changes in price spreads between the dif-          at our website strategie-grains.com.

World rapeseed market
2011/12: fall in demand too low to prevent lower ending stock — 2012/13:
new expected reduction in world stocks
Sharp rise in world rapeseed                   crude oil also fell slightly to 102 $ a barrel on                    evolved in the same manner, and competitive
                                               April 19.                                                            spreads are therefore almost unchanged.
prices
                                               As of April 20, the C&F Hamburg rapeseed
Since last month, rapeseed prices have risen price was 661 $/t (+38 $/t since last month).
                                                                                                                    Ending stock 2011/12 expect-
sharply due to the impact from the soybean The price of Canadian canola rose by about 30
                                                                                                                    ed down despite lower crush
market and the lower rapeseed production US$/t to around 628 US$/t (after an increase
                                                                                                                    demand
forecasts for the EU in 2012. The price of of 40 $/t last month). The Canadian price re-
                                                                       mains therefore close to                     Global rapeseed availabilities down
       Graphic 2.5: world rapeseed prices (US $/t)                     the C&F Hamburg price                        2.7 Mt vs. 2010/11
                                                                       after having spent much                      Ending stock 2011/12 is currently estimat-
                        Ukrainian Rapeseed Fob Odessa                 of the crop year so far be-                   ed at 5.7 Mt, down 0.5 Mt compared with
     $/t                Canadian Canola Fob Vancouver                 low it (see graphic 2.5).                     end-2010/11. Carry-in stock is estimated 1.5
                        Rapeseed Europe Cif Hamburg                   The price of Australian                       Mt less than at the start of 2010/11, and world
     750
                                                                      rapeseed was relatively flat                  rapeseed production is set to decline for the
     650                                                              this month at around 490                      second consecutive year to 59.1 Mt (-1.2 Mt vs.
                                                                      US$/t (-2 $/t); Australian                    2010/11).
     550                                                              export availability remains                   Since last month, we have increased projected
                                                                      high, at around 1 Mt, see                     world production by 0.4 Mt, mostly in India
     450                                                              below.                                        (+0.3 Mt) where the harvest has turned out
                                                                      As last month, Ukrainian                      better than previously expected. As mentioned
     350
                                                                      and Bulgarian rapeseed                        last month, the largest falls in rapeseed produc-
     250
                                                                      are no longer quoted for                      tion compared with last year concern the EU
                                                                      old crop deliveries.                          (-1.5 Mt), India (-1.1 Mt), China (-0.6 Mt) and
                                                                      Apart from Australian                         the USA (-0.4 Mt). By contrast, production is
                                                                      rapeseed, the prices of the                   up sharply in Canada (+1.4 Mt) and Australia
                                                                      other world origins have                      (+0.6 Mt). Despite a smaller harvest than last
                                                                                                                    year in Ukraine, the Black Sea countries in-
                    Table 2.5 estimated rapeseed balance sheets for                                                 creased production by 0.3 Mt overall, this in-
                      Ukraine, Canada and Australia (July/June)                                                     crease mainly in Russia.
                                      Ukraine                       Canada                    Australia             Global rapeseed supply in 2011/12 is esti-
                          Mt     10/11     11/12    12/13     10/11    11/12    12/13    10/11    11/12    12/13    mated down 2.7 Mt in 2011/12 compared
              carry-in stocks       0,0       0,0      0.1       2.3      1.8      0.9      0.4      0.6      0.5   with 2010/11 to 65.3 Mt (+0.4 Mt compared
                 production         1,5       1,4      0.9     12.8     14.2     14.9       2.4      2.9      2.9   with last month). There is little change this
                     imports        0,0       0,0      0.0       0.2      0.1      0.1      0.0      0.0      0.0   month to our crush demand estimate, which is
                      exports       1,4       1,2      0.9       7.1      8.0      7.6      1.5      2.2      2.1   expected down 2.4 Mt at the global level com-
               consumption          0,1       0,1      0.1       6.4      6.8      7.4      0.8      0.9      0.8   pared with last year, with reductions of 1.5 Mt
                 carry-out st.      0,0       0,1      0.1       1.8      0.9      0.9      0.6      0.5      0.4   in India, 1 Mt in the EU, 250 kt in China, 230
                                                             source: Stratégie grains (based on various sources)    kt in Japan, 125 kt in Turkey, and 175 kt in the
          S   t r a t é g i e             g r a i n s        — O       i l s e e d       R   e p o r t        1 — 26 A              p r i l    2012
European Union Rapeseed            balances
 12
USA. These falls are linked to smaller harvests      than in 2010/11 in China (+0.7 Mt), the EU             Table 2.6: world rapeseed/canola
(China, India, EU, USA), or lower imports            (+0.4 Mt), the USA (+0.2 Mt due to smaller                balance sheet (July/June)
(Japan, Turkey). Crush demand is expected up         harvest) and Pakistan (+0.1 Mt). Several coun-                            Mt     10/11    11/12    12/13
in Canada (+0.4 Mt compared with 2010/11)            tries will import less than in 2010/11, notably               carry-in stocks       7.8      6.2      5.4
due to the larger harvest. Rapeseed usage is also    Japan (-0.2 Mt), Mexico (-0.1 Mt) and Turkey                     production       60.3     59.1     60.2
expected up in Russia (+0.2 Mt).                     (-0.1 Mt). These falls will be offset by increased                      trade     10.7     11.9     11.2
Compared with last month, we have increased          usage of other oilseeds that are currently cheap-              consumption        61.8     59.9     60.7
our estimates for crush demand by 0.2 Mt with        er, or by a decline in total oilseed usage.                    of which feed        2.4      2.9      2.6
                                                                                                                      carry-out st.      6.2      5.4      4.9
India (+0.3 Mt in line with larger harvest),
Japan (+250 kt) and China (+100 kt); these           World market set to remain tight                          stocks-to-use ratio     10%       9%       8%

increases are partly offset by reductions in other   We estimate global rapeseed ending stock
                                                     at 5.4 Mt, which equals just 9 % of total an-        source: Stratégie grains (based on various sources)
countries.
Demand for rapeseed for human/indus-                 nual demand (compared with 10.1 % at end-
                                                     2010/11 and 12.8 % at end-2009/10). The              kha in Canada, and +100 kha in Australia) to
trial usages in 2011/12 is estimated at 57 Mt                                                             reflect the latest available statistics and/or price
(+0.2 Mt compared with last month); it is set        percentage has fallen slightly since last month
                                                     (-0.3 %), and this situation should support          increases.
to be lower than last year in most parts of the                                                           The increase compared with last year mostly
world.                                               prices until the end of the crop year. The out-
                                                     look therefore remains tight. The sharp fall in      relates to production growth in India (+1.2
Animal feed and other usages are still forecast                                                           Mt) and China (+0.8 Mt), due to an improve-
to increase (+0.5 Mt compared with 2010/11)          demand will not be severe enough to prevent
                                                     a decrease in stock. This is bullish in terms of     ment in yields after last year’s disappointing
to 2.9 Mt, mostly due to increased harvest in                                                             results. We also forecast harvest increases for
Canada.                                              prices, which will need to keep rising in order
                                                     to maintain the squeeze on crush demand. In          Canada (+0.7 Mt) and the USA (+0.4 Mt);
World trade revised up                               addition, rapeseed prices could be subject to        due to increased area; meanwhile production
Our trade estimates now include customs sta-         further bullish influence from the very tight        is expected stable in Australia (acreage higher
tistics for February 2012 for Ukraine, Canada,       soybean market, and the markets for crushed          than last year but yields lower following the
Australia, USA and EU. World rapeseed trade          seed products (oils and meals): if the prices for    exceptional results of 2011/12). By contrast,
in 2010/11 is now estimated at 11.8 Mt, up           these products increased, the price of seeds will    production is set to fall in the EU (see Produc-
more than 1 Mt compared with 2010/11.                have to increase similarly in order to keep pres-    tion) and the Black Sea (-0.5 Mt), especially in
Since last month we have increased our               sure on margins. Rape oil and rape meal prices       Ukraine, where the harvest is expected at less
world trade forecast by 0.5 Mt; this increase        will also be influenced by the global soybean        than 1 Mt.
concerns Canadian exports only. As of Febru-         market (see EU Soybean – World Market) and           Global opening stock is expected down 0.8 Mt
ary 29, Canada had already exported 6.4 Mt of        by the world economic conditions in the com-         compared with 2011/12: the projected rise in
rapeseed, including 1 Mt in January and 800          ing months. The price of crude oil price will        global rapeseed availabilities is therefore small
kt in February. We forecast that it will ship a      remain a key factor, with propensity to change       (+0.3 Mt). We estimate global rapeseed sup-
further 1.6 Mt before the end of the crop year,      sharply in response to geopolitical considera-       ply at 65.6 Mt, down 1.1 Mt compared with
with the pace of exports slowing (to around          tions in the Middle East.                            last month.
400 kt per month). The price of Canadian                                                                  Demand is expected up 0.8 Mt compared
canola has effectively risen sharply since Febru-    Very tight outlook for                               with 2011/12 (+1.1 Mt for crush and human
ary, which should reduce demand for Cana-                                                                 consumption and -0.3 Mt in animal feeds): the
                                                     2012/13
dian canola. However, given the high volume                                                               growth in rapeseed crush mostly concerns In-
of seeds already shipped, we have increased our      World production set to increase                     dia and China (+1.1 Mt and +0.8 Mt respec-
estimate this month.                                 slightly in 2012                                     tively, due to better harvests). Crush demand
The higher forecast for Canadian exports im-         We estimate world rapeseed production in             is also expected up in the Black Sea countries
pacts on import volumes for Japan (+280 kt),         2012/13 at 60.2 Mt, up 1.15 Mt compared              (+0.1 Mt in Russia) and Canada (+0.2 Mt).
China (+100 kt), Mexico (+70 kt), Pakistan           with 2011/12. We have reduced this harvest           Demand for rapeseed in animal feeds is expect-
and Bangladesh (+50 kt each).                        forecast by 1 Mt since last month, reflecting        ed to decrease slightly, mainly in the EU (due to
Australian exports are unchanged at 2.2 Mt           the smaller expected harvests in the EU (-1.5        lower production).
(1.17 Mt shipped as of February 29).                 Mt) and Ukraine (-250 kt), where winter              Thus for the end of 2012/13, we forecast a
Exports are expected higher than in                  losses were higher than previously expected,         further reduction in global rapeseed stock
2010/11 from Canada (+0.9 Mt), Australia             and where spring rape plantings are lower than       by around 0.5 Mt to just 4.9 Mt or 8.2% of
(+0.7 Mt), and Russia (+0.2 Mt). By con-             previously envisaged due to the late arrival of      annual global demand (compared with 5.1 Mt
trast, we forecast lower export volumes than         spring this year. These reductions are partly        or 8.3 % estimated last month). This is even
in 2010/11 from Ukraine (-0.27 Mt), the EU           offset by increased production forecasts for         lower than the previous record low level at end-
(-0.1 Mt, due to lower availabilities in Romania     Canada (+500 kt) and Australia (+200 kt):            2007/08 (8.4% of annual demand). The out-
and Bulgaria). Imports are expected higher           acreage in these countries estimated up (+235        look is therefore extremely tight; this should
          S   t r a t é g i e       g r a i n s      — O      i l s e e d      R   e p o r t        1 — 26 A                p r i l      2012
Oilseed report
Oilseed report
Oilseed report
Oilseed report
Oilseed report
Oilseed report
Oilseed report
Oilseed report
Oilseed report
Oilseed report
Oilseed report
Oilseed report
Oilseed report
Oilseed report
Oilseed report
Oilseed report
Oilseed report
Oilseed report
Oilseed report
Oilseed report
Oilseed report
Oilseed report
Oilseed report
Oilseed report
Oilseed report
Oilseed report
Oilseed report
Oilseed report
Oilseed report
Oilseed report
Oilseed report
Oilseed report
Oilseed report
Oilseed report
Oilseed report
Oilseed report

More Related Content

Featured

2024 State of Marketing Report – by Hubspot
2024 State of Marketing Report – by Hubspot2024 State of Marketing Report – by Hubspot
2024 State of Marketing Report – by HubspotMarius Sescu
 
Everything You Need To Know About ChatGPT
Everything You Need To Know About ChatGPTEverything You Need To Know About ChatGPT
Everything You Need To Know About ChatGPTExpeed Software
 
Product Design Trends in 2024 | Teenage Engineerings
Product Design Trends in 2024 | Teenage EngineeringsProduct Design Trends in 2024 | Teenage Engineerings
Product Design Trends in 2024 | Teenage EngineeringsPixeldarts
 
How Race, Age and Gender Shape Attitudes Towards Mental Health
How Race, Age and Gender Shape Attitudes Towards Mental HealthHow Race, Age and Gender Shape Attitudes Towards Mental Health
How Race, Age and Gender Shape Attitudes Towards Mental HealthThinkNow
 
AI Trends in Creative Operations 2024 by Artwork Flow.pdf
AI Trends in Creative Operations 2024 by Artwork Flow.pdfAI Trends in Creative Operations 2024 by Artwork Flow.pdf
AI Trends in Creative Operations 2024 by Artwork Flow.pdfmarketingartwork
 
PEPSICO Presentation to CAGNY Conference Feb 2024
PEPSICO Presentation to CAGNY Conference Feb 2024PEPSICO Presentation to CAGNY Conference Feb 2024
PEPSICO Presentation to CAGNY Conference Feb 2024Neil Kimberley
 
Content Methodology: A Best Practices Report (Webinar)
Content Methodology: A Best Practices Report (Webinar)Content Methodology: A Best Practices Report (Webinar)
Content Methodology: A Best Practices Report (Webinar)contently
 
How to Prepare For a Successful Job Search for 2024
How to Prepare For a Successful Job Search for 2024How to Prepare For a Successful Job Search for 2024
How to Prepare For a Successful Job Search for 2024Albert Qian
 
Social Media Marketing Trends 2024 // The Global Indie Insights
Social Media Marketing Trends 2024 // The Global Indie InsightsSocial Media Marketing Trends 2024 // The Global Indie Insights
Social Media Marketing Trends 2024 // The Global Indie InsightsKurio // The Social Media Age(ncy)
 
Trends In Paid Search: Navigating The Digital Landscape In 2024
Trends In Paid Search: Navigating The Digital Landscape In 2024Trends In Paid Search: Navigating The Digital Landscape In 2024
Trends In Paid Search: Navigating The Digital Landscape In 2024Search Engine Journal
 
5 Public speaking tips from TED - Visualized summary
5 Public speaking tips from TED - Visualized summary5 Public speaking tips from TED - Visualized summary
5 Public speaking tips from TED - Visualized summarySpeakerHub
 
ChatGPT and the Future of Work - Clark Boyd
ChatGPT and the Future of Work - Clark Boyd ChatGPT and the Future of Work - Clark Boyd
ChatGPT and the Future of Work - Clark Boyd Clark Boyd
 
Getting into the tech field. what next
Getting into the tech field. what next Getting into the tech field. what next
Getting into the tech field. what next Tessa Mero
 
Google's Just Not That Into You: Understanding Core Updates & Search Intent
Google's Just Not That Into You: Understanding Core Updates & Search IntentGoogle's Just Not That Into You: Understanding Core Updates & Search Intent
Google's Just Not That Into You: Understanding Core Updates & Search IntentLily Ray
 
Time Management & Productivity - Best Practices
Time Management & Productivity -  Best PracticesTime Management & Productivity -  Best Practices
Time Management & Productivity - Best PracticesVit Horky
 
The six step guide to practical project management
The six step guide to practical project managementThe six step guide to practical project management
The six step guide to practical project managementMindGenius
 
Beginners Guide to TikTok for Search - Rachel Pearson - We are Tilt __ Bright...
Beginners Guide to TikTok for Search - Rachel Pearson - We are Tilt __ Bright...Beginners Guide to TikTok for Search - Rachel Pearson - We are Tilt __ Bright...
Beginners Guide to TikTok for Search - Rachel Pearson - We are Tilt __ Bright...RachelPearson36
 

Featured (20)

2024 State of Marketing Report – by Hubspot
2024 State of Marketing Report – by Hubspot2024 State of Marketing Report – by Hubspot
2024 State of Marketing Report – by Hubspot
 
Everything You Need To Know About ChatGPT
Everything You Need To Know About ChatGPTEverything You Need To Know About ChatGPT
Everything You Need To Know About ChatGPT
 
Product Design Trends in 2024 | Teenage Engineerings
Product Design Trends in 2024 | Teenage EngineeringsProduct Design Trends in 2024 | Teenage Engineerings
Product Design Trends in 2024 | Teenage Engineerings
 
How Race, Age and Gender Shape Attitudes Towards Mental Health
How Race, Age and Gender Shape Attitudes Towards Mental HealthHow Race, Age and Gender Shape Attitudes Towards Mental Health
How Race, Age and Gender Shape Attitudes Towards Mental Health
 
AI Trends in Creative Operations 2024 by Artwork Flow.pdf
AI Trends in Creative Operations 2024 by Artwork Flow.pdfAI Trends in Creative Operations 2024 by Artwork Flow.pdf
AI Trends in Creative Operations 2024 by Artwork Flow.pdf
 
Skeleton Culture Code
Skeleton Culture CodeSkeleton Culture Code
Skeleton Culture Code
 
PEPSICO Presentation to CAGNY Conference Feb 2024
PEPSICO Presentation to CAGNY Conference Feb 2024PEPSICO Presentation to CAGNY Conference Feb 2024
PEPSICO Presentation to CAGNY Conference Feb 2024
 
Content Methodology: A Best Practices Report (Webinar)
Content Methodology: A Best Practices Report (Webinar)Content Methodology: A Best Practices Report (Webinar)
Content Methodology: A Best Practices Report (Webinar)
 
How to Prepare For a Successful Job Search for 2024
How to Prepare For a Successful Job Search for 2024How to Prepare For a Successful Job Search for 2024
How to Prepare For a Successful Job Search for 2024
 
Social Media Marketing Trends 2024 // The Global Indie Insights
Social Media Marketing Trends 2024 // The Global Indie InsightsSocial Media Marketing Trends 2024 // The Global Indie Insights
Social Media Marketing Trends 2024 // The Global Indie Insights
 
Trends In Paid Search: Navigating The Digital Landscape In 2024
Trends In Paid Search: Navigating The Digital Landscape In 2024Trends In Paid Search: Navigating The Digital Landscape In 2024
Trends In Paid Search: Navigating The Digital Landscape In 2024
 
5 Public speaking tips from TED - Visualized summary
5 Public speaking tips from TED - Visualized summary5 Public speaking tips from TED - Visualized summary
5 Public speaking tips from TED - Visualized summary
 
ChatGPT and the Future of Work - Clark Boyd
ChatGPT and the Future of Work - Clark Boyd ChatGPT and the Future of Work - Clark Boyd
ChatGPT and the Future of Work - Clark Boyd
 
Getting into the tech field. what next
Getting into the tech field. what next Getting into the tech field. what next
Getting into the tech field. what next
 
Google's Just Not That Into You: Understanding Core Updates & Search Intent
Google's Just Not That Into You: Understanding Core Updates & Search IntentGoogle's Just Not That Into You: Understanding Core Updates & Search Intent
Google's Just Not That Into You: Understanding Core Updates & Search Intent
 
How to have difficult conversations
How to have difficult conversations How to have difficult conversations
How to have difficult conversations
 
Introduction to Data Science
Introduction to Data ScienceIntroduction to Data Science
Introduction to Data Science
 
Time Management & Productivity - Best Practices
Time Management & Productivity -  Best PracticesTime Management & Productivity -  Best Practices
Time Management & Productivity - Best Practices
 
The six step guide to practical project management
The six step guide to practical project managementThe six step guide to practical project management
The six step guide to practical project management
 
Beginners Guide to TikTok for Search - Rachel Pearson - We are Tilt __ Bright...
Beginners Guide to TikTok for Search - Rachel Pearson - We are Tilt __ Bright...Beginners Guide to TikTok for Search - Rachel Pearson - We are Tilt __ Bright...
Beginners Guide to TikTok for Search - Rachel Pearson - We are Tilt __ Bright...
 

Oilseed report

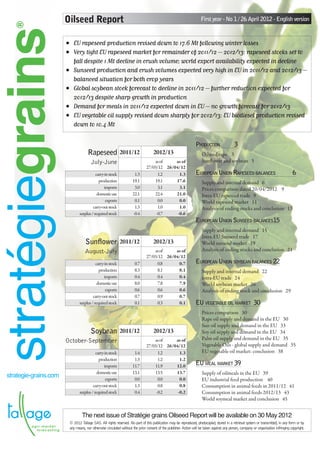
  • 1. ® Oilseed Report First year - No 1 / 26 April 2012 - English version stratégiegrains • EU rapeseed production revised down to 17.6 Mt following winter losses • Very tight EU rapeseed market for remainder of 2011/12 – 2012/13: rapeseed stocks set to fall despite 1 Mt decline in crush volume; world export availability expected in decline • Sunseed production and crush volumes expected very high in EU in 2011/12 and 2012/13 – balanced situation for both crop years • Global soybean stock forecast to decline in 2011/12 – further reduction expected for 2012/13 despite sharp growth in production • Demand for meals in 2011/12 expected down in EU – no growth forecast for 2012/13 • EU vegetable oil supply revised down sharply for 2012/13: EU biodiesel production revised down to 10.4 Mt Production 3 Rapeseed 2011/12 2012/13 Oilseed rape 3 July-June as of as of Sunflower and soybean 5 27/03/12 26/04/12 carry-in stock 1.3 1.2 1.3 European Union Rapeseed balances 6 production 19.1 19.1 17.6 Supply and internal demand 6 imports 3.0 3.1 3.1 Prices comparison dated 20/04/2012  9 domestic use 22.1 22.4 21.0 Intra-EU rapeseed trade 9 exports 0.1 0.0 0.0 World rapeseed market 11 carry-out stock 1.3 1.0 1.0 Analysis of ending stocks and conclusion 13 surplus / required stock -0.4 -0.7 -0.6 European Union Sunseed balances 5 1 Supply and internal demand 15 Intra-EU Sunseed trade 17 Sunflower 2011/12 2012/13 World sunseed market 19 August-July as of as of Analysis of ending stocks and conclusion 21 27/03/12 26/04/12 carry-in stock 0.7 0.8 0.7 European Union soybean balances 22 production 8.3 8.1 8.1 Supply and internal demand 22 imports 0.4 0.4 0.4 intra-EU trade 24 domestic use 8.0 7.8 7.9 World soybean market 26 exports 0.6 0.6 0.6 Analysis of ending stock and conclusion 29 carry-out stock 0.7 0.9 0.7 surplus / required stock 0.1 0.3 0.1 EU vegetable oil market 30 Prices comparison 30 Rape oil supply and demand in the EU 30 Sun oil supply and demand in the EU 33 Soybean 2011/12 2012/13 Soy oil supply and demand in the EU 34 October-September as of as of Palm oil supply and demand in the EU 35 27/03/12 26/04/12 Vegetable Oils - global supply and demand 35 carry-in stock 1.4 1.2 1.3 EU vegetable oil market: conclusion 38 production 1.3 1.2 1.2 imports 11.7 11.9 12.0 EU meal market 39 domestic use 13.1 13.5 13.7 Supply of oilmeals in the EU 39 strategie-grains.com exports 0.0 0.0 0.0 EU industrial feed production 40 carry-out stock 1.3 0.8 0.8 Consumption in animal feeds in 2011/12 41 surplus / required stock 0.4 -0.2 -0.2 Consumption in animal feeds 2012/13 43 World soymeal market and conclusion 45 The next issue of Stratégie grains Oilseed Report will be available on 30 May 2012 © 2012 Tallage SAS. All rights reserved. No part of this publication may be reproduced, photocopied, stored in a retrieval system or transmitted, in any form or by any means, nor otherwise circulated without the prior consent of the publisher. Action will be taken against any person, company or organisation infringing copyright.
  • 2. graphs and tables 2 Graphs Graphic 1.1: variation in water balance compared with the norm for period: September 1 2011 through April 19 2012 4 Graphic 1.2: Rapeseed production in the EU27 (Mt) 4 Graphic 1.3: Sunseed production in the EU27 (Mt) 5 Graphic 1.4: Soybean production in the EU27 (Mt) 5 Graphic 2.1: rapeseed crush demand in the EU (Mt) 6 Graphic 2.2: rapeseed crush margins in Hamburg (€/t seeds) 8 Graphic 2.3: comparison between rapeseed and sunseed crush margins in France (€/t seeds) 8 Graphic 2.4: Euronext prices (€/t) 9 Graphic 2.5: world rapeseed prices (US $/t) 11 Graphic 3.1: human/industrial demand for sunseed in the EU27 (Mt) 15 Graphic 3.2 : Sunseed crush margin in France (€/t) 17 Graphic 3.3: world sun seed prices (FOB in US $/t) 19 Graphic 4.1: demand for soybean for crush usage in the EU27 (Mt) 22 Graphic 4.2: world demand for soybean (kt) 27 Graphic 4.3: world soybean prices (CBOT, $/bushel) 28 Graphic 4.4: soybean/maize price ratio in the USA for November/December (CBOT) 28 Graphic 5.1: biodiesel and vegetable oil prices (€/t) 31 Graphic 6.1: changes in cattle numbers in the EU 41 Graphic 6.2: changes in milk collection in the EU compared with quota 41 Graphic 6.3: changes in pig numbers in the EU 41 Graphic 6.4: soy/wheat price ratio in France 42 Graphic 6.5: prices of soymeal, rapemeal and sunmeal in the EU (€/t) 43 Tables Table 1.1: Oilseed rape planted areas, yields and production 3 Table 1.2: Sunflower planted areas, yields and production 5 Table 1.3: Changes to main arable crop areas (EU27) 4 Table 2.1: breakdown of EU rapeseed imports by country of origin 6 Table 2.2: rapeseed balance sheet July-June 2012/13 and 2011/12 (kt) 7 Table 2.3: rapeseed prices in main EU countries dated 20/04/2012 9 Table 2.4: intra-EU rapeseed trade 2012/13 and 2011/12 (kt) 10 Table 2.5 estimated rapeseed balance sheets for Ukraine, Canada and Australia (July/June) 11 Table 2.6: world rapeseed/canola balance sheet (July/June) 12 Table 2.7: world import requirements and export forecasts (Mt) — July-June 13 Table 3.1: EU sunseed imports by origin (kt) 15 Table 3.2: EU sunseed balance sheet, August-July 2012/13 and 2011/12 (kt) 16 Table 3.3: intra-EU sunseed trade 2012/13 and 2011/12 (kt) 18 Table 3.4: world sunseed supply and demand balance sheet – August-July (Mt) 19 Table 3.5: sunseed balance sheets for Ukraine, Russia, Moldova, and Argentina – August-July 19 Table 3.6: estimated sun seed import requirements and export volumes (Mt) – August–July crop year 20 Table 4.1: EU soybean imports by country of origin (kt) 22 Table 4.2: EU27 soybean balance sheet October-September 2012/13 and 2011/12 (kt) 23 Table 4.3: intra-EU soybean trade 2012/13 and 2011/12 October-September (kt) 25 Table 4.4: world soybean balance sheet October-September (Mt) 26 Table 4.5: FOB prices for main soybean origins dated 19/04/2012 26 Table 4.6: soybean balance sheets for main exporting and importing countries - October-September (Mt) 27 Table 4.7: soybean balance sheets for Ukraine and Russia - October-September (Mt) 27 Table 4.8: monthly soybean imports for China (Mt) 27 Table 5.1: vegetable oil prices in Rotterdam on 20/04/12 ($/t) 30 Table 5.2: supply and demand balance sheet of rape oil in 2010/11, 2011/12 and 2012/13 (Mt) –July/June 31 Table 5.3: supply and demand balance sheet for biodiesel in 2010/11, 2011/12 and 2012/13 (Mt) –July/june 31 Table 5.4: supply and demand balance sheet for sun oil in 2010/11, 2011/12 and 2012/13 (Mt) –August/July 33 Table 5.5: supply and demand balance sheet for soy oil in 2010/11, 2011/12 and 2012/13 (Mt) –October/September 34 Table 5.6: supply and demand balance sheet for palm oil in 2010/11, 2011/12 and 2012/13 (Mt) –July/June 35 Table 5.7: world supply and demand for the main oils (Mt) 36 Table 5.8: FOB prices of the main oils ($/t) 37 Table 5.9: EU supply and demand balance sheet for the 4 main vegetable oils * 2010/11, 2011/12 and 2012/13 (Mt) 38 Table 6.1: soymeal imports in the EU27 (Mt) 39 Table 6.2: prices of the main soymeal and sunmeal origins dated 23/04/12 ($/t) 39 Table 6.3: changes in industrial animal feed production in EU countries xxx voir période xxx 40 Table 6.4: demand for soymeal, rapemeal and sunmeal in industrial animal feeds* and on-farm feeds* (October-September) 42 Table 6.5 EU soymeal balance sheets – October-September 2012/13 and 2011/12 (kt) 43 Table 6.6: EU rapemeal balance sheets – July-June 2012/13 and 2011/12 (kt) 44 Table 6.7: EU sunmeal balance sheets – August-July 2012/13 and 2011/12 (kt) 44 Table 6.8: World soymeal balance sheets – October-September 2010/11, 2011/12, 2012/13 (Mt) 45 S t r a t é g i e g r a i n s — O i l s e e d R e p o r t 1 — 26 A p r i l 2012
  • 3. EU production of rapeseed & sunseed 3 Production • Winterkill and damage on oilseed rape revised up sharply in Germany, Poland and France since last month • Rapeseed yield revised down in main producer countries due to frost and drought in the southeastern EU countries • Rapeseed production revised down sharply (-1.5 Mt) to 17.6 Mt in 2012 • Large fall in sunflower area in Spain due to drought, but increase in several countries due to replanting of lost winter crop fields • Sunseed production still expected at 8.1 Mt in 2012 • Soybean production expected down slightly compared with 2011/12 Oilseed rape Rapeseed production now expected sharply down on previous years Crop year 2012/13 oilseed rape. in Romania, Bulgaria and Hungary and At the start of the crop year, good conditions Meanwhile in the north EU countries, rains prevented plant emergence in some fields. at planting time in Germany and Denmark A mild autumn in Europe in most countries at planting time and attractive margins caused a decline in oilseed rape acreage. allowed the rapeseed plants to develop more in France, UK and Poland generated an In the southeast EU, a severe autumn drought quickly than normal and raised the possibility increase in oilseed rape plantings. Farmers restricted oilseed rape plantings. This drought that the plants would exit the rosette stage too in the central EU countries also planted more continued through the start of the winter early. During this stage of the growth cycle, the Table 1.1: Oilseed rape planted areas, yields and production Area (kha) Yield (t/ha) Production (kt) ∆ / prev. 2009/10 2010/11 2011/12 2012/13 2009/10 2010/11 2011/12 2012/13 2009/10 2010/11 2011/12 2012/13 month Germany 1471 1461 1328 1280 4.28 3.90 2.94 3.38 6301 5697 3904 4324 -466 Belgium-Lux 14 16 17 17 4.17 3.83 4.29 4.04 60 61 73 69 0 Denmark 163 167 151 101 3.91 3.48 3.36 3.63 638 580 508 366 0 Spain 22 21 31 32 1.60 1.82 1.98 1.89 35 38 62 61 0 France 1481 1465 1556 1528 3.77 3.29 3.45 3.19 5589 4815 5368 4874 -571 Greece 4 8 7 7 1.50 1.50 1.50 1.50 6 12 10 10 0 Ireland 6 8 9 10 3.76 3.51 4.10 4.02 24 28 35 38 0 Italy 25 20 19 16 2.04 2.47 2.34 2.45 50 50 44 39 0 The Netherl. 3 3 2 2 4.54 4.38 3.44 4.05 12 12 7 8 0 Portugal 0 0 0 0 0 0 0 0 United Kingd. 570 642 705 761 3.35 3.47 3.91 3.52 1912 2230 2756 2682 121 Austria 57 54 53 53 3.01 3.17 3.35 3.29 171 171 179 173 0 Finland 81 158 91 79 1.73 1.13 1.26 1.38 140 179 115 109 -19 Sweden 98 109 99 106 3.04 2.57 2.70 2.65 298 280 266 281 0 Poland 810 946 827 713 3.08 2.36 2.23 2.38 2497 2229 1847 1700 -404 Hungary 261 259 233 171 2.41 2.05 2.26 2.20 630 531 527 377 -42 Czech Republic 355 369 373 386 3.18 2.83 2.80 2.92 1128 1042 1046 1128 -59 Slovakia 166 164 145 96 2.32 1.97 2.43 2.28 387 322 353 218 -11 Estonia 82 98 89 88 1.66 1.33 1.61 1.70 136 131 144 149 -26 Latvia 93 111 121 119 2.19 2.05 1.81 2.07 205 226 219 246 0 Lithuania 192 252 253 241 2.17 1.65 1.81 1.82 416 417 458 439 0 Slovenia 4 6 5 6 2.23 2.68 2.92 2.58 10 16 14 15 0 Cyprus/Malta 0 0 0 0 0 0 0 0 Romania 442 506 384 54 1.59 1.95 1.73 1.51 702 986 664 81 -5 Bulgaria 108 186 219 95 2.17 2.93 2.37 2.17 235 545 519 207 -55 EU 27 6509 7027 6717 5959 3.32 2.93 2.85 2.95 21580 20597 19119 17593 -1539 S t r a t é g i e g r a i n s — O i l s e e d R e p o r t 1 — 26 A p r i l 2012
  • 4. EU production of rapeseed & sunseed 4 plants have a high degree of resistance Graphic 1.1: variation in water balance March. There was some rainfall in to the cold, but once grown out of it, compared with the norm for period: the first half of April, but most EU they are more vulnerable. The risk September 1 2011 through April 19 2012 countries are currently suffering of frost damage and winterkill was from a low to record-low water therefore higher than normal even balance (see graphic 1.1). Rainfall as soon as winter started. levels in the coming weeks will need Freezing conditions finally arrived to be closely monitored. In central at the end of January. With little or Europe, the drought has coincided no snow in much of east and central with very sharp temperature swings Europe, there was significant damage between sub-zero temperatures at to the crops. In Bulgaria and Romania, night and positive temperatures the depth of the snow blanket varied during the day. This phenomenon ended in the week of April 16-20 as sharply from place to place because of temperatures began to increase. This extremely high winds. The oilseed rape kind of weather scenario during the plants in these countries were already spring (rains following severe drought) in a vulnerable condition because of could cause an increased risk of disease, the dry conditions at planting time notably rapeseed blackspot disease and hence were less able to resist the (Alternaria). This situation will need cold. to be closely monitored. With the resumption of plant growth With the oilseed rape plants currently in most rapeseed-growing countries, flowering in most EU producer since March we have gradually got Source: MARS JRC countries, weather conditions are more accurate picture of winterkill/ at present not ideal for pollination crop damage: Graphic 1.2: Rapeseed production in because temperatures are too low. However,  Romania and Bulgaria – according to the EU27 (Mt) given the rapeseed plants’ good capacity for current estimates, respectively 80 % and recovery, it is too early to further decrease our 60 % of winter rapeseed acreage has been yield forecasts as a result of this. impacted since this year’s crop was planted; We currently estimate oilseed rape area  Slovakia - 40 % of winter rapeseed in the EU at 6 Mha, down 0.8 Mha from plantings will no longer be harvested, the level of 2011/12 (this will be the lowest either due to the autumn drought of the 20,6 19,1 acreage since 2006). 17,6 freezing spell; We currently expect EU rapeseed yield at 2.95  Poland – damage is estimated at 25 % of t/ha (2.85 t/ha in 2011/12). Yield in many acreage (compared with 9 % in 2011/12); countries has been reduced to take into account  Czech Republic - damage is estimated at 8 the fields which were impacted by the freezing % of acreage; conditions but will not be replanted and for  Austria - 6 % of acreage will be replanted; 2010/11 2011/12 2012/13 which yield potential is therefore reduced. We  Germany – winterkill will force farmers to currently expect rapeseed production in the replant 5 % of winter rapeseed acreage; Bourgogne and Champagne-Ardenne (10 EU at 17.6 Mt (19.1 Mt in 2011/12). This will % replanted in each). be the lowest level since the harvest of 2006.  France – around 3 % of acreage will need If the weather continues to be very unfavourable to be replanted. Damage is mostly centred The weather has been extremely dry across for oilseed rape development, yield could fall to on Lorraine (20 % to be replanted), Europe since the end of winter and through 2.81 t/ha, as in 2007/08, with EU production Table 1.3: Changes to main arable crop areas (EU27) at 16.7 Mt. By contrast, if yields were reasonable (with good conditions from now until harvest commercial crop years areas (kha) time), it might still be possible to obtain a yield 2009/10 2010/11 2011/12 2012/13 Total cereals 58 230 55 360 55 570 55 780 of 3 t/ha and a harvest of 18 Mt. Total oilseeds (included crops grown on set-aside) 11 210 11 670 11 920 11 150 N.B: Subscribers to the Oilseed crop module Total protein crops 1 190 1 510 1 390 1 250 on our website www. strategie-grains.com may Silage 5 310 5 530 5 730 6 050 consult our full area, yield and production EU set-aside & fallow land (non food crops exclud.) 6 050 6 670 5 940 6 190 of which EU 15 set-aside 4 060 4 330 3 990 4 240 estimates with historical database and forecasts Sugar beet 1 600 1 580 1 630 1 650 by country and crop year. Total area cultivated + set-aside * 83 590 82 320 82 180 82 070 S t r a t é g i e g r a i n s — O i l s e e d R e p o r t 1 — 26 A p r i l 2012
  • 5. EU production of rapeseed & sunseed 5 Sunflower and soybean Sunflower area expected to increase again in 2012/13 Crop year 2012/13 Graphic 1.3: Sunseed production in Graphic 1.4: Soybean production in Like the other spring crops, sunflower area the EU27 (Mt) the EU27 (Mt) is expected to increase because farmers will replant winter crop fields lost or destroyed because of drought or cold with spring crops. We currently estimate that sunflower area will increase from 4.2 Mha in 2011 to 4.3 Mha in 2012, which will be the highest level since the 8,3 8,1 1,3 6,9 1,2 1,2 harvest of 2003. The countries where sunflower area will increase most sharply are Romania (+150 kha), Bulgaria (+30 kha), Slovakia (+ 30 kha), 2010/11 2011/12 2012/13 2010/11 2011/12 2012/13 Czech Republic (+20 kha) and France (+15 kha). In Spain, the current drought is forcing We currently expect sunseed yield in the place in France and Spain and in the southeast farmers to leave fields unplanted instead of EU at 1.9 t/ha (1.97 t/ha in 2011/12), with EU countries. sowing sunflower, because expected sunseed production at 8.1 Mt (8.3 Mt in 2011/12). We estimate soybean area in the EU at 430 yields are too low to definitively guarantee a The increase in acreage will not be sufficient kha (down 20 kha compared with 2011/12). profit. Sunflower area is therefore expected to offset the relative fall in yield compared with With yield estimated at 2.8 t/ha (2.92 t/ha in sharply down on last year (-170 kha) in Spain, last year’s excellent results. 2011/12), the harvest is expected at 1.2 Mt in at 680 kha. Sunflower plantings are currently taking 2012/13 (1.3 Mt in 2011/12). Table 1.2: Sunflower planted areas, yields and production Area (kha) Yield (t/ha) Production (kt) ∆ / prev. 2009/10 2010/11 2011/12 2012/13 2009/10 2010/11 2011/12 2012/13 2009/10 2010/11 2011/12 2012/13 month Germany 24 25 27 29 2.41 1.89 1.99 2.17 57 47 53 64 12 Spain 851 698 858 682 1.02 1.22 1.21 1.18 870 850 1035 804 -177 France 725 695 741 756 2.37 2.36 2.54 2.47 1720 1641 1885 1867 44 Greece 24 64 66 69 1.20 2.53 1.69 1.62 28 161 112 112 0 Italy 124 101 118 114 2.26 2.12 2.32 2.31 280 213 274 262 9 Portugal 21 14 15 15 0.52 0.54 1.02 0.69 11 8 15 10 0 United Kingd. 1 1 1 1 2.00 2.00 2.00 2.00 2 2 2 2 0 Austria 26 25 26 26 2.74 2.62 2.83 2.72 71 67 74 71 0 Poland 2 2 2 2 1.78 1.52 1.78 1.78 4 3 4 4 0 Hungary 535 502 574 585 2.35 1.93 2.38 2.40 1256 970 1368 1406 0 Czech Republic 26 27 29 51 2.38 2.11 2.48 2.39 61 57 71 123 55 Slovakia 83 83 90 107 2.26 1.81 2.45 2.38 187 150 219 255 32 Romania 766 791 985 1132 1.43 1.60 1.82 1.57 1098 1263 1792 1779 23 Bulgaria 662 648 682 709 1.89 2.19 2.03 1.95 1250 1419 1385 1381 0 oth. Countries 0 0 0 0 1.45 2.34 2.61 1.84 0 0 1 1 0 EU 27 3869 3676 4213 4281 1.78 1.86 1.97 1.90 6896 6851 8290 8140 -2 S t r a t é g i e g r a i n s — O i l s e e d R e p o r t 1 — 26 A p r i l 2012
  • 6. European Union Rapeseed balances 6 European Union Rapeseed balances • EU rapeseed production expected sharply down in 2012 to 17.6 Mt • Crush volume expected down sharply in 2012/13 –rapeseed imports limited by lack of global availability • EU rapeseed stock expected down to 0.9 Mt and global stock to 4.9 Mt at end-2012/13 • Extremely tight outlook for new crop year Supply and internal demand 2011/12: crush volume in EU expected at 21.5 Mt – 2012/13: production and crush activity expected down sharply Crop year 2011/12 compared with 2010/11. crush volume in the EU is estimated down Rapeseed imports from Ukraine are currently to 21.5 Mt in 2011/12 (-1 Mt compared with Production forecast at 960 kt (-50 kt compared with last 2010/11). Since the start of crop year 2011/12, EU rapeseed production in 2011 remains month and -250 kt compared with 2010/11). the crush margin average in Hamburg is slight- estimated at 19.1 Mt. It has increased very Rapeseed imports from other Black Sea coun- ly above 20 €/t, which is also the case on the slightly (+20 kt) since last month due to an in- tries (Russia, Moldova and Kazakhstan) are last quarter of the campaign. There are thus crease for production in France. expected up at 125 kt (+35 kt compared with around 10 €/t below last year, and about 20 €/t Most of the reduction compared with 2010 last month; +55 kt compared with 2010/11). below 2009/10. (-1.5 Mt, see Production) corresponds to small- We forecast a sharp rise in imports from Aus- Likewise, rapeseed crush margins in Rouen are er harvests in Germany (-1.8 Mt), Poland (-380 tralia to 1.63 Mt (+0.1 Mt compared with currently low, and have on occasion dropped kt), north EU countries (-150 kt in total) and last month; +0.6 Mt compared with last year). as low as 30 €/t (on crushed seed) and are at Romania (-320 kt); these falls are partly offset Rapeseed exports recorded from Australia around 40 €/t averaged for the entire crop year, by increases in France and Britain (+550 kt and are high (around 300 kt per month since De- which is 10 €/t below the averaged value in +530 kt respectively). cember), and should arrive in 2011/12. This 2010/11. The current margin is around 30 €/t estimate has an increase potential if shipments spot/near-term. N.B: Subscribers to the “EU crop – Oilseed” We have increased estimated crush volume arrive more quickly than expected. module on our website www.strategie-grains.com in the EU by 50 kt since last month; crush is Canadian rapeseed exports to the EU are also may consult our full area, yield and production revised up 180 kt in the Netherlands (to 1.16 forecast up in 2011/12, although on a smaller estimates with historical database and forecasts scale, to 275 kt (no change since last month, Mt) but this is partly offset by reductions in by country and crop year. +60 kt vs. 2010/11). Canadian rapeseed can- Germany (-100 kt to 7.3 Mt) and Spain (-20 Imports not be used in all EU countries because it com- kt to 90 kt). These adjustments are made to Our forecasts now include the latest available prises GM content, which limits its access to reflect the latest statistics for crush demand, oil the EU market. Portugal and France are the production and/or imports. customs statistics for crop year 2011/12 (Feb- main importers of Canadian rapeseed: Por- Industrial rapeseed usage is expected down ruary 2012 for EU trade with third countries). tugal had imported 150 kt as of February 29 in most other EU countries compared with Given recorded imports shown in these sta- 2012 and we expect that the EU will import an 2010/11, most notably France (-465 kt to 4 tistics and current price spreads between EU additional 95 kt from Canada by the end of the Mt), Germany (-325 kt to 7.3 Mt) and Poland rapeseed and other main export origins, EU crop year. However, Canadian statistics do not (-210 kt to 2 Mt). However, it is expected up rapeseed imports from third countries are show any exports to the EU since December; in the Netherlands (+150 kt) and the United- now forecast at 3 Mt in 2011/12, up 0.46 Mt our estimate therefore has a decrease potential Graphic 2.1: rapeseed crush demand Table 2.1: breakdown of EU rapeseed in the event that exports do not pick up. in the EU (Mt) imports by country of origin Since last month, we have increased our fore- kt 09/10 10/11 11/12 12/13 cast for EU rapeseed imports (+90 kt), notably 22.5 Ukraine 1371 1209 960 850 for Germany to 350 kt and France to 370 kt Other CIS 328 69 125 300 21.5 (+30 kt each); there are also smaller increases Australia 314 1035 1625 1525 (+10/15 kt) for the Netherlands (to 1 Mt) and 20.5 Canada 95 216 275 400 Others 39 46 51 40 Poland (to 280 kt). Total 2147 2575 3036 3115 Demand for industrial usage Source: Stratégie grains (based on data 2010/11 2011/12 2012/13 Due to limited supply and low rape oil pro- from Eurostats) duction margins (see graphic 2.2), rapeseed S t r a t é g i e g r a i n s — O i l s e e d R e p o r t 1 — 26 A p r i l 2012
  • 7. European Union Rapeseed balances 7 Table 2.2: rapeseed balance sheet July-June 2012/13 and 2011/12 (kt) imports grains exports animal consump. seeds, waste and overseas usage July-June ex-farm sales requirement 2012/13 from EU 27 production compound to non-EU from non- free stock of which: to EU 27 carry-out on-farm demand surplus/ carry-in supply deficit crush stock stock total feed feed EU Ger. 319 4324 3508 2786 621 8050 406 6 7000 227 10 217 0 7639 411 -130 538 Bel/L 77 69 904 525 1576 392 1100 10 0 10 0 1502 74 -10 85 Den. 16 366 324 37 743 154 0 501 60 0 60 0 714 29 -10 39 Spn. 22 61 31 0 114 5 0 90 0 0 95 20 10 7 Fra-new. 206 4874 4808 210 548 5839 1629 11 3984 47 60 5731 108 -200 306 Gre. 0 10 2 10 23 0 20 0 0 20 3 0 2 Irl. 4 38 6 2 50 18 29 0 0 47 3 0 2 Ita. 2 39 45 4 90 10 1 75 0 0 86 4 0 6 Neth. 219 8 484 846 1557 517 0 935 23 0 1476 81 10 72 Por. 14 0 5 194 212 1 197 0 0 198 14 0 15 U.K. 143 2682 128 23 2976 715 1 2102 38 0 38 0 2857 119 -40 162 Aust. 28 173 173 206 9 417 62 1 348 5 0 5 0 416 1 -30 27 Fin. 15 109 122 11 257 0 0 250 5 0 5 0 255 2 -20 19 Swed. 7 281 61 2 350 30 0 310 5 0 5 0 345 5 -20 24 Pol. 106 1700 163 216 2185 243 0 1880 17 0 17 0 2141 44 -100 145 Hun. 10 377 204 13 605 412 1 180 0 7 600 5 -10 14 Cz.R. 37 1128 107 3 1275 355 1 900 0 0 1256 20 -50 69 Slk. 22 218 138 7 385 289 95 0 0 384 1 -10 7 Est. 9 149 48 1 208 137 68 0 0 0 0 206 2 0 5 Lat. 3 246 45 22 314 197 110 7 0 7 0 314 1 -10 8 Lit. 9 439 49 20 517 279 235 0 0 514 3 -10 18 Sln. 5 15 8 1 29 24 4 0 0 0 0 28 1 0 0 Cyp. 0 0 0 0 0 0 0 0 0 0 0 0 0 Mal. 1 0 0 0 1 0 0 0 0 0 1 0 0 Rom. 7 81 126 1 215 145 5 60 0 0 210 5 0 5 Bul. 2 207 2 0 211 185 1 19 0 0 205 6 0 1 EU 27 1284 17593 6205 3115 28197 6205 28 20491 444 67 27236 962 -630 1576 imports grains exports animal consump. seeds, waste and overseas usage July-June ex-farm sales requirement 2011/12 from EU 27 production compound to non-EU from non- free stock of which: to EU 27 carry-out on-farm demand surplus/ carry-in supply deficit crush stock stock total feed feed EU Ger. 310 3904 3087 3534 348 8096 232 8 7311 227 10 217 0 7777 319 -240 562 Bel/L 122 73 891 620 1706 384 0 1230 15 0 15 0 1629 77 -20 95 Den. 9 508 192 70 779 169 0 509 85 0 85 0 762 16 -20 39 Spn. 4 62 51 0 116 4 0 90 0 0 94 22 20 7 Fra. 220 5368 5302 352 370 6310 1930 16 4000 97 89 8 60 6103 206 -100 308 Gre. 3 10 2 9 25 0 24 0 0 24 0 0 2 Irl. 11 35 5 3 55 25 25 0 0 50 4 0 2 Ita. 7 44 31 6 88 11 0 75 0 0 86 2 0 6 Neth. 214 7 634 995 1850 451 0 1156 23 0 1631 219 130 89 Por. 14 0 7 237 258 1 243 0 0 244 14 -10 19 U.K. 121 2756 62 2 2941 660 0 2080 58 0 58 0 2798 143 -20 160 Aust. 34 179 179 182 12 408 69 0 305 5 0 5 0 379 28 10 23 Fin. 21 115 116 18 270 0 0 250 5 0 5 0 255 15 0 19 Swed. 27 266 41 2 336 13 0 311 5 0 5 0 329 7 -20 24 Pol. 59 1847 209 280 2396 275 0 1987 27 0 27 0 2290 106 -50 153 Hun. 8 527 371 14 920 698 1 205 0 7 910 10 -10 16 Cz.R. 53 1046 104 2 1204 270 0 897 0 0 1167 37 -30 69 Slk. 17 353 208 12 591 404 165 0 0 569 22 10 13 Est. 5 144 1 1 150 81 60 0 0 0 0 141 9 0 5 Lat. 17 219 51 27 314 204 100 7 0 7 0 311 3 -10 8 Lit. 16 458 46 4 524 263 252 0 0 515 9 -10 19 Sln. 15 14 3 1 33 22 6 0 0 0 0 28 5 0 0 Cyp. 0 0 0 0 0 0 0 0 0 0 0 0 0 Mal. 1 0 0 0 1 0 0 0 0 0 1 0 0 Rom. 20 664 102 0 787 555 30 195 0 0 780 7 -10 15 Bul. 19 519 3 0 541 476 44 19 0 0 539 2 0 1 EU 27 1346 19119 7197 3036 30698 7197 100 21495 554 67 29413 1284 -380 1653 S t r a t é g i e g r a i n s — O i l s e e d R e p o r t 1 — 26 A p r i l 2012
  • 8. European Union Rapeseed balances 8 Kingdom (+65 kt). other countries, notably Graphic 2.2: rapeseed crush margins in the Netherlands (-180 kt), Hamburg (€/t seeds) Other usage Belgium (-95 kt) and Po- 100,0 2009/10 2010/11 No change this month: Rapeseed consump- land (-65 kt, due to lower 2011/12 2012/13 tion for animal feed and other uses remains imports from Ukraine). forecast at 620 kt in 2011/12. 80,0 These estimates are provisional and will be Crop year 2012/13 amended as the year un- 60,0 folds to reflect harvest Production volumes and spreads be- 40,0 Rapeseed production in the EU27 is now tween the prices of EU expected at 17.6 Mt, sharply down on last and other world rapeseed year’s level (-1.53 Mt compared with 2011/12 20,0 origins. - see Production). Since last month, we have sharply reduced our harvest forecasts for N.B: Subscribers to our 0,0 France (-570 kt to 4.88 Mt), Poland (-405 kt online “EU trade with jul sept nov jan march may to 1.7 Mt) and Germany (-465 kt to 4.32 Mt). third countries” module These reductions mostly correspond to higher can consult the full trade this month reduced projected crush volumes than previously expected levels of winterkill/ breakdown for 2011/12 and 2012/13 (for each in Germany (-320 kt), Poland (-300 kt), France damage. Production is still forecast higher than origin and destination) at our website strategie- (-250 kt) and Belgium (-200 kt). Crush in Ro- last year in the UK (+120 kt to 2.68 Mt). Since grains.com”. mania (-25 kt) and Bulgaria (-20 kt) was again last month, our estimate for rapeseed pro- Demand for industrial usage revised down. duction in 2012 has decreased by 1.54 Mt. Rapeseed crush volume in the EU is ex- Compared with 2011, rapeseed production is pected down sharply in 2012/13 to 20.5 Other usage expected sharply down in Romania (-585 kt), Mt (-1 Mt compared with 2011/12). Our Rapeseed consumption for animal feed and Bulgaria (-345 kt), France (-500 kt), UK (-195 first estimates for crush margins, based on cur- other uses is forecast lower than the level of kt), Poland (-150 kt), Hungary (-150 kt) and rently quoted prices (prices on futures markets 2011/12 at 545 kt, with decreases compared Slovakia (-135 kt). After the unfavourable and prices for oils and meals delivered in the with last year for France (-50 kt) and Denmark weather impact of 2011, production is ex- new crop year) indicate margins potentially at pected up in Germany (+0.5 Mt to 4.4 Mt); it (-25 kt) due to sharply reduced availabilities. around 30 €/t in France, 20-25 €/t in the UK, should also increase slightly in Czech Republic and in Germany between 15 €/t (in Neuss) Since last month, we have decreased other (+80 kt) and Latvia (+25 kt). and 20 €/t (in Hamburg). These levels are rapeseed usages in France (-100 kt) to reflect Imports around 10 €/t less than averaged values in the lower harvest forecast. EU rapeseed imports in 2012/13 are expect- 2011/12 and in some places will not be suffi- ed up slightly compared with 2011/12 (+80 cient to cover fixed produc- kt) at 3.12 Mt (see table 2.1). Despite high tion costs. Hence these crush Graphic 2.3: comparison between rapeseed and demand in the EU, this increase is fairly small margins are extremely low. sunseed crush margins in France (€/t seeds) and stems from reduced supplies elsewhere in The reduction in crush vol- the world (see below: World market). umes will impact several EU 150 Compared with 2011/12 (Table 2.1), we fore- countries, notably Germany (-300 kt), Netherlands (-220 130 rape cast small reductions in imports from Australia (-100 kt to 1.53 Mt) and Ukraine (-110 kt to kt), Belgium (-130 kt), Po- 110 850 kt). The other Black Sea countries could land (-105 kt) and Romania sun 90 export around 300 kt to the EU (+175 kt no- (-135 kt). Since last month, we have 70 tably from Belarus, assuming an end to export restrictions in that country). Canada could also sharply reduced our estimate 50 export slightly more in 2012/13 to the EU for crush volume in the EU 30 (+125 kt to 400 kt). by 1.3 Mt; this reflects the We forecast higher import volumes in Ger- lower harvest forecast, high- 10 many (+275 kt to 620 kt) and France (+180 kt er prices and the fall in mar- -10 to 545 kt), but lower import volumes in most gins (see above). We have S t r a t é g i e g r a i n s — O i l s e e d R e p o r t 1 — 26 A p r i l 2012
  • 9. European Union Rapeseed balances 9 Prices comparison dated 20/04/2012  New increase for rapeseed prices Table 2.3 shows the main price changes since On most market points last month. Graphic 2.4: Euronext prices (€/t) in the EU, the higher In Germany, the C&F Hamburg price in- world soybean price and 525 creased sharply, rising almost 35 €/t since last the sharp fall in expected Rapeseed price May 12 month to 505 €/t. The delivered Neuss and rapeseed production (€/t) Aug 12 500 Rostock prices both rose by 18 €/t to 500 €/t pushed prices upward in Nov 12 and 492 €/t respectively. conjunction with a new Rapeseed prices in France also rose sharply: the 475 decline in the value of the FOB Moselle price rose 22 €/t to 500 €/t and euro against the dollar (to the FOB Rouen price by 26 €/t to 488 €/t. In 1.31 $/€, down from 1.32 450 the UK, the rapeseed price also followed this last month). trend increasing by 25 €/t (+10 £/t with ster- French and UK prices 425 ling up slightly against the euro). The Hungar- evolved in the same ian price rose slightly in Budapest (almost by 20 manner and hence the 400 €/t). competitive spread be- Table 2.3: rapeseed prices in main EU tween the two origins is 375 countries dated 20/04/2012 unchanged. Hungarian Jul Aug Sep Oct Nov Dec Jan Feb Mar Apr May 2011 2011 2011 2011 2011 2011 2012 2012 2012 2012 2012 Mar. 23 Apr. 20 evolution rapeseed’s competitive- c&f Hamburg 470.5 505.1 34.6 7,4% ness improved slightly delivered Neuss/Hamm 482.0 500.0 18.0 3,7% again. (+26.5 €/t), and 474.25 €/t for November rendu Rostock 474.0 492.0 18.0 3,8% On Euronext on April 20 2012, rapeseed (+21 €/t). Contrary to last month, new crop Fob Moselle 477.0 500.0 23.0 4,8% closed at 501.25 €/t for May (+20 €/t com- prices rose more sharply than old crop prices delivered Rouen 462.0 488.0 26.0 5,6% pared with last month), 484.5 €/t for August and hence the inverse spread has narrowed. c&f South UK 469.9 493.2 23.3 5,0% Intra-EU rapeseed trade Trade volume in 2011/12 still expected at record high — 1 Mt reduction for 2012/13 Crop year 2011/12 are also forecast up in Hungary (+195 kt) and Crop year 2012/13 Our forecasts now include the latest statistics Slovakia (+70 kt), with increased tranship- Based on our current harvest forecasts and esti- published for crop year 2011/12 (February ment of east-EU rapeseeds to Germany. By mates for industrial demand for rapeseeds (no- 2012 for France and Spain, and January 2012 contrast, rapeseed imports are forecast lower tably for crush), we expect a 1 Mt reduction for the other countries). The volume of intra- than last year in France (-150 kt), UK (-70 kt), in the volume of intra-EU rapeseed trade EU rapeseed trade in 2011/12 is now ex- Romania (-105 kt) and Belgium (-75 kt). in 2012/13 to 6.2 Mt. The better harvest in pected at 7.2 Mt, down 70 kt compared with Rapeseed exports are forecast up sharply Germany and the very sharp falls in produc- last month. This fall corresponds to a lower from France (+710 kt to 1.9 Mt), from the tion in Romania and Bulgaria will significantly forecast for Dutch exports (-95 kt to 510 kt), UK (+230 kt to 660 kt) and from Hungary alter the pattern of trade between the east and and to a smaller extent, UK exports (-10 kt). By (+250 kt). Dutch exports are also forecast up west EU. contrast, we have increased projected exports (+185 kt), as are Belgian exports (+85 kt); Compared with 2011/12, German imports from Czech Republic and Bulgaria (+15 kt these increases correspond to transhipments are expected down 720 kt to 2.8 Mt; we also and +10 kt respectively). from third countries to other EU countries. forecast smaller import requirements for the On the import side, we have revised down pro- Exports are expected sharply down from Ro- Netherlands (-150 kt), France (-140 kt), Hun- jected import volumes in Germany (-105 kt) mania (-320 kt) and Poland (-105 kt), due to gary (-165 kt) and Slovakia (-70 kt). Imports but increased projected imports in Hungary, the smaller harvests in these countries. are expected up compared with last year in Belgium and Poland (around +10 kt each). These forecasts will be subject to variation over Denmark (+130 kt), UK (+65 kt) and in sev- Compared with 2010/11, imports are still the coming months to reflect trade statistics eral other countries (Estonia, Austria, Sweden). forecast sharply up in Germany at 3.53 Mt and changes in price spreads between the dif- German exports are expected up 175 kt com- (+1.44 Mt compared with 2010/11). Imports ferent origins. pared with 2011/12, mainly to Scandinavia; S t r a t é g i e g r a i n s — O i l s e e d R e p o r t 1 — 26 A p r i l 2012
  • 10. European Union Rapeseed balances 10 Table 2.4: intra-EU rapeseed trade 2012/13 and 2011/12 (kt) origins destinations 2012/13 Ger. B/L Den. Spn. Fra. Gre. Irl. Ita.Neth. Por. U.K. Aust. Fin. Swe. Pol. Hun. Cze. Slk. Est. Lat. Lit. Sln. Cyp. Mal. Rom. Bul. EU Ger. 33 83 0 19 0 0 2 55 0 55 18 50 3 32 2 41 4 0 0 1 7 0 0 1 0 406 B/L 313 0 4 29 0 0 0 45 0 0 0 0 0 0 0 0 0 0 0 0 0 0 0 0 0 392 Den. 117 0 0 4 0 0 0 5 0 4 0 15 7 0 0 0 0 0 0 1 0 0 0 0 0 154 Spn. 0 0 0 3 0 0 0 0 2 0 0 0 0 0 0 0 0 0 0 0 0 0 0 0 0 5 Fra. 844 405 129 10 0 1 1 192 3 33 0 0 5 1 1 0 0 0 0 0 0 0 0 2 1 1629 Gre. 0 0 0 0 0 0 0 0 0 0 0 0 0 0 0 0 0 0 0 0 0 0 0 0 0 0 Irl. 0 5 0 0 0 0 0 3 0 10 0 0 0 0 0 0 0 0 0 0 0 0 0 0 0 18 Ita. 1 1 2 0 2 0 0 1 0 0 0 0 0 0 0 0 0 0 0 0 0 0 0 3 0 10 Neth. 353 121 0 15 9 0 0 0 0 16 0 0 0 2 0 0 0 0 0 0 0 0 0 0 0 517 Por. 0 0 0 1 0 0 0 0 0 0 0 0 0 0 0 0 0 0 0 0 0 0 0 0 0 1 U.K. 181 215 19 0 123 0 5 0 109 0 0 7 31 26 0 0 0 0 0 0 0 0 0 0 0 715 Aust. 35 0 0 0 0 0 0 10 0 0 0 0 0 0 2 6 7 0 0 0 0 0 0 0 0 62 Fin. 0 0 0 0 0 0 0 0 0 0 0 0 0 0 0 0 0 0 0 0 0 0 0 0 0 0 Swed. 1 0 26 0 0 0 0 0 0 0 0 0 1 1 0 0 0 0 0 0 0 0 0 0 0 30 Pol. 224 0 0 0 0 0 0 0 0 0 0 0 0 0 9 8 1 0 0 0 0 0 0 0 0 243 Hun. 179 0 0 0 0 0 0 9 9 0 0 127 0 0 8 6 60 0 0 0 0 0 0 14 0 412 Cz.R. 265 0 0 0 0 0 0 0 0 0 0 6 0 0 16 8 60 0 0 0 0 0 0 0 0 355 Slk. 7 0 0 0 0 0 0 0 0 0 0 47 0 0 27 167 41 0 0 0 0 0 0 0 0 289 Est. 85 0 9 0 0 0 0 0 4 0 7 0 20 10 0 0 0 0 1 1 0 0 0 0 0 137 Lat. 75 8 25 1 5 0 0 0 7 0 0 0 15 4 8 0 0 0 2 46 0 0 0 0 0 197 Lit. 73 37 21 0 4 0 0 0 1 0 1 0 13 0 40 0 0 0 46 43 0 0 0 0 0 279 Sln. 0 0 0 0 0 0 0 17 0 0 0 3 0 0 0 3 0 1 0 0 0 0 0 0 0 24 Cyp. 0 0 0 0 0 0 0 0 0 0 0 0 0 0 0 0 0 0 0 0 0 0 0 0 0 0 Mal. 0 0 0 0 0 0 0 0 0 0 0 0 0 0 0 0 0 0 0 0 0 0 0 0 0 0 Rom. 30 34 0 0 12 2 0 4 34 0 2 4 0 0 2 11 4 5 0 0 0 0 0 0 1 145 Bul. 4 44 10 0 0 0 0 0 21 0 0 0 0 0 0 0 0 0 0 0 0 0 0 0 105 185 EU 2786 904 324 31 210 2 6 45 484 5 128 206 122 61 163 204 107 138 48 45 49 8 0 0 126 2 6205 origins destinations 2011/12 Ger. B/L Den. Spn. Fra. Gre. Irl. Ita.Neth. Por. U.K. Aust. Fin. Swe. Pol. Hun. Cze. Slk. Est. Lat. Lit. Sln. Cyp. Mal. Rom. Bul. EU Ger. 25 14 0 28 0 0 2 65 0 8 3 14 3 35 0 27 4 0 0 0 2 0 0 1 0 232 B/L 318 0 9 21 0 0 0 36 0 0 0 0 0 0 0 0 0 0 0 0 0 0 0 0 0 384 Den. 144 0 0 2 0 0 0 0 0 1 0 14 6 0 0 0 0 0 0 0 0 0 0 0 0 169 Spn. 0 0 0 3 0 0 0 0 1 0 0 0 0 0 0 0 0 0 0 0 0 0 0 0 0 4 Fra. 1203 466 6 12 0 1 1 189 7 33 0 0 4 1 1 0 0 0 0 0 0 0 0 2 1 1930 Gre. 0 0 0 0 0 0 0 0 0 0 0 0 0 0 0 0 0 0 0 0 0 0 0 0 0 0 Irl. 0 10 0 0 0 0 0 6 0 9 0 0 0 0 0 0 0 0 0 0 0 0 0 0 0 25 Ita. 1 3 1 0 2 0 0 1 0 0 0 0 0 0 0 0 0 0 0 0 0 0 0 4 0 11 Neth. 374 52 0 2 10 0 0 0 0 10 0 0 0 3 0 0 0 0 0 0 0 0 0 0 0 451 Por. 0 0 0 1 0 0 0 0 0 0 0 0 0 0 0 0 0 0 0 0 0 0 0 0 0 1 U.K. 313 18 14 0 127 0 4 0 127 0 0 7 24 27 0 0 0 0 0 0 0 0 0 0 0 660 Aust. 41 0 0 0 0 0 0 7 0 0 0 0 0 0 3 12 4 0 0 0 0 0 0 0 0 69 Fin. 0 0 0 0 0 0 0 0 0 0 0 0 0 0 0 0 0 0 0 0 0 0 0 0 0 0 Swed. 1 0 8 0 0 0 0 0 0 0 0 0 1 3 0 0 0 0 0 0 0 0 0 0 0 13 Pol. 247 0 0 0 0 0 0 0 0 0 0 0 0 0 13 15 1 0 0 0 0 0 0 0 0 275 Hun. 380 0 0 0 0 0 0 5 5 0 0 113 0 0 5 10 162 0 0 0 0 0 0 17 0 698 Cz.R. 209 0 0 0 0 0 0 0 0 0 0 4 0 0 15 16 27 0 0 0 0 0 0 0 0 270 Slk. 21 0 0 0 0 0 0 0 0 0 0 53 0 0 31 261 38 0 0 0 0 0 0 0 0 404 Est. 22 0 19 0 0 0 0 0 0 0 1 0 36 0 0 0 0 0 0 3 0 0 0 0 0 81 Lat. 55 5 49 3 1 0 0 0 5 0 0 0 26 3 16 0 0 0 1 42 0 0 0 0 0 204 Lit. 49 32 33 0 1 0 0 0 7 0 0 0 18 0 73 0 0 0 0 50 0 0 0 0 0 263 Sln. 0 0 0 0 0 0 0 11 0 0 0 5 0 0 0 4 0 1 0 0 0 0 0 0 0 22 Cyp. 0 0 0 0 0 0 0 0 0 0 0 0 0 0 0 0 0 0 0 0 0 0 0 0 0 0 Mal. 0 0 0 0 0 0 0 0 0 0 0 0 0 0 0 0 0 0 0 0 0 0 0 0 0 0 Rom. 71 236 0 0 39 2 0 5 115 0 0 3 0 0 2 73 1 9 0 0 0 0 0 0 0 555 Bul. 85 45 48 23 117 0 0 0 78 0 0 0 0 0 0 0 0 1 0 0 0 0 0 0 79 476 EU 3534 891 192 50 352 2 5 31 634 7 62 182 116 41 209 371 104 208 1 51 46 3 0 0 102 3 7197 S t r a t é g i e g r a i n s — O i l s e e d R e p o r t 1 — 26 A p r i l 2012
  • 11. European Union Rapeseed balances 11 Czech exports are expected up 85 kt. However, and Romania (-40 kt), partly offset by higher ferent origins. The forecasts will be amended we envisage a sharp decline for Romanian ex- import forecasts for the UK (+70 kt) and the during the coming months to reflect the latest ports to just 145 kt (-410 kt), and Bulgarian Netherlands (+55 kt). These changes have a available data. exports to just 185 kt (-290 kt), due to the very downward impact compared with last month small harvests forecasts for 2012 in these coun- on exports form the central EU countries (-170 N.B: Subscribers to our online “Intra-EU tries. Lastly, French exports are expected down kt) and from Bulgaria (-35 kt). Trade” web module can consult the full break- 300 kt to 1.63 Mt. These forecasts will be subject to very signifi- down of intra-EU rapeseed trade (including We have reduced our intra-EU trade forecast cant variations over the coming months to re- by 115 kt since last month. This results from flect harvest outcomes in the EU and globally, recorded and projected volumes for each country) lower import forecasts for Germany (-55 kt) and changes in price spreads between the dif- at our website strategie-grains.com. World rapeseed market 2011/12: fall in demand too low to prevent lower ending stock — 2012/13: new expected reduction in world stocks Sharp rise in world rapeseed crude oil also fell slightly to 102 $ a barrel on evolved in the same manner, and competitive April 19. spreads are therefore almost unchanged. prices As of April 20, the C&F Hamburg rapeseed Since last month, rapeseed prices have risen price was 661 $/t (+38 $/t since last month). Ending stock 2011/12 expect- sharply due to the impact from the soybean The price of Canadian canola rose by about 30 ed down despite lower crush market and the lower rapeseed production US$/t to around 628 US$/t (after an increase demand forecasts for the EU in 2012. The price of of 40 $/t last month). The Canadian price re- mains therefore close to Global rapeseed availabilities down Graphic 2.5: world rapeseed prices (US $/t) the C&F Hamburg price 2.7 Mt vs. 2010/11 after having spent much Ending stock 2011/12 is currently estimat- Ukrainian Rapeseed Fob Odessa of the crop year so far be- ed at 5.7 Mt, down 0.5 Mt compared with $/t Canadian Canola Fob Vancouver low it (see graphic 2.5). end-2010/11. Carry-in stock is estimated 1.5 Rapeseed Europe Cif Hamburg The price of Australian Mt less than at the start of 2010/11, and world 750 rapeseed was relatively flat rapeseed production is set to decline for the 650 this month at around 490 second consecutive year to 59.1 Mt (-1.2 Mt vs. US$/t (-2 $/t); Australian 2010/11). 550 export availability remains Since last month, we have increased projected high, at around 1 Mt, see world production by 0.4 Mt, mostly in India 450 below. (+0.3 Mt) where the harvest has turned out As last month, Ukrainian better than previously expected. As mentioned 350 and Bulgarian rapeseed last month, the largest falls in rapeseed produc- 250 are no longer quoted for tion compared with last year concern the EU old crop deliveries. (-1.5 Mt), India (-1.1 Mt), China (-0.6 Mt) and Apart from Australian the USA (-0.4 Mt). By contrast, production is rapeseed, the prices of the up sharply in Canada (+1.4 Mt) and Australia other world origins have (+0.6 Mt). Despite a smaller harvest than last year in Ukraine, the Black Sea countries in- Table 2.5 estimated rapeseed balance sheets for creased production by 0.3 Mt overall, this in- Ukraine, Canada and Australia (July/June) crease mainly in Russia. Ukraine Canada Australia Global rapeseed supply in 2011/12 is esti- Mt 10/11 11/12 12/13 10/11 11/12 12/13 10/11 11/12 12/13 mated down 2.7 Mt in 2011/12 compared carry-in stocks 0,0 0,0 0.1 2.3 1.8 0.9 0.4 0.6 0.5 with 2010/11 to 65.3 Mt (+0.4 Mt compared production 1,5 1,4 0.9 12.8 14.2 14.9 2.4 2.9 2.9 with last month). There is little change this imports 0,0 0,0 0.0 0.2 0.1 0.1 0.0 0.0 0.0 month to our crush demand estimate, which is exports 1,4 1,2 0.9 7.1 8.0 7.6 1.5 2.2 2.1 expected down 2.4 Mt at the global level com- consumption 0,1 0,1 0.1 6.4 6.8 7.4 0.8 0.9 0.8 pared with last year, with reductions of 1.5 Mt carry-out st. 0,0 0,1 0.1 1.8 0.9 0.9 0.6 0.5 0.4 in India, 1 Mt in the EU, 250 kt in China, 230 source: Stratégie grains (based on various sources) kt in Japan, 125 kt in Turkey, and 175 kt in the S t r a t é g i e g r a i n s — O i l s e e d R e p o r t 1 — 26 A p r i l 2012
  • 12. European Union Rapeseed balances 12 USA. These falls are linked to smaller harvests than in 2010/11 in China (+0.7 Mt), the EU Table 2.6: world rapeseed/canola (China, India, EU, USA), or lower imports (+0.4 Mt), the USA (+0.2 Mt due to smaller balance sheet (July/June) (Japan, Turkey). Crush demand is expected up harvest) and Pakistan (+0.1 Mt). Several coun- Mt 10/11 11/12 12/13 in Canada (+0.4 Mt compared with 2010/11) tries will import less than in 2010/11, notably carry-in stocks 7.8 6.2 5.4 due to the larger harvest. Rapeseed usage is also Japan (-0.2 Mt), Mexico (-0.1 Mt) and Turkey production 60.3 59.1 60.2 expected up in Russia (+0.2 Mt). (-0.1 Mt). These falls will be offset by increased trade 10.7 11.9 11.2 Compared with last month, we have increased usage of other oilseeds that are currently cheap- consumption 61.8 59.9 60.7 our estimates for crush demand by 0.2 Mt with er, or by a decline in total oilseed usage. of which feed 2.4 2.9 2.6 carry-out st. 6.2 5.4 4.9 India (+0.3 Mt in line with larger harvest), Japan (+250 kt) and China (+100 kt); these World market set to remain tight stocks-to-use ratio 10% 9% 8% increases are partly offset by reductions in other We estimate global rapeseed ending stock at 5.4 Mt, which equals just 9 % of total an- source: Stratégie grains (based on various sources) countries. Demand for rapeseed for human/indus- nual demand (compared with 10.1 % at end- 2010/11 and 12.8 % at end-2009/10). The kha in Canada, and +100 kha in Australia) to trial usages in 2011/12 is estimated at 57 Mt reflect the latest available statistics and/or price (+0.2 Mt compared with last month); it is set percentage has fallen slightly since last month (-0.3 %), and this situation should support increases. to be lower than last year in most parts of the The increase compared with last year mostly world. prices until the end of the crop year. The out- look therefore remains tight. The sharp fall in relates to production growth in India (+1.2 Animal feed and other usages are still forecast Mt) and China (+0.8 Mt), due to an improve- to increase (+0.5 Mt compared with 2010/11) demand will not be severe enough to prevent a decrease in stock. This is bullish in terms of ment in yields after last year’s disappointing to 2.9 Mt, mostly due to increased harvest in results. We also forecast harvest increases for Canada. prices, which will need to keep rising in order to maintain the squeeze on crush demand. In Canada (+0.7 Mt) and the USA (+0.4 Mt); World trade revised up addition, rapeseed prices could be subject to due to increased area; meanwhile production Our trade estimates now include customs sta- further bullish influence from the very tight is expected stable in Australia (acreage higher tistics for February 2012 for Ukraine, Canada, soybean market, and the markets for crushed than last year but yields lower following the Australia, USA and EU. World rapeseed trade seed products (oils and meals): if the prices for exceptional results of 2011/12). By contrast, in 2010/11 is now estimated at 11.8 Mt, up these products increased, the price of seeds will production is set to fall in the EU (see Produc- more than 1 Mt compared with 2010/11. have to increase similarly in order to keep pres- tion) and the Black Sea (-0.5 Mt), especially in Since last month we have increased our sure on margins. Rape oil and rape meal prices Ukraine, where the harvest is expected at less world trade forecast by 0.5 Mt; this increase will also be influenced by the global soybean than 1 Mt. concerns Canadian exports only. As of Febru- market (see EU Soybean – World Market) and Global opening stock is expected down 0.8 Mt ary 29, Canada had already exported 6.4 Mt of by the world economic conditions in the com- compared with 2011/12: the projected rise in rapeseed, including 1 Mt in January and 800 ing months. The price of crude oil price will global rapeseed availabilities is therefore small kt in February. We forecast that it will ship a remain a key factor, with propensity to change (+0.3 Mt). We estimate global rapeseed sup- further 1.6 Mt before the end of the crop year, sharply in response to geopolitical considera- ply at 65.6 Mt, down 1.1 Mt compared with with the pace of exports slowing (to around tions in the Middle East. last month. 400 kt per month). The price of Canadian Demand is expected up 0.8 Mt compared canola has effectively risen sharply since Febru- Very tight outlook for with 2011/12 (+1.1 Mt for crush and human ary, which should reduce demand for Cana- consumption and -0.3 Mt in animal feeds): the 2012/13 dian canola. However, given the high volume growth in rapeseed crush mostly concerns In- of seeds already shipped, we have increased our World production set to increase dia and China (+1.1 Mt and +0.8 Mt respec- estimate this month. slightly in 2012 tively, due to better harvests). Crush demand The higher forecast for Canadian exports im- We estimate world rapeseed production in is also expected up in the Black Sea countries pacts on import volumes for Japan (+280 kt), 2012/13 at 60.2 Mt, up 1.15 Mt compared (+0.1 Mt in Russia) and Canada (+0.2 Mt). China (+100 kt), Mexico (+70 kt), Pakistan with 2011/12. We have reduced this harvest Demand for rapeseed in animal feeds is expect- and Bangladesh (+50 kt each). forecast by 1 Mt since last month, reflecting ed to decrease slightly, mainly in the EU (due to Australian exports are unchanged at 2.2 Mt the smaller expected harvests in the EU (-1.5 lower production). (1.17 Mt shipped as of February 29). Mt) and Ukraine (-250 kt), where winter Thus for the end of 2012/13, we forecast a Exports are expected higher than in losses were higher than previously expected, further reduction in global rapeseed stock 2010/11 from Canada (+0.9 Mt), Australia and where spring rape plantings are lower than by around 0.5 Mt to just 4.9 Mt or 8.2% of (+0.7 Mt), and Russia (+0.2 Mt). By con- previously envisaged due to the late arrival of annual global demand (compared with 5.1 Mt trast, we forecast lower export volumes than spring this year. These reductions are partly or 8.3 % estimated last month). This is even in 2010/11 from Ukraine (-0.27 Mt), the EU offset by increased production forecasts for lower than the previous record low level at end- (-0.1 Mt, due to lower availabilities in Romania Canada (+500 kt) and Australia (+200 kt): 2007/08 (8.4% of annual demand). The out- and Bulgaria). Imports are expected higher acreage in these countries estimated up (+235 look is therefore extremely tight; this should S t r a t é g i e g r a i n s — O i l s e e d R e p o r t 1 — 26 A p r i l 2012