Download as PDF, PPTX
![Wave-Energy’s Characteristics
The Process Conversion of Wave’s Potential and Kinetic energy into
Electrical energy.
Constantly generated.
Do not deplete
Notable More depict able and reliable as a source of energy
Characteristics Can be harnessed close to the shoreline, offshore, or
anywhere in-between.
Good forecast ability.
With 12 m/s wave velocity, 10hrs or more forecast ability.
Significance Estimated that 0.2% of Ocean’s untapped energy could
provide power sufficient for the entire world ! [1]
[1] Ocean Wave energy Current Status and Future Prospective by João Cruz 3](https://image.slidesharecdn.com/mt5009oceanwaveenergyfinalsubmission-120419215758-phpapp02/75/ELectricity-from-Ocean-Waves-3-2048.jpg)
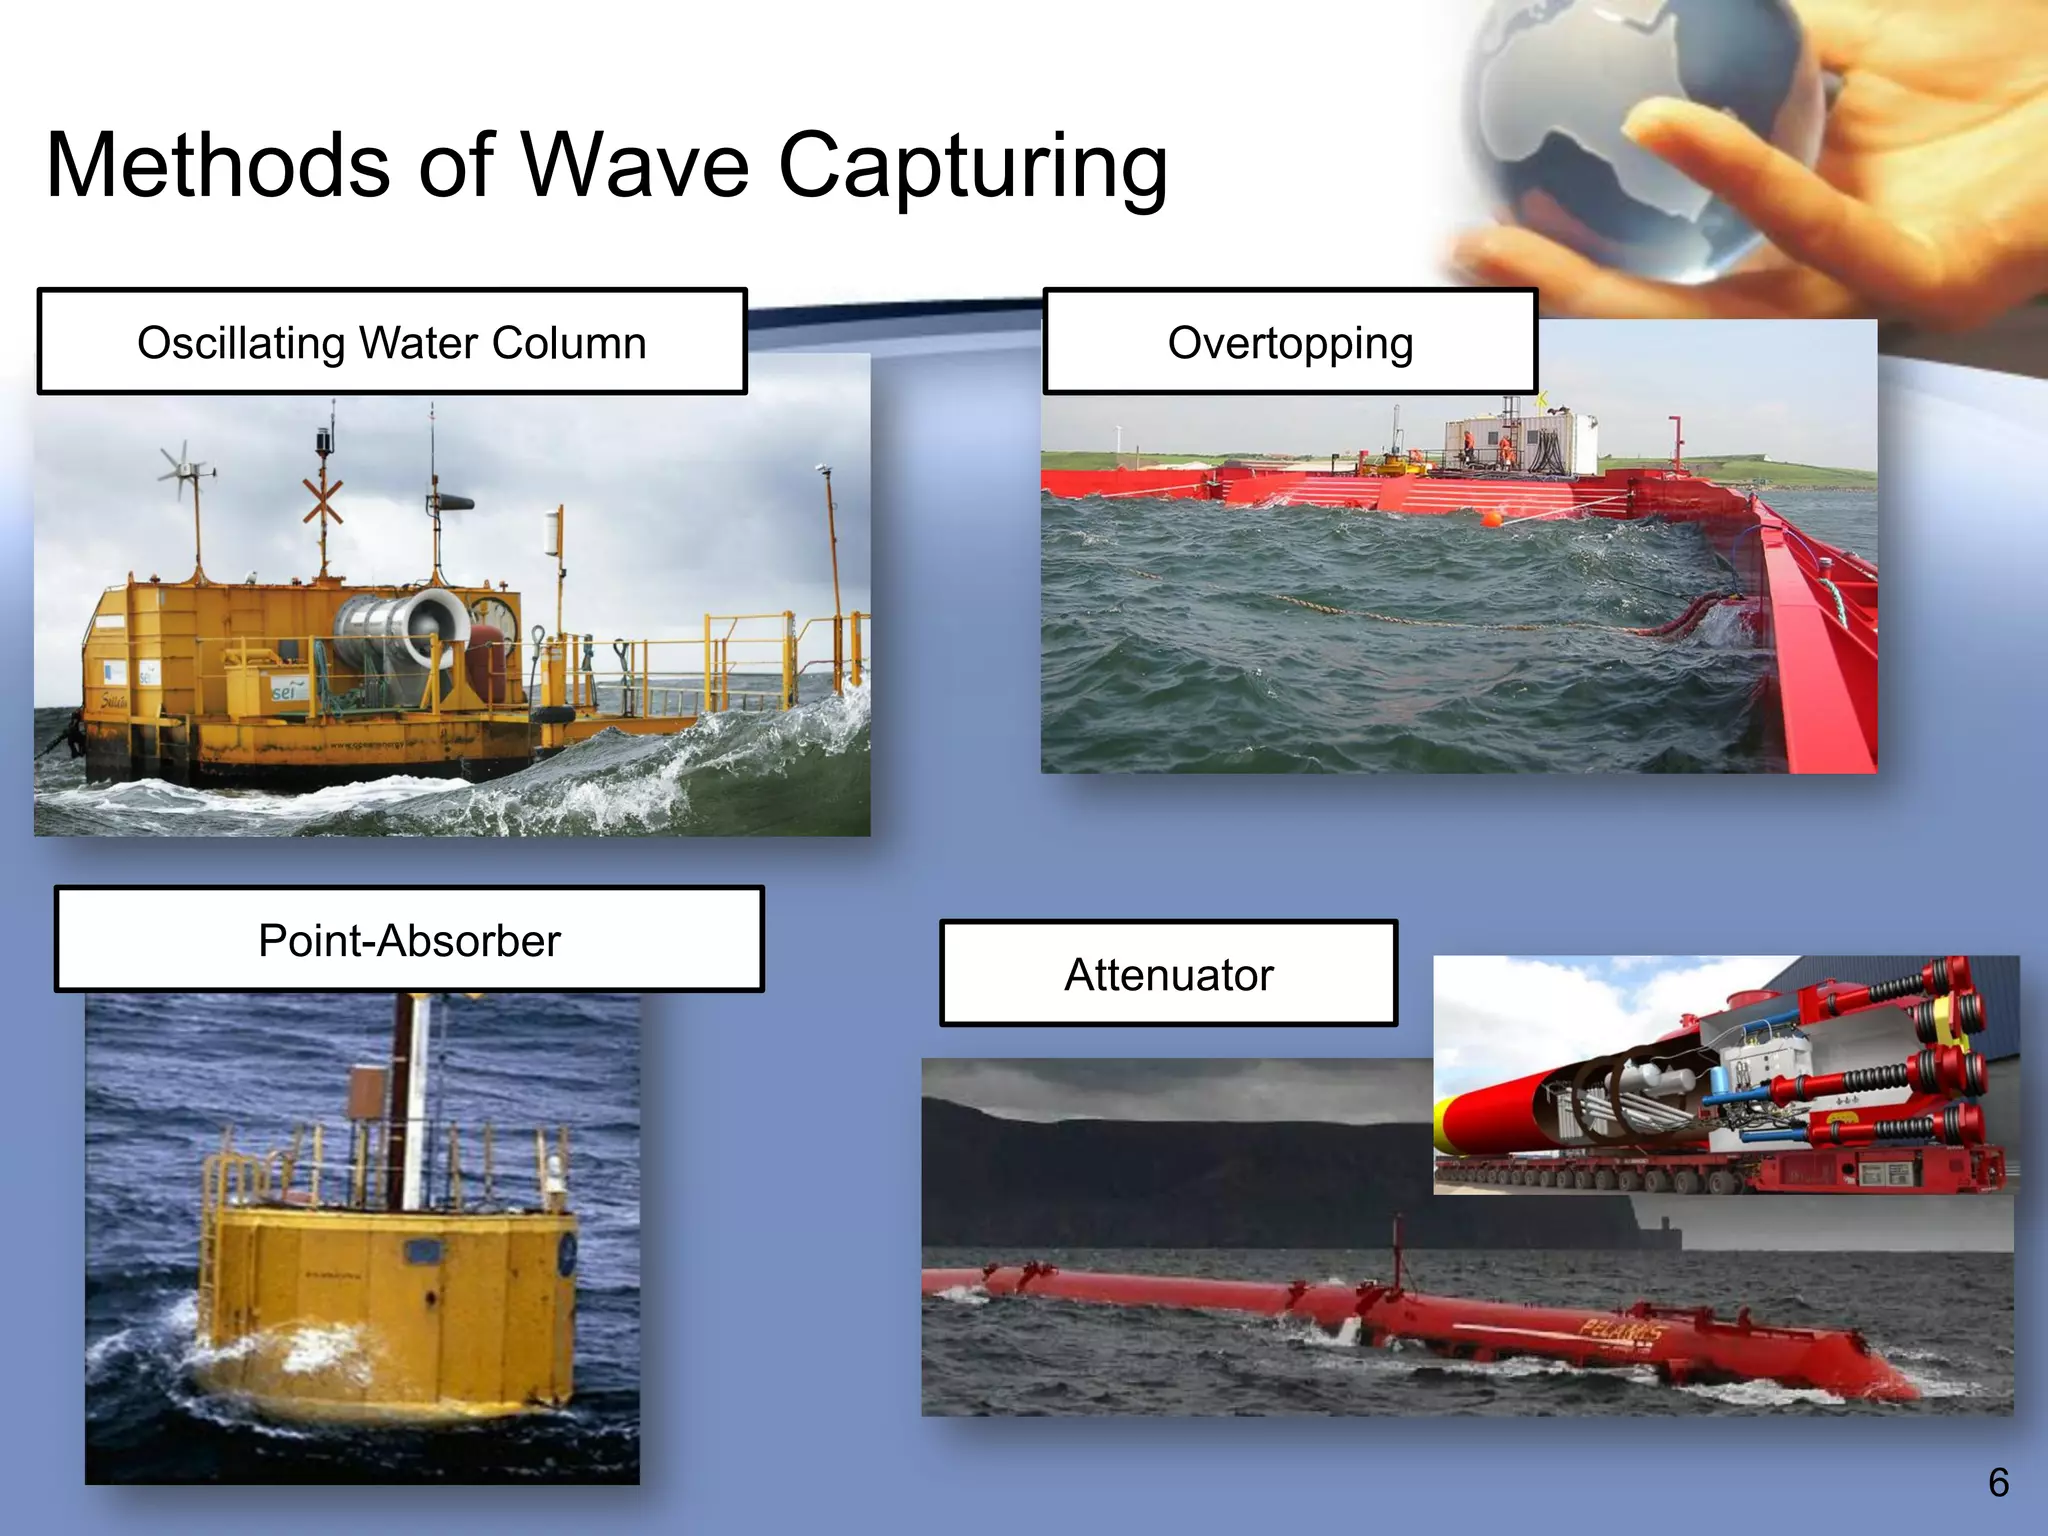
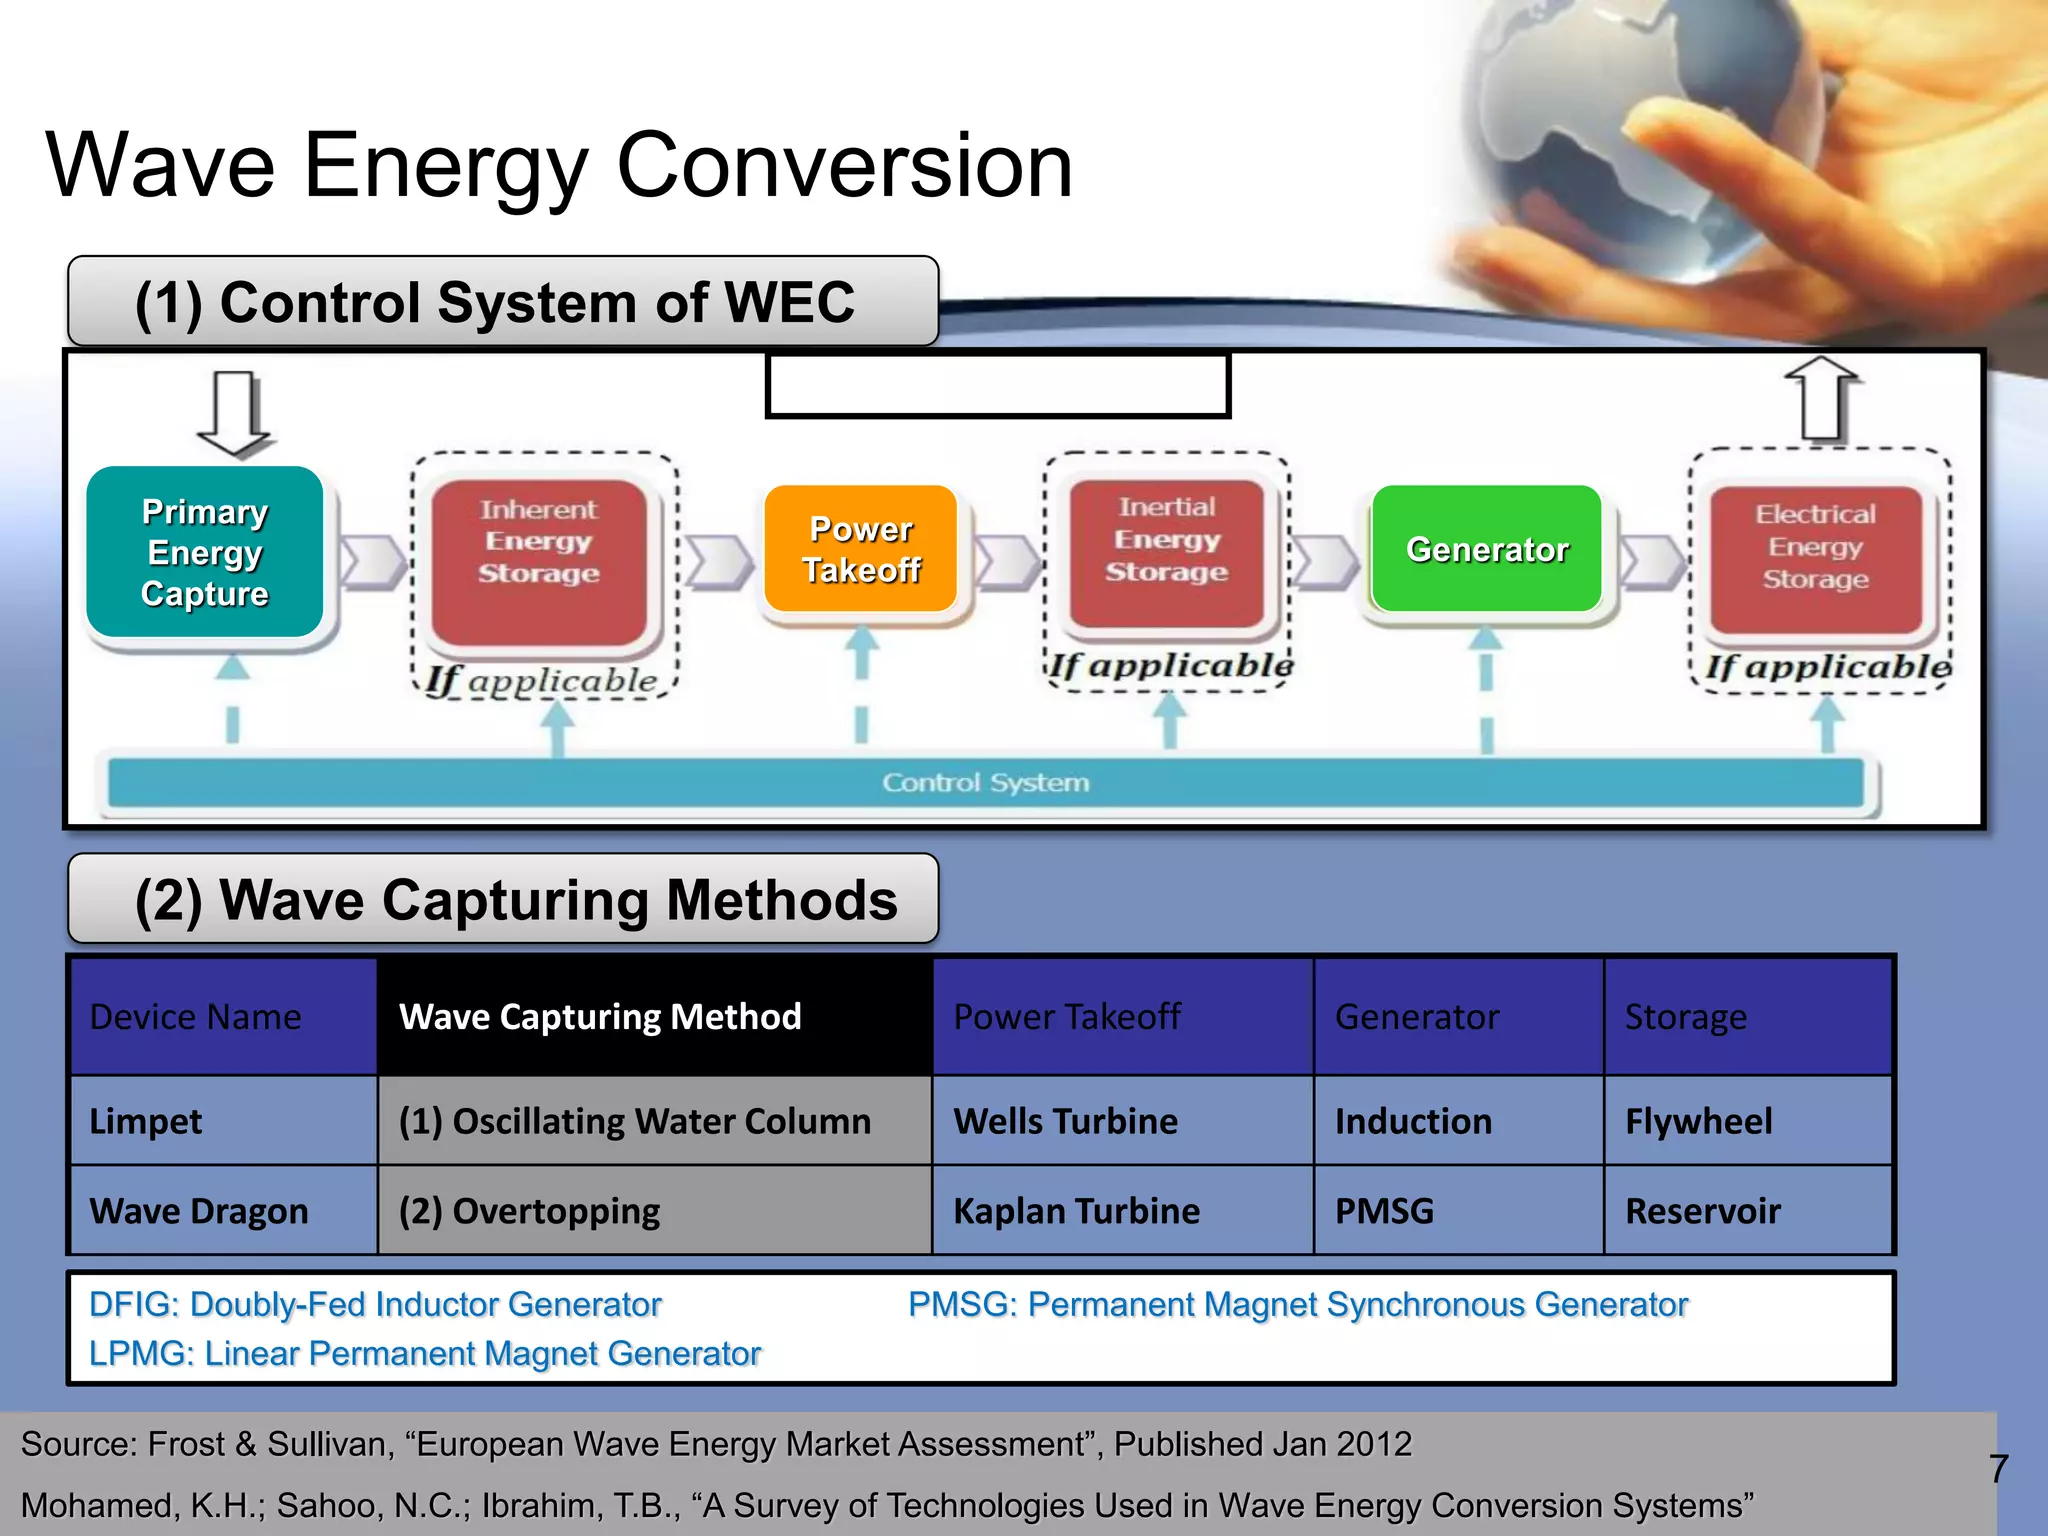
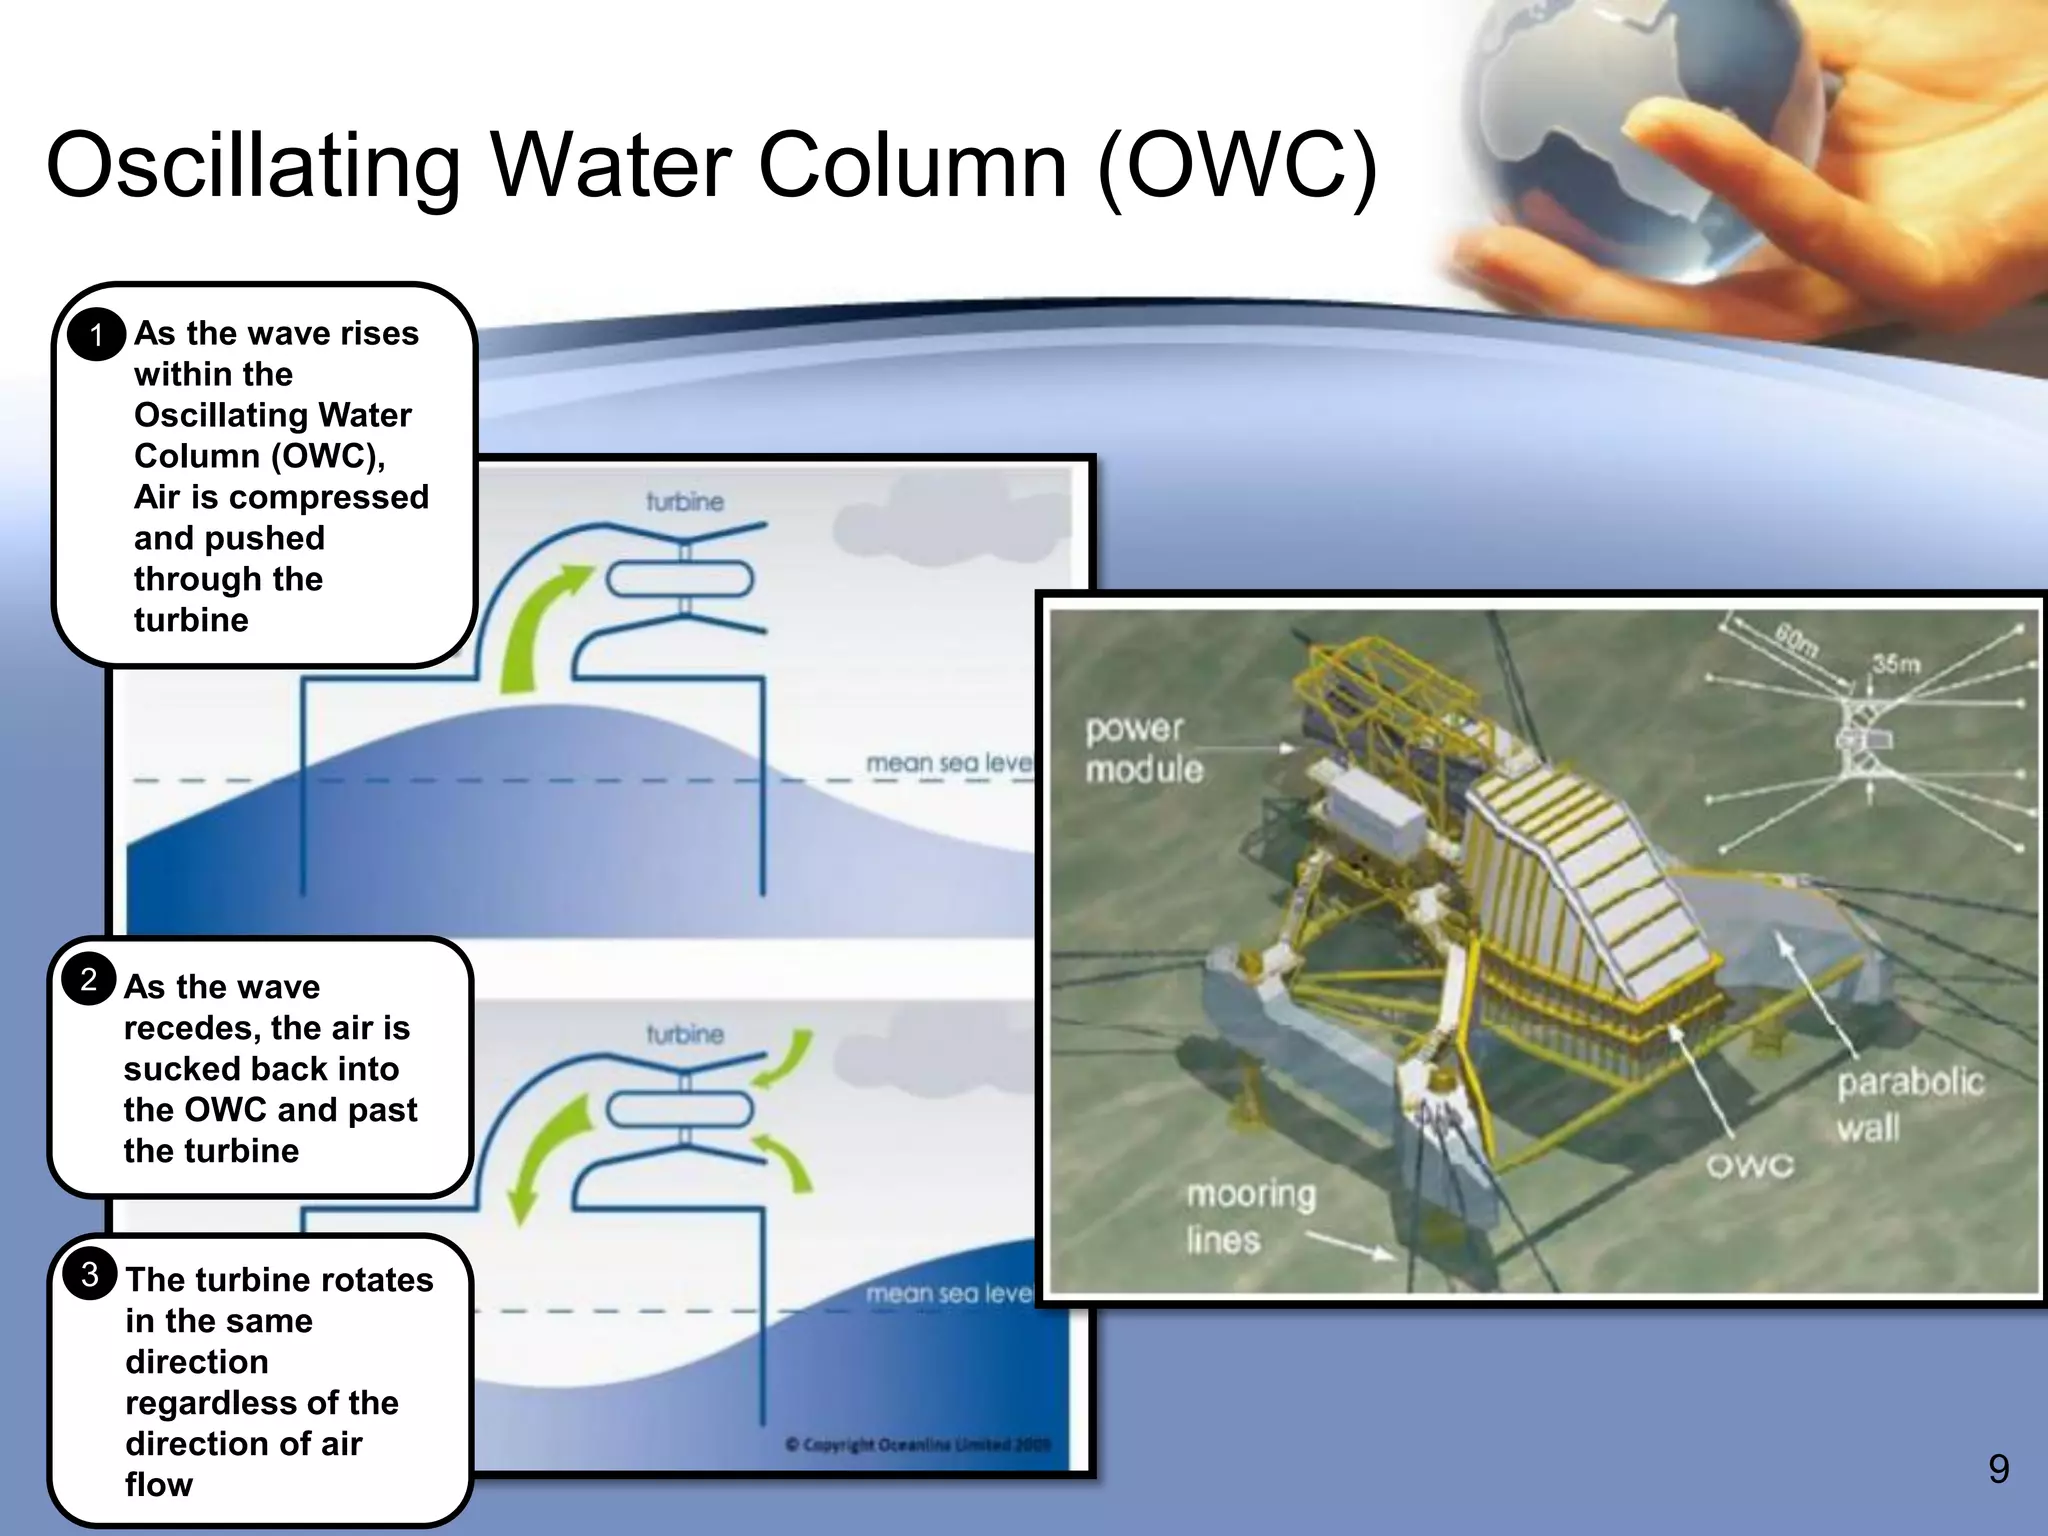
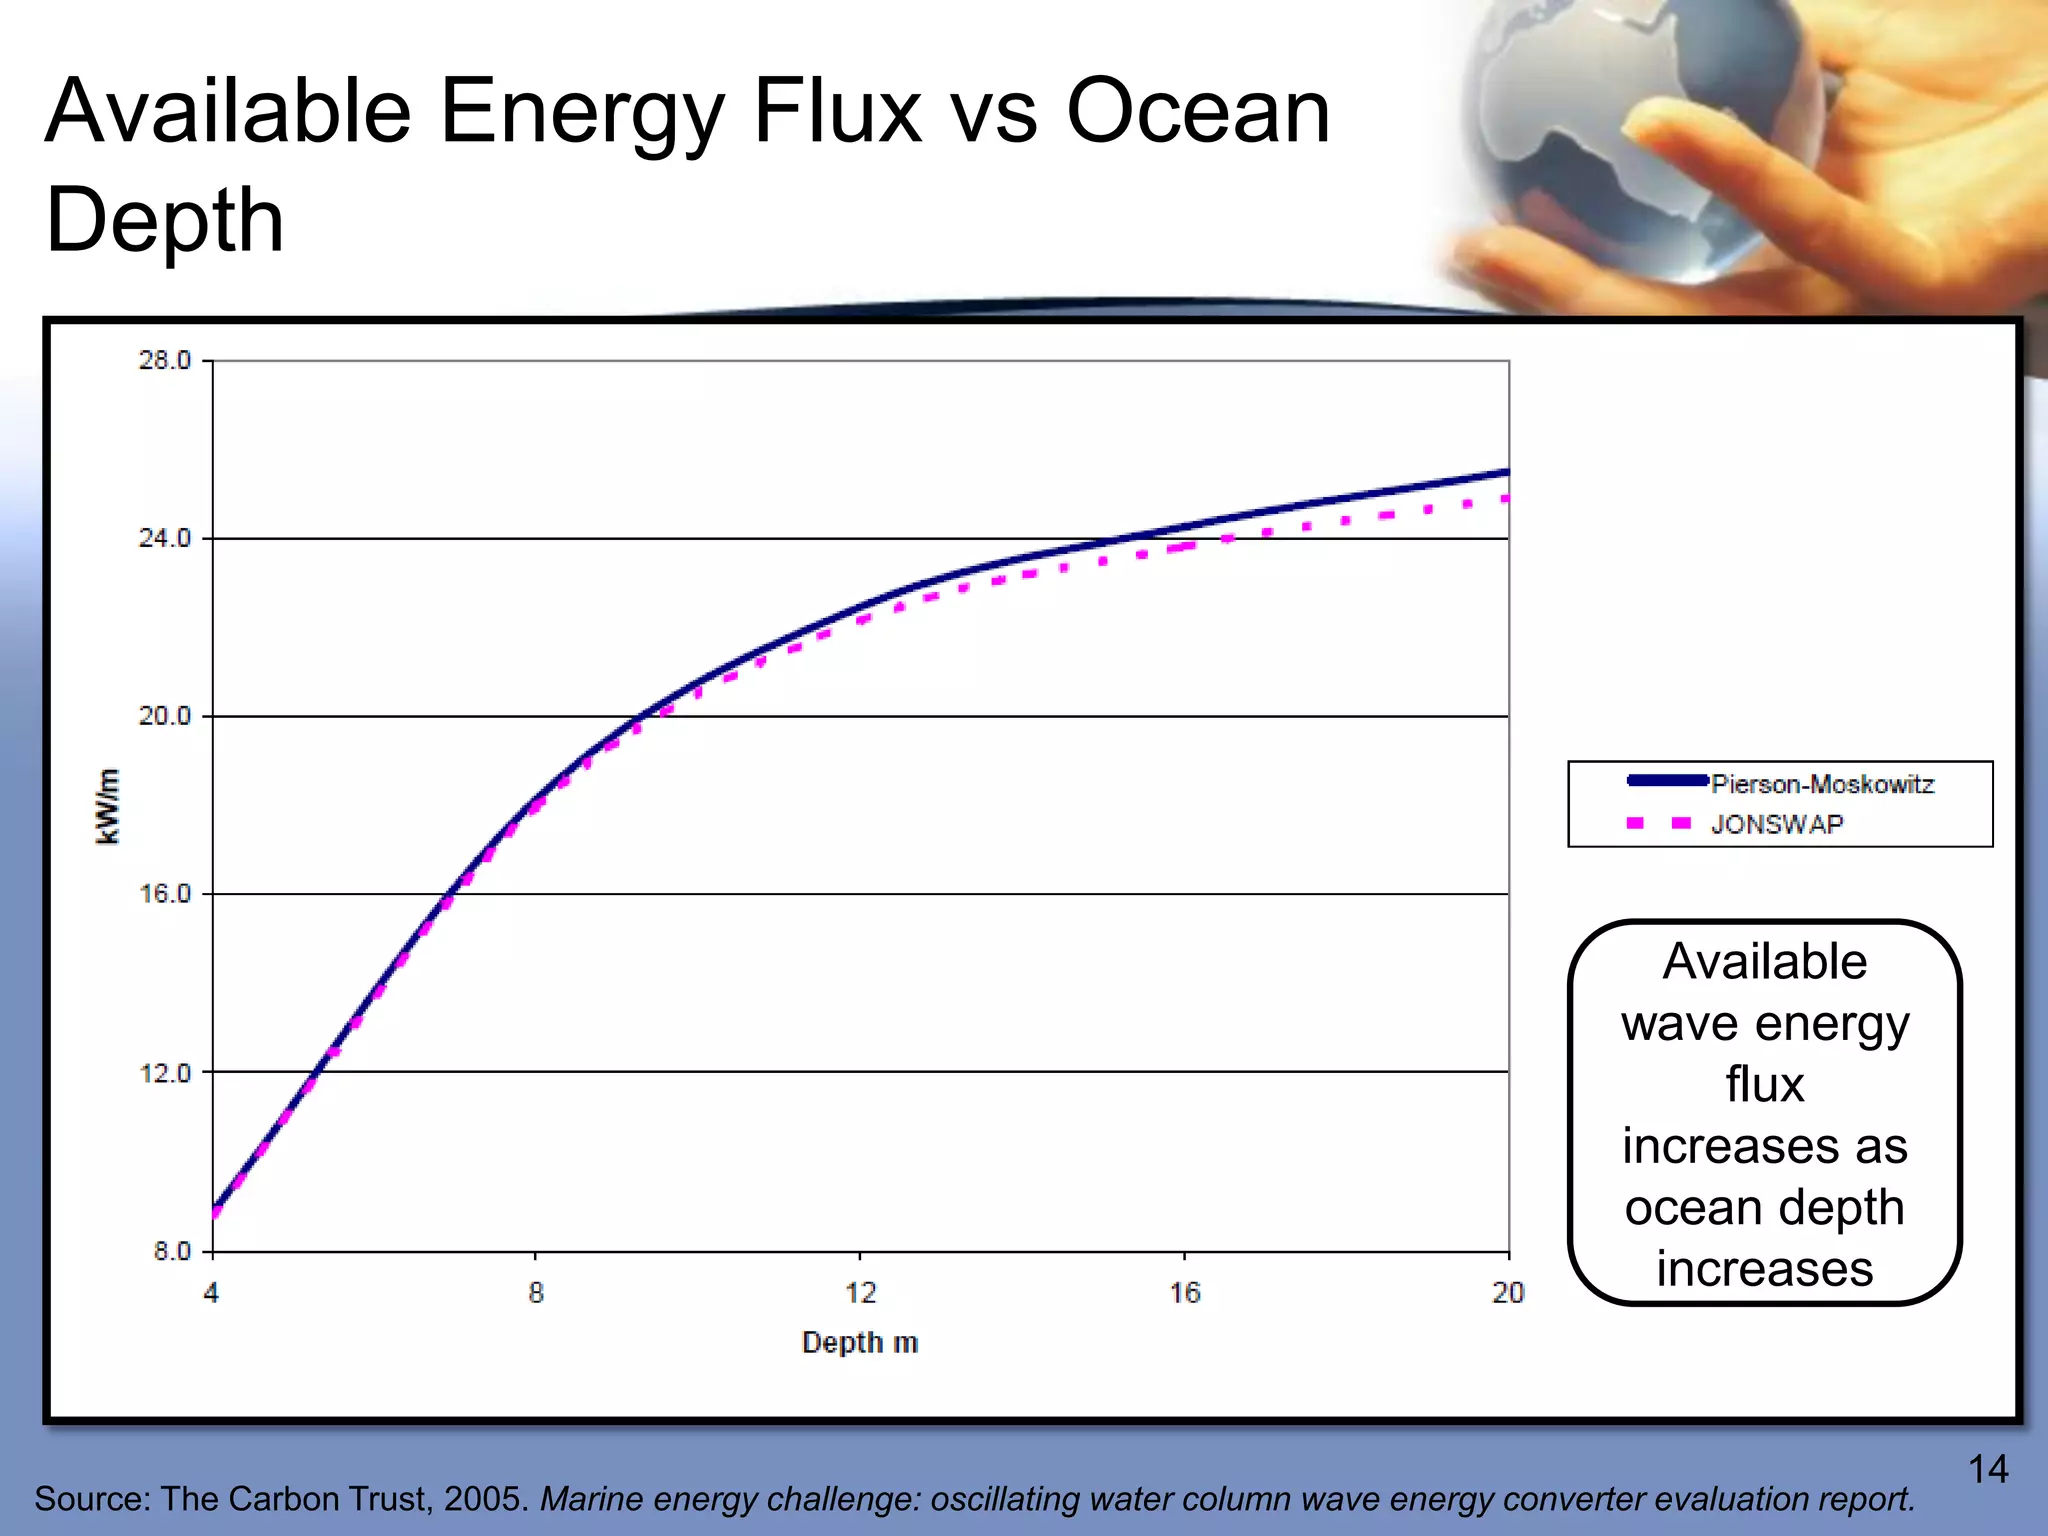
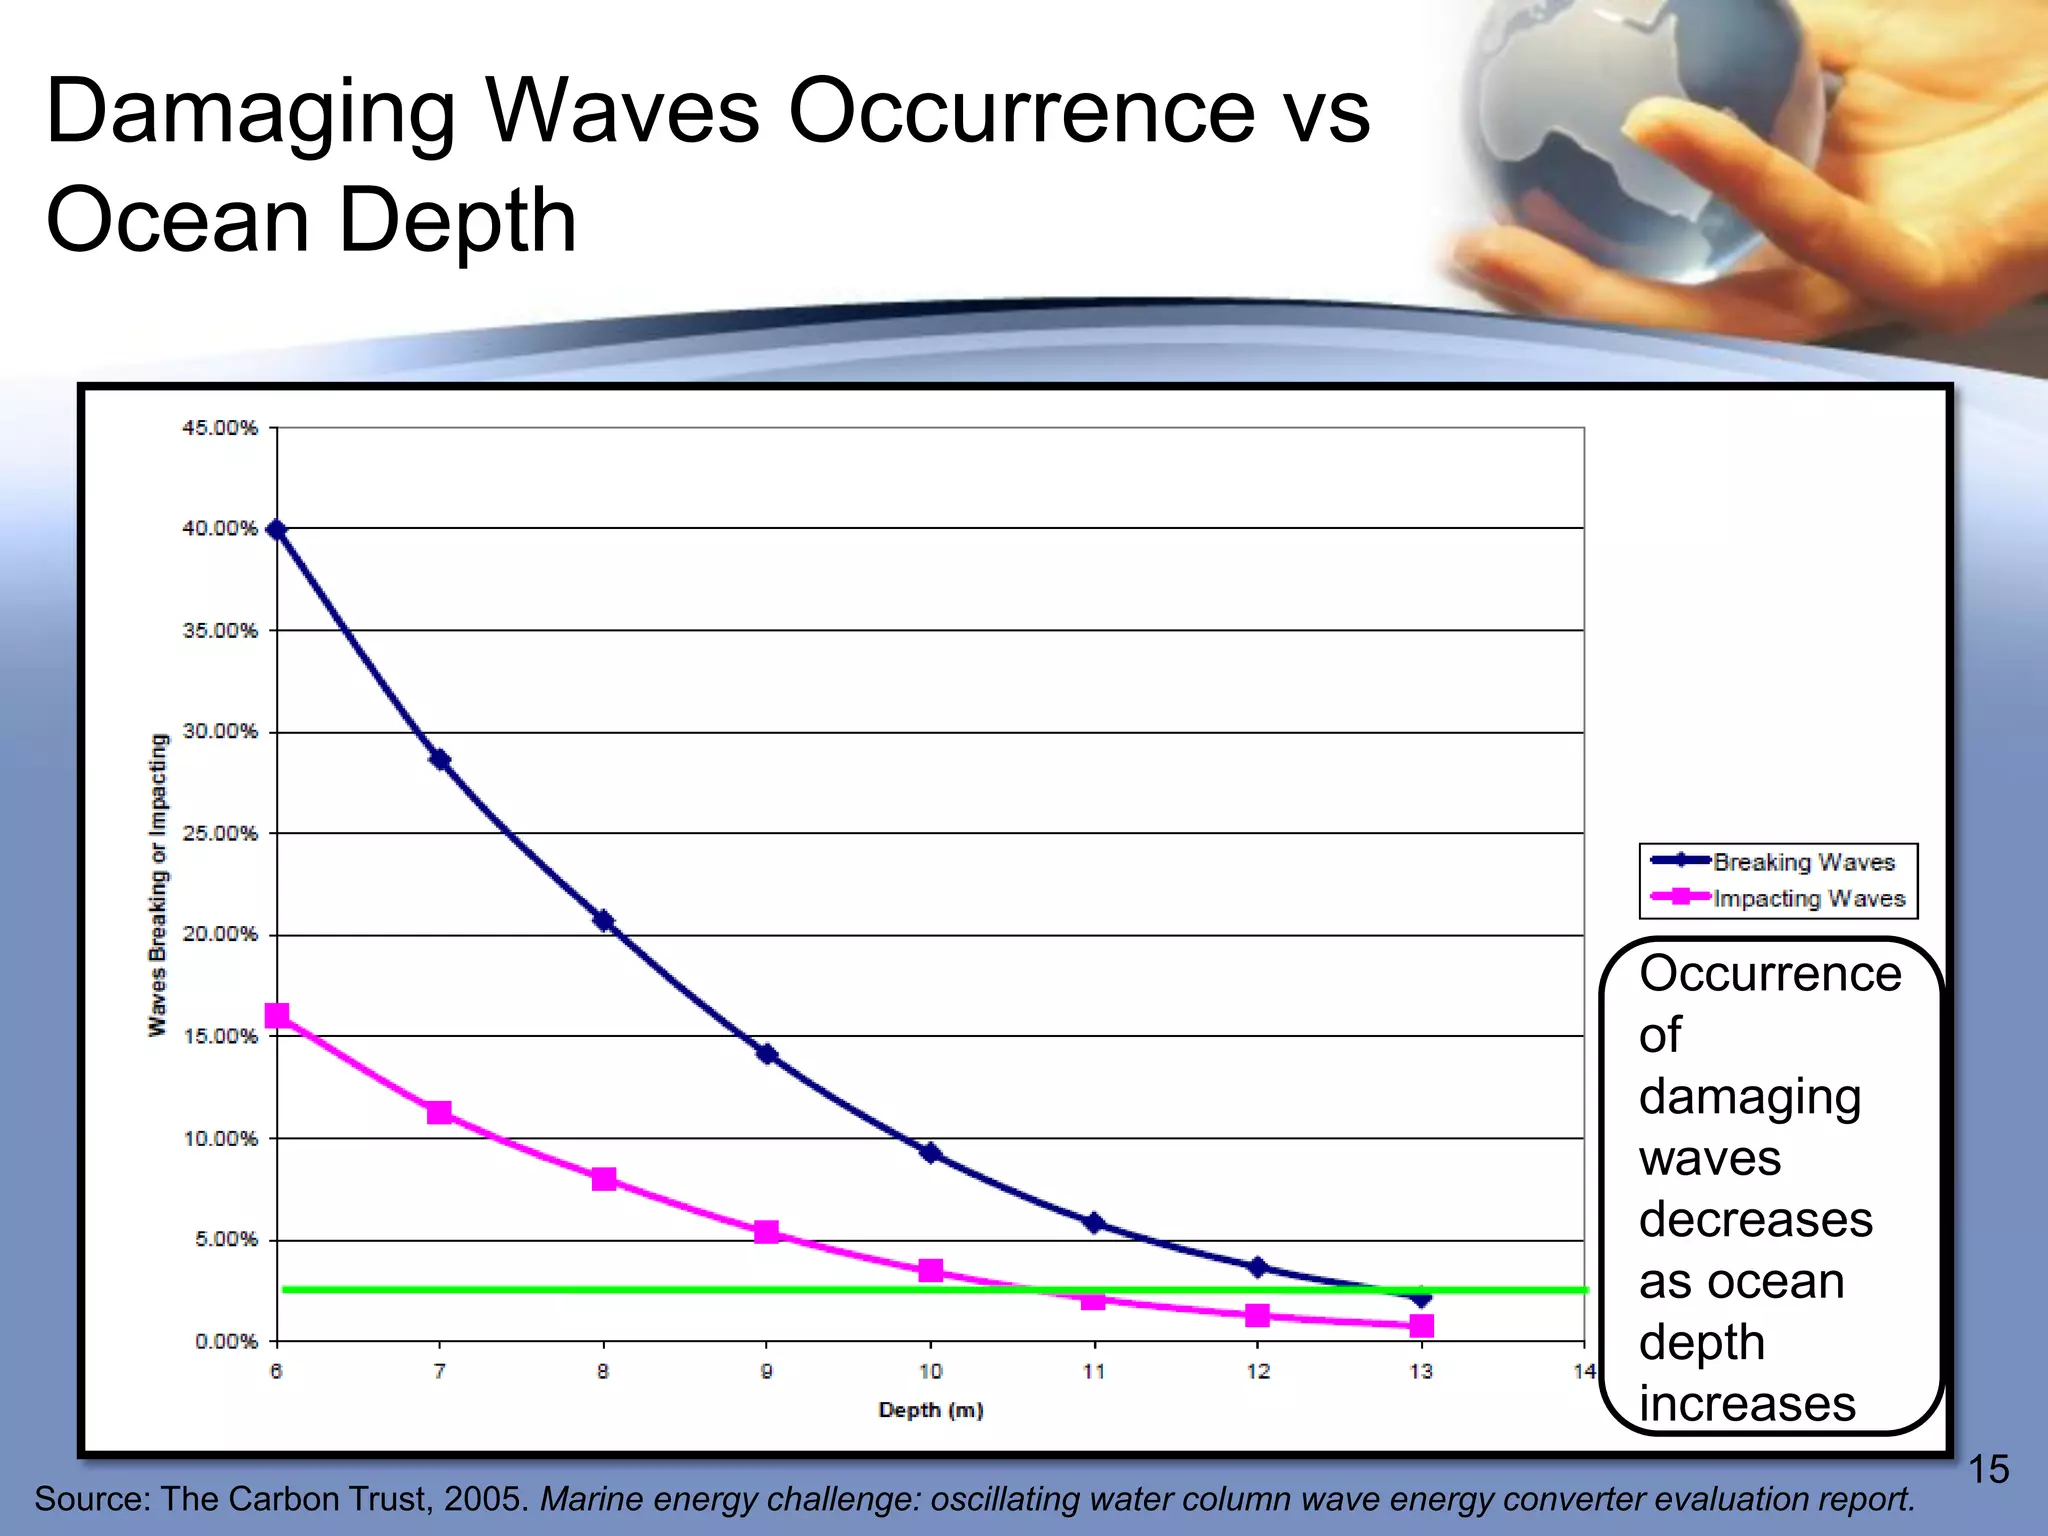
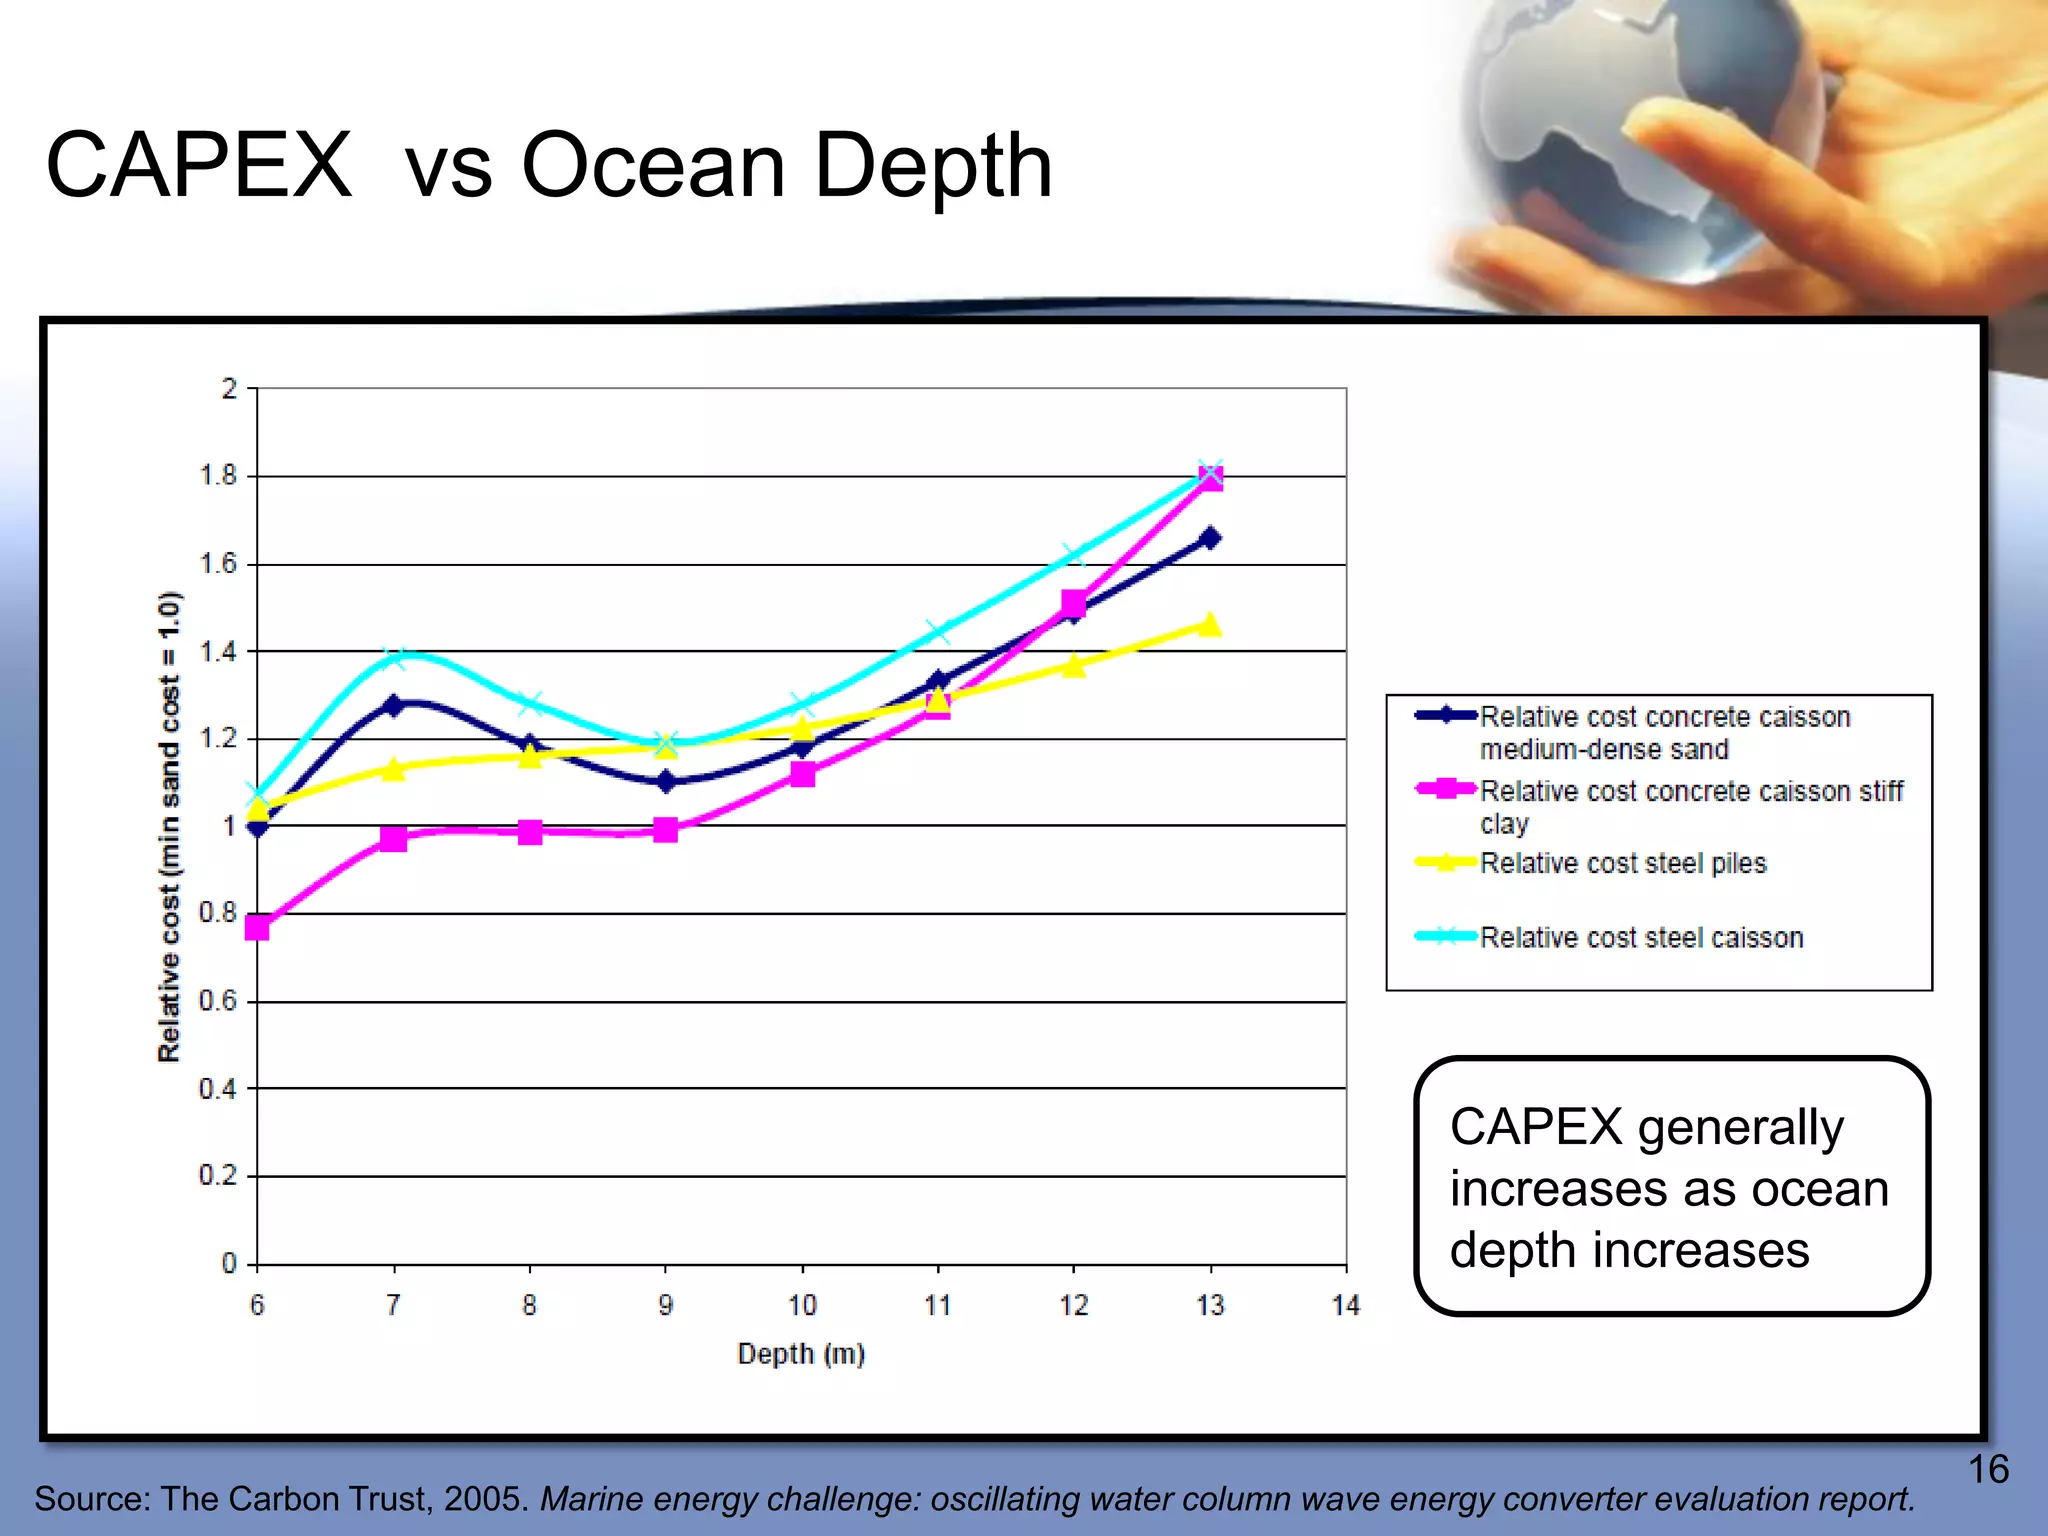
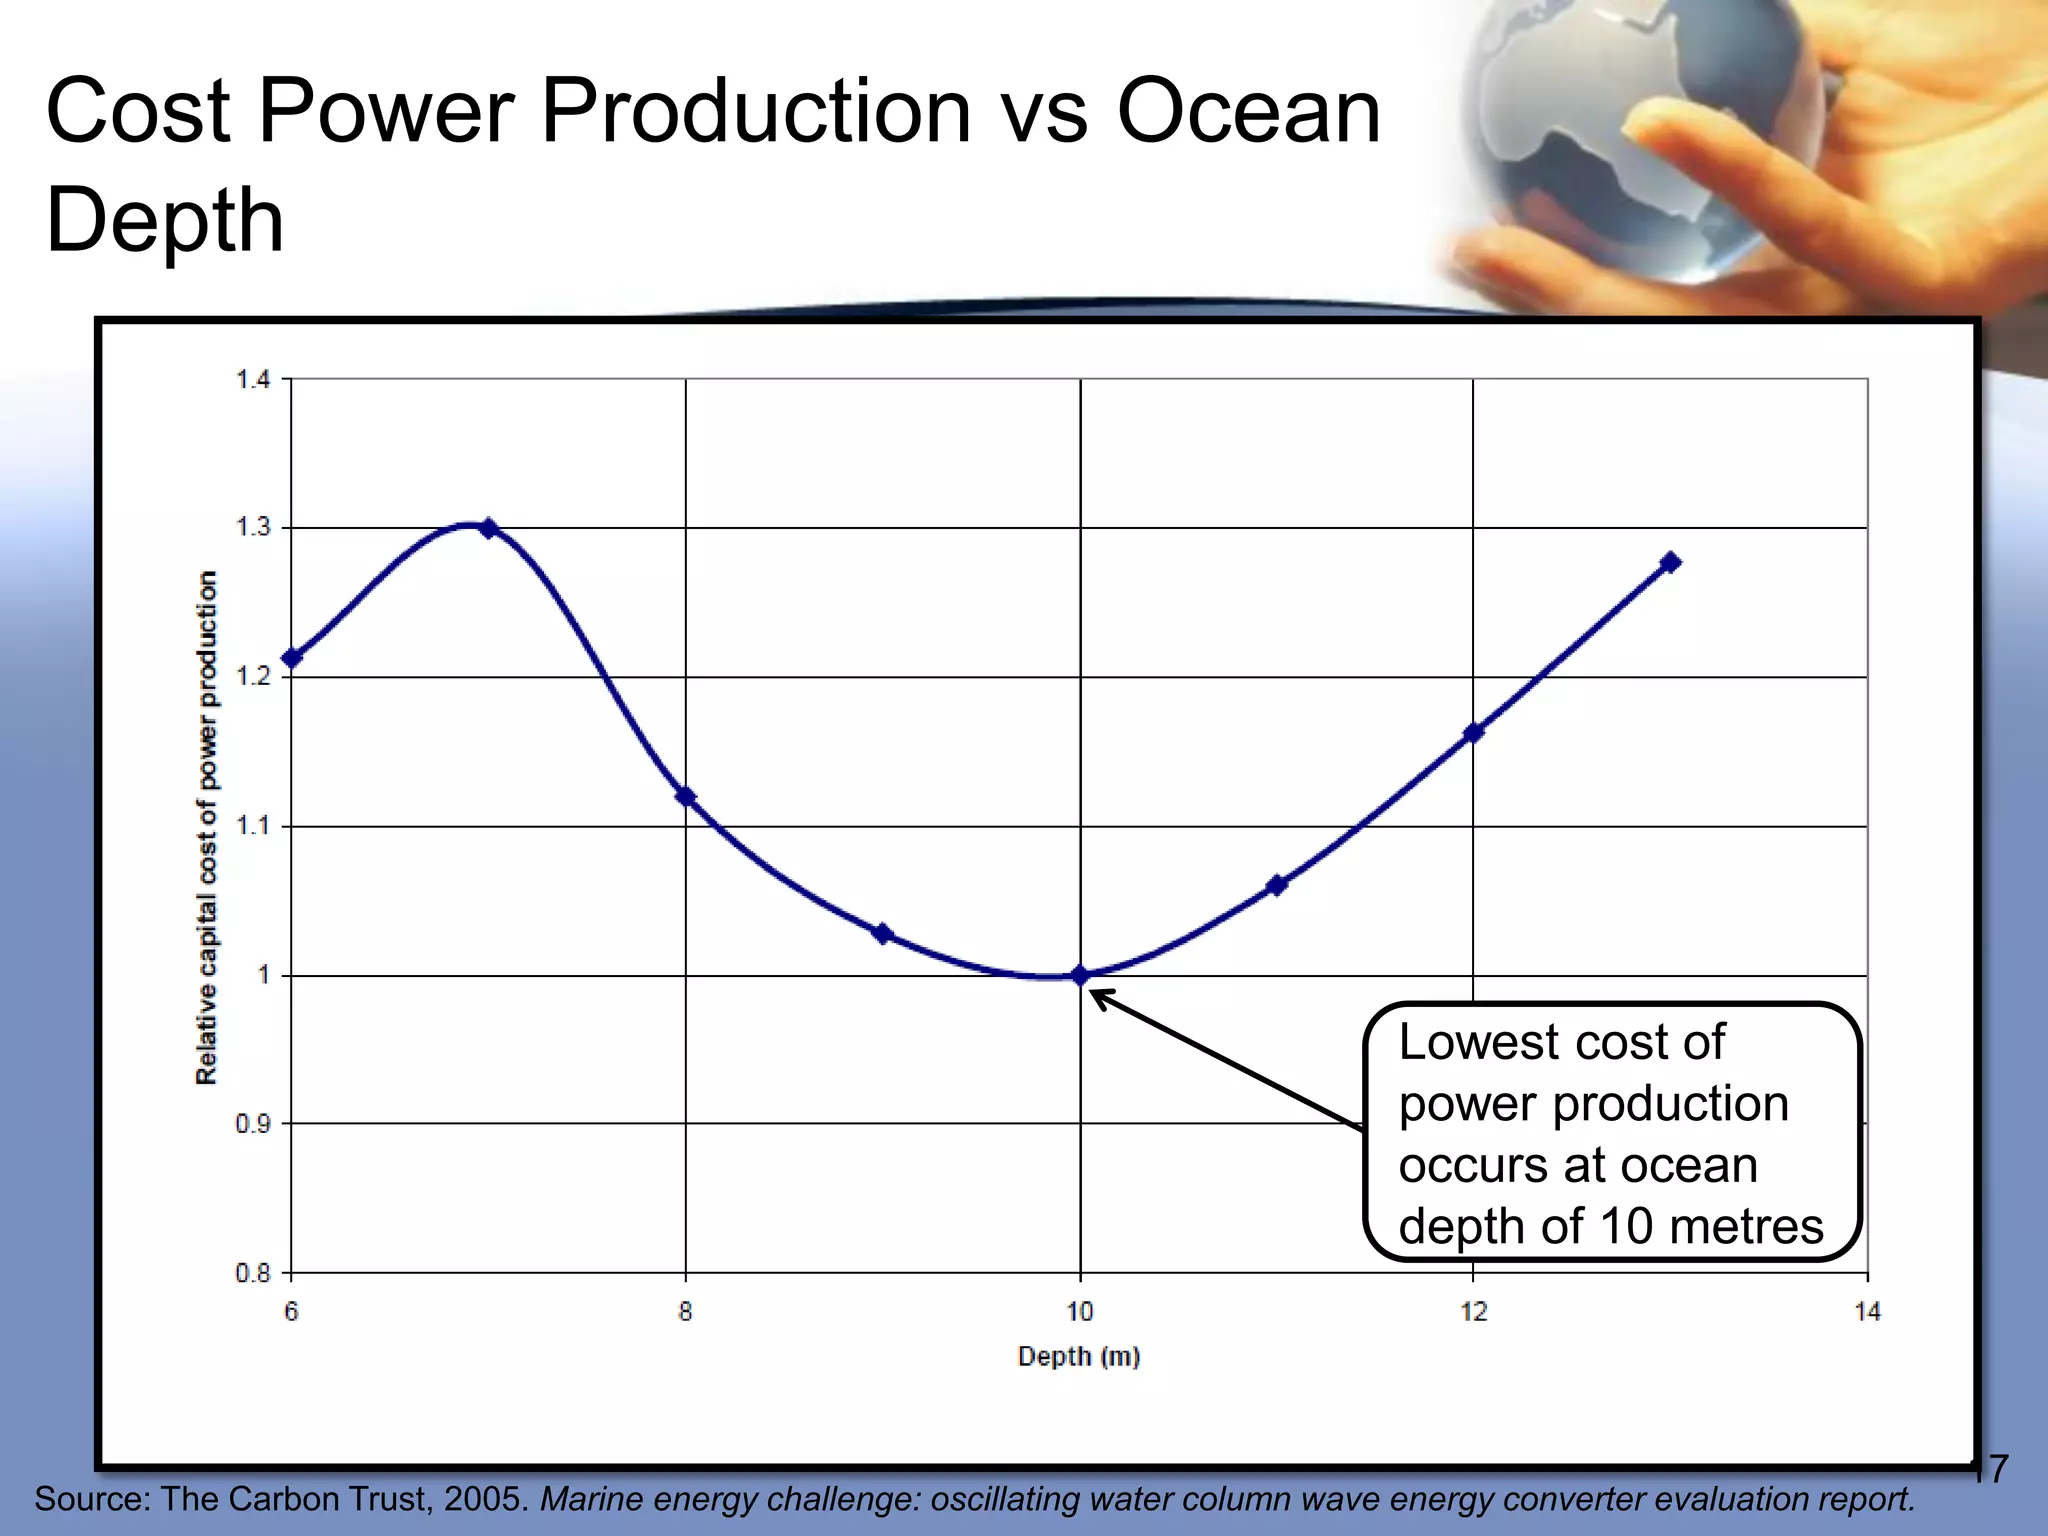

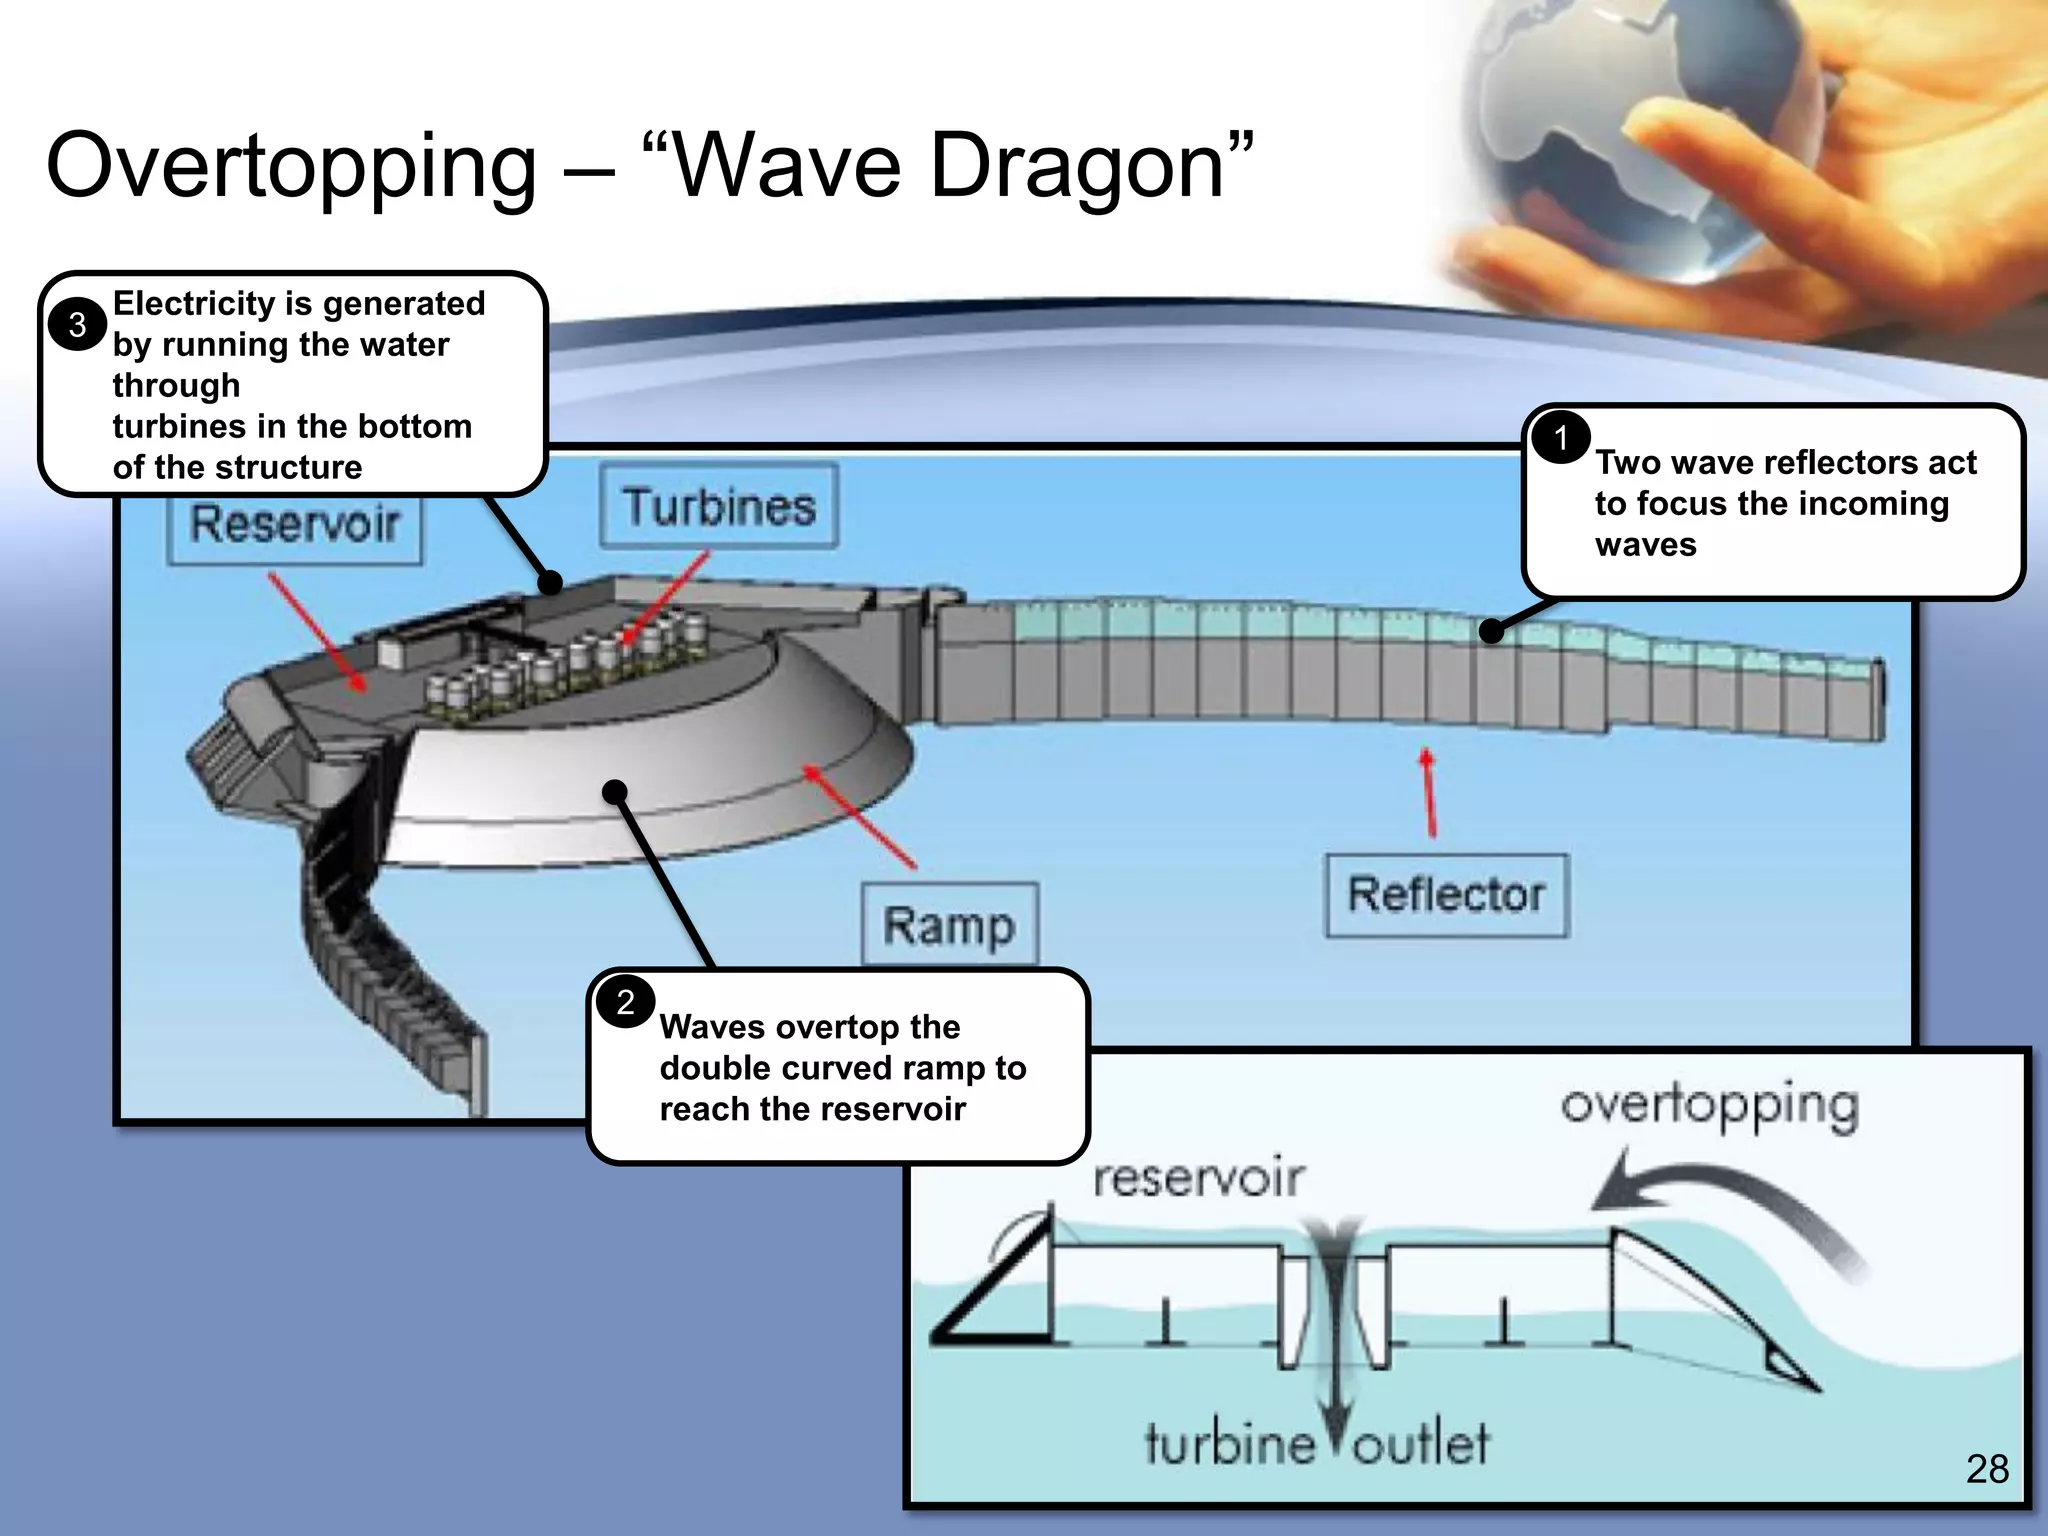


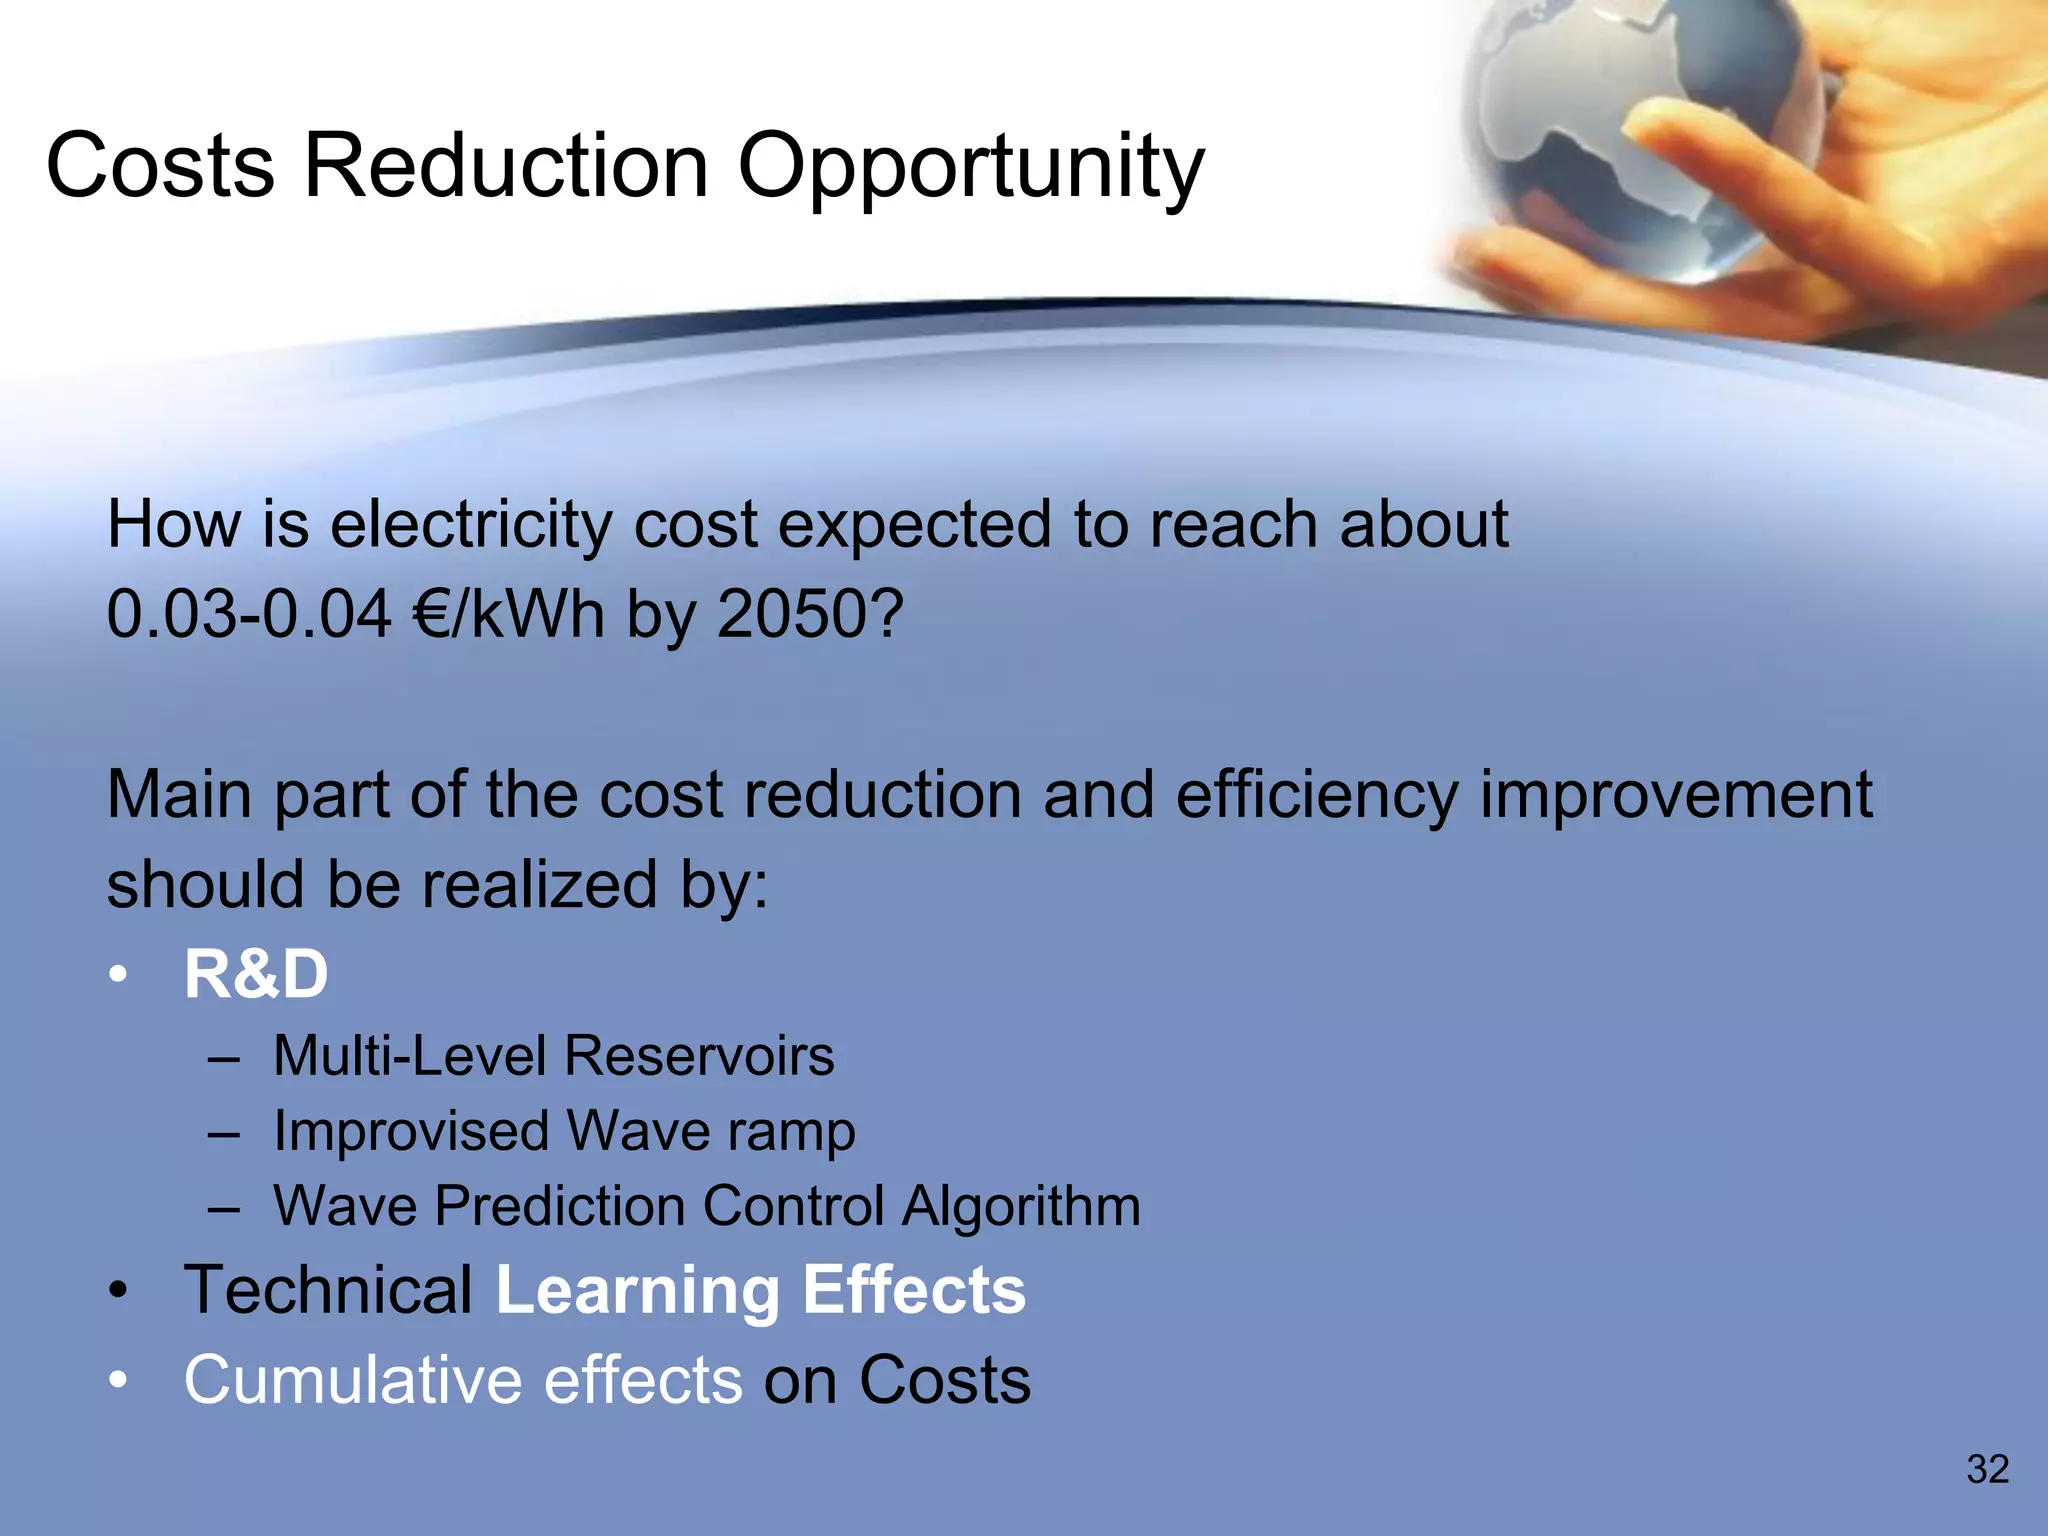
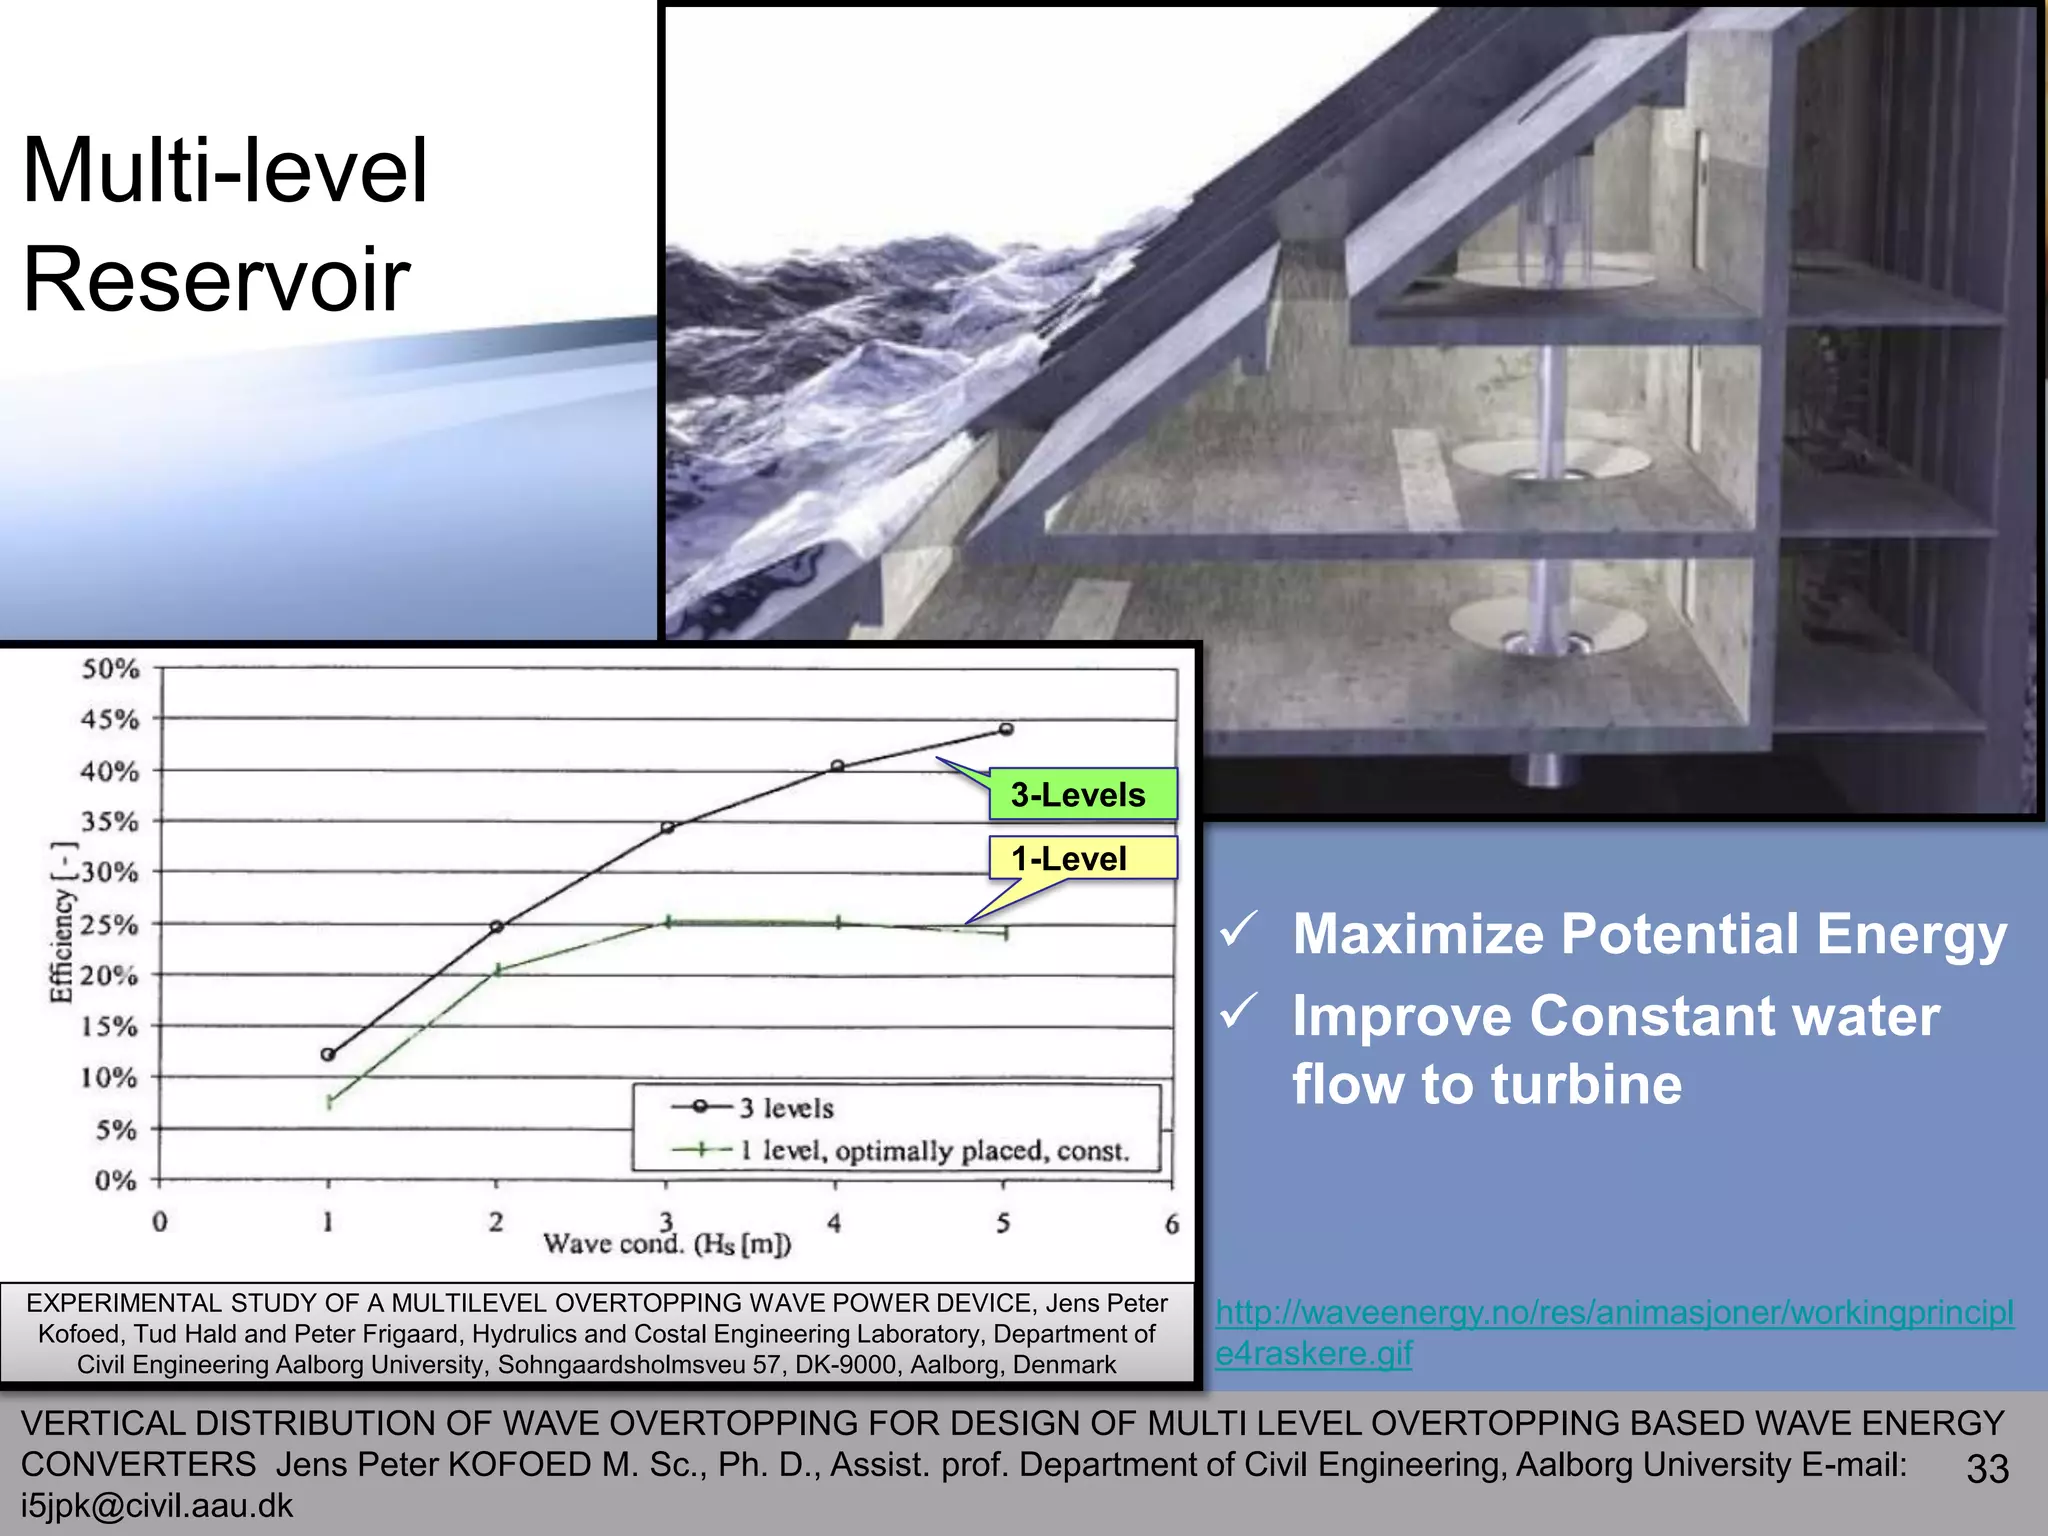


The document summarizes information about ocean wave energy, including: 1) It outlines different wave energy conversion systems such as oscillating water columns (OWCs) and overtopping, discussing their components and efficiencies. 2) OWCs can be improved by optimizing damping to reduce power losses and larger, deeper installations can lower costs by increasing available energy and reducing capital expenditures. 3) Costs for various renewable technologies like wave, solar, wind and biomass are compared, showing wave energy's high density but current higher costs than other options. 4) Costs for wave energy are projected to decline to €0.03-0.04/kWh by 2050 through


