This document provides a capstone report on oyster aquaculture in North Carolina from a multidisciplinary perspective. The natural science research examined ecosystem services like water filtration and habitat provision at an aquaculture site. Social science research uncovered relationships between public knowledge of oysters and willingness to pay. A policy analysis found that North Carolina's strict interpretation of public trust doctrine and high valuation of ecosystem services from submerged aquatic vegetation have limited oyster aquaculture growth, unlike other states that promote the industry. The study calls for further research on oyster aquaculture's ecosystem services and potential in North Carolina.
![11
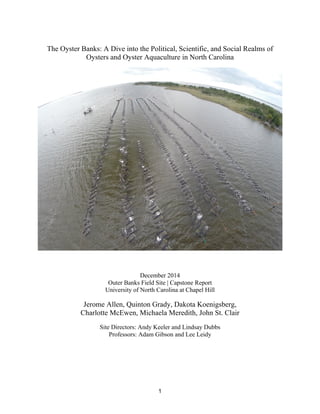
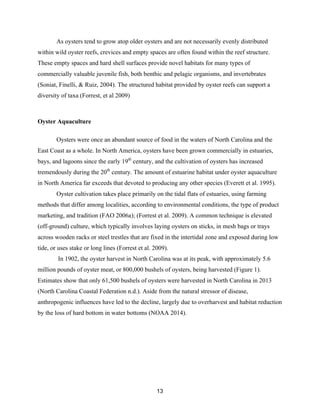
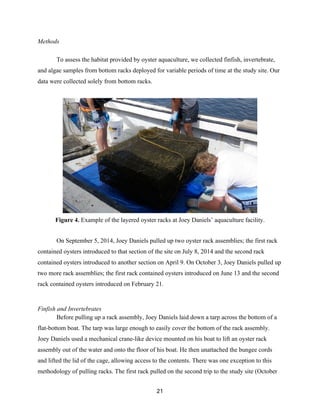
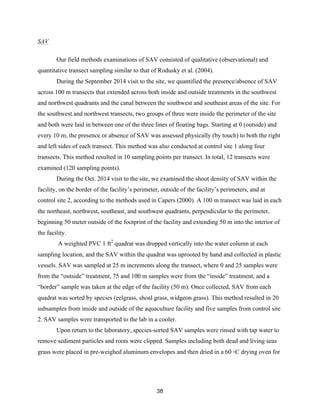
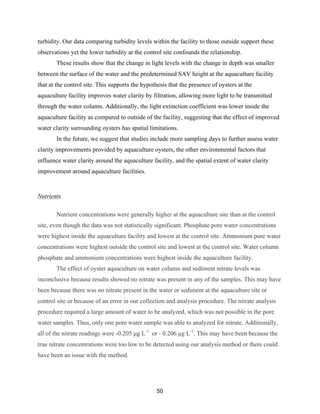
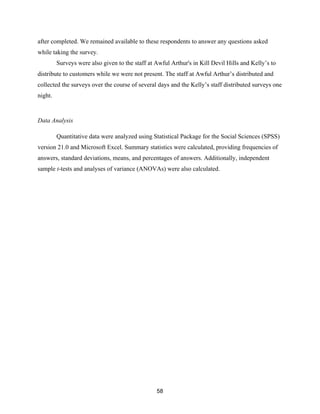
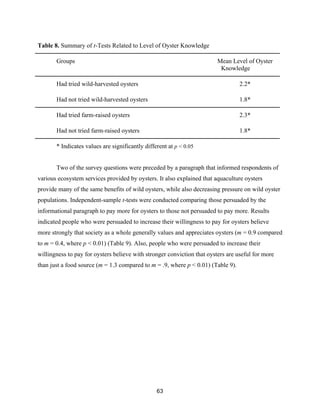
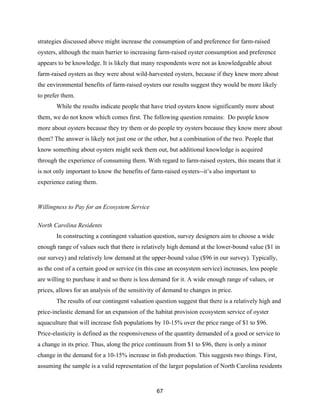
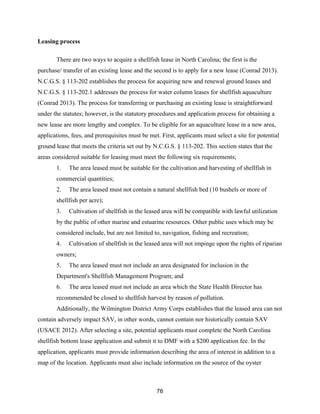
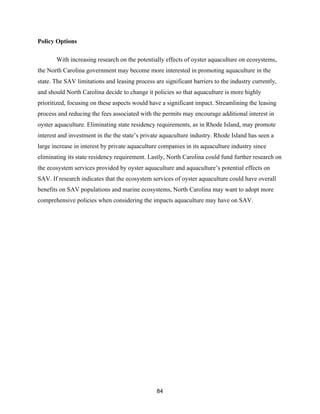
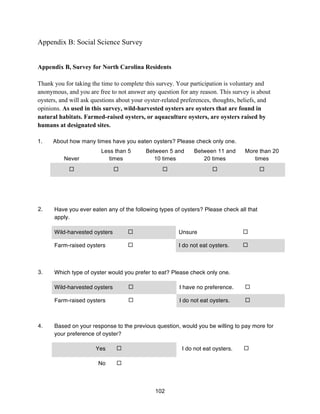
temperature range for respiration and feedings is 24-26°C (Kennedy n.d.). There have been a
limited number of experiments performed to evaluate the effects of low dissolved oxygen on
oysters (Kennedy n.d.), but they have been observed to prefer oxygen saturation greater that 20%
(Eastern Biological Review Team 2007). Oysters tend to thrive optimally in pH levels ranging
from 6.8 to 9.25, although they can tolerate lower pH levels (Kennedy n.d.).
Phytoplankton are the main food source of oysters. Meanwhile, oysters face predation
from ctenophores and other planktivores at the larvae stage; and at the adult stage, oysters face
predation from cownose rays, black drum, oyster drills, crabs, worms, boring sponges, birds.
Oysters were historically abundant along the North Carolina coast. The Albemarle-
Pamlico Sound is an especially favorable location for oysters because of high sediment
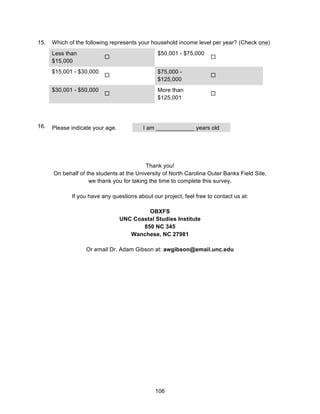
deposition from adjacent river bodies, such as the Neuse and Pasquotank (Kennedy n.d.).
Increased fishing pressure and stock declines caused by diseases, poor water quality and habitat
loss have led to the collapse of the oyster population (Shellfish n.d.). Most NC oysters are
harvested at three years of age, at the minimum harvest size of 3 inches (Shellfish n.d.). Oysters
have been harvested from October to March with tongs, rakes, or by hand, in intertidal areas and
shallow water along coastal NC. They are also fished by dredging in parts of the Pamlico Sound
(Shellfish n.d.).
Ecosystem Services
According to the United Nations Environment Programme’s Millenium Ecosystem
Assessment (2005) ecosystem services are defined as, “[t]he benefits people obtain from
ecosystems. These include provisioning services such as food and water; regulating services such
as flood and disease control; cultural services such as spiritual, recreational, and cultural
benefits; and supporting services, such as nutrient cycling, that maintain the conditions for life on
Earth.”
Oysters are suspension-feeders that filter water as they feed. Thus, their feeding removes
suspended particles from the water column, providing the ecosystem services of improved water
clarity and nutrient regulation to their environment. Oysters’ highly efficient removal of
suspended particulate matter greater than 3µm from the water column increases water clarity
(Newell, 1988), which in turn, allows additional sunlight to penetrate through the water column,](https://image.slidesharecdn.com/7840cfe6-b48d-498a-8820-cc53d932f965-160403190522/85/OBXFS_2014_Capstone-11-320.jpg)
![36
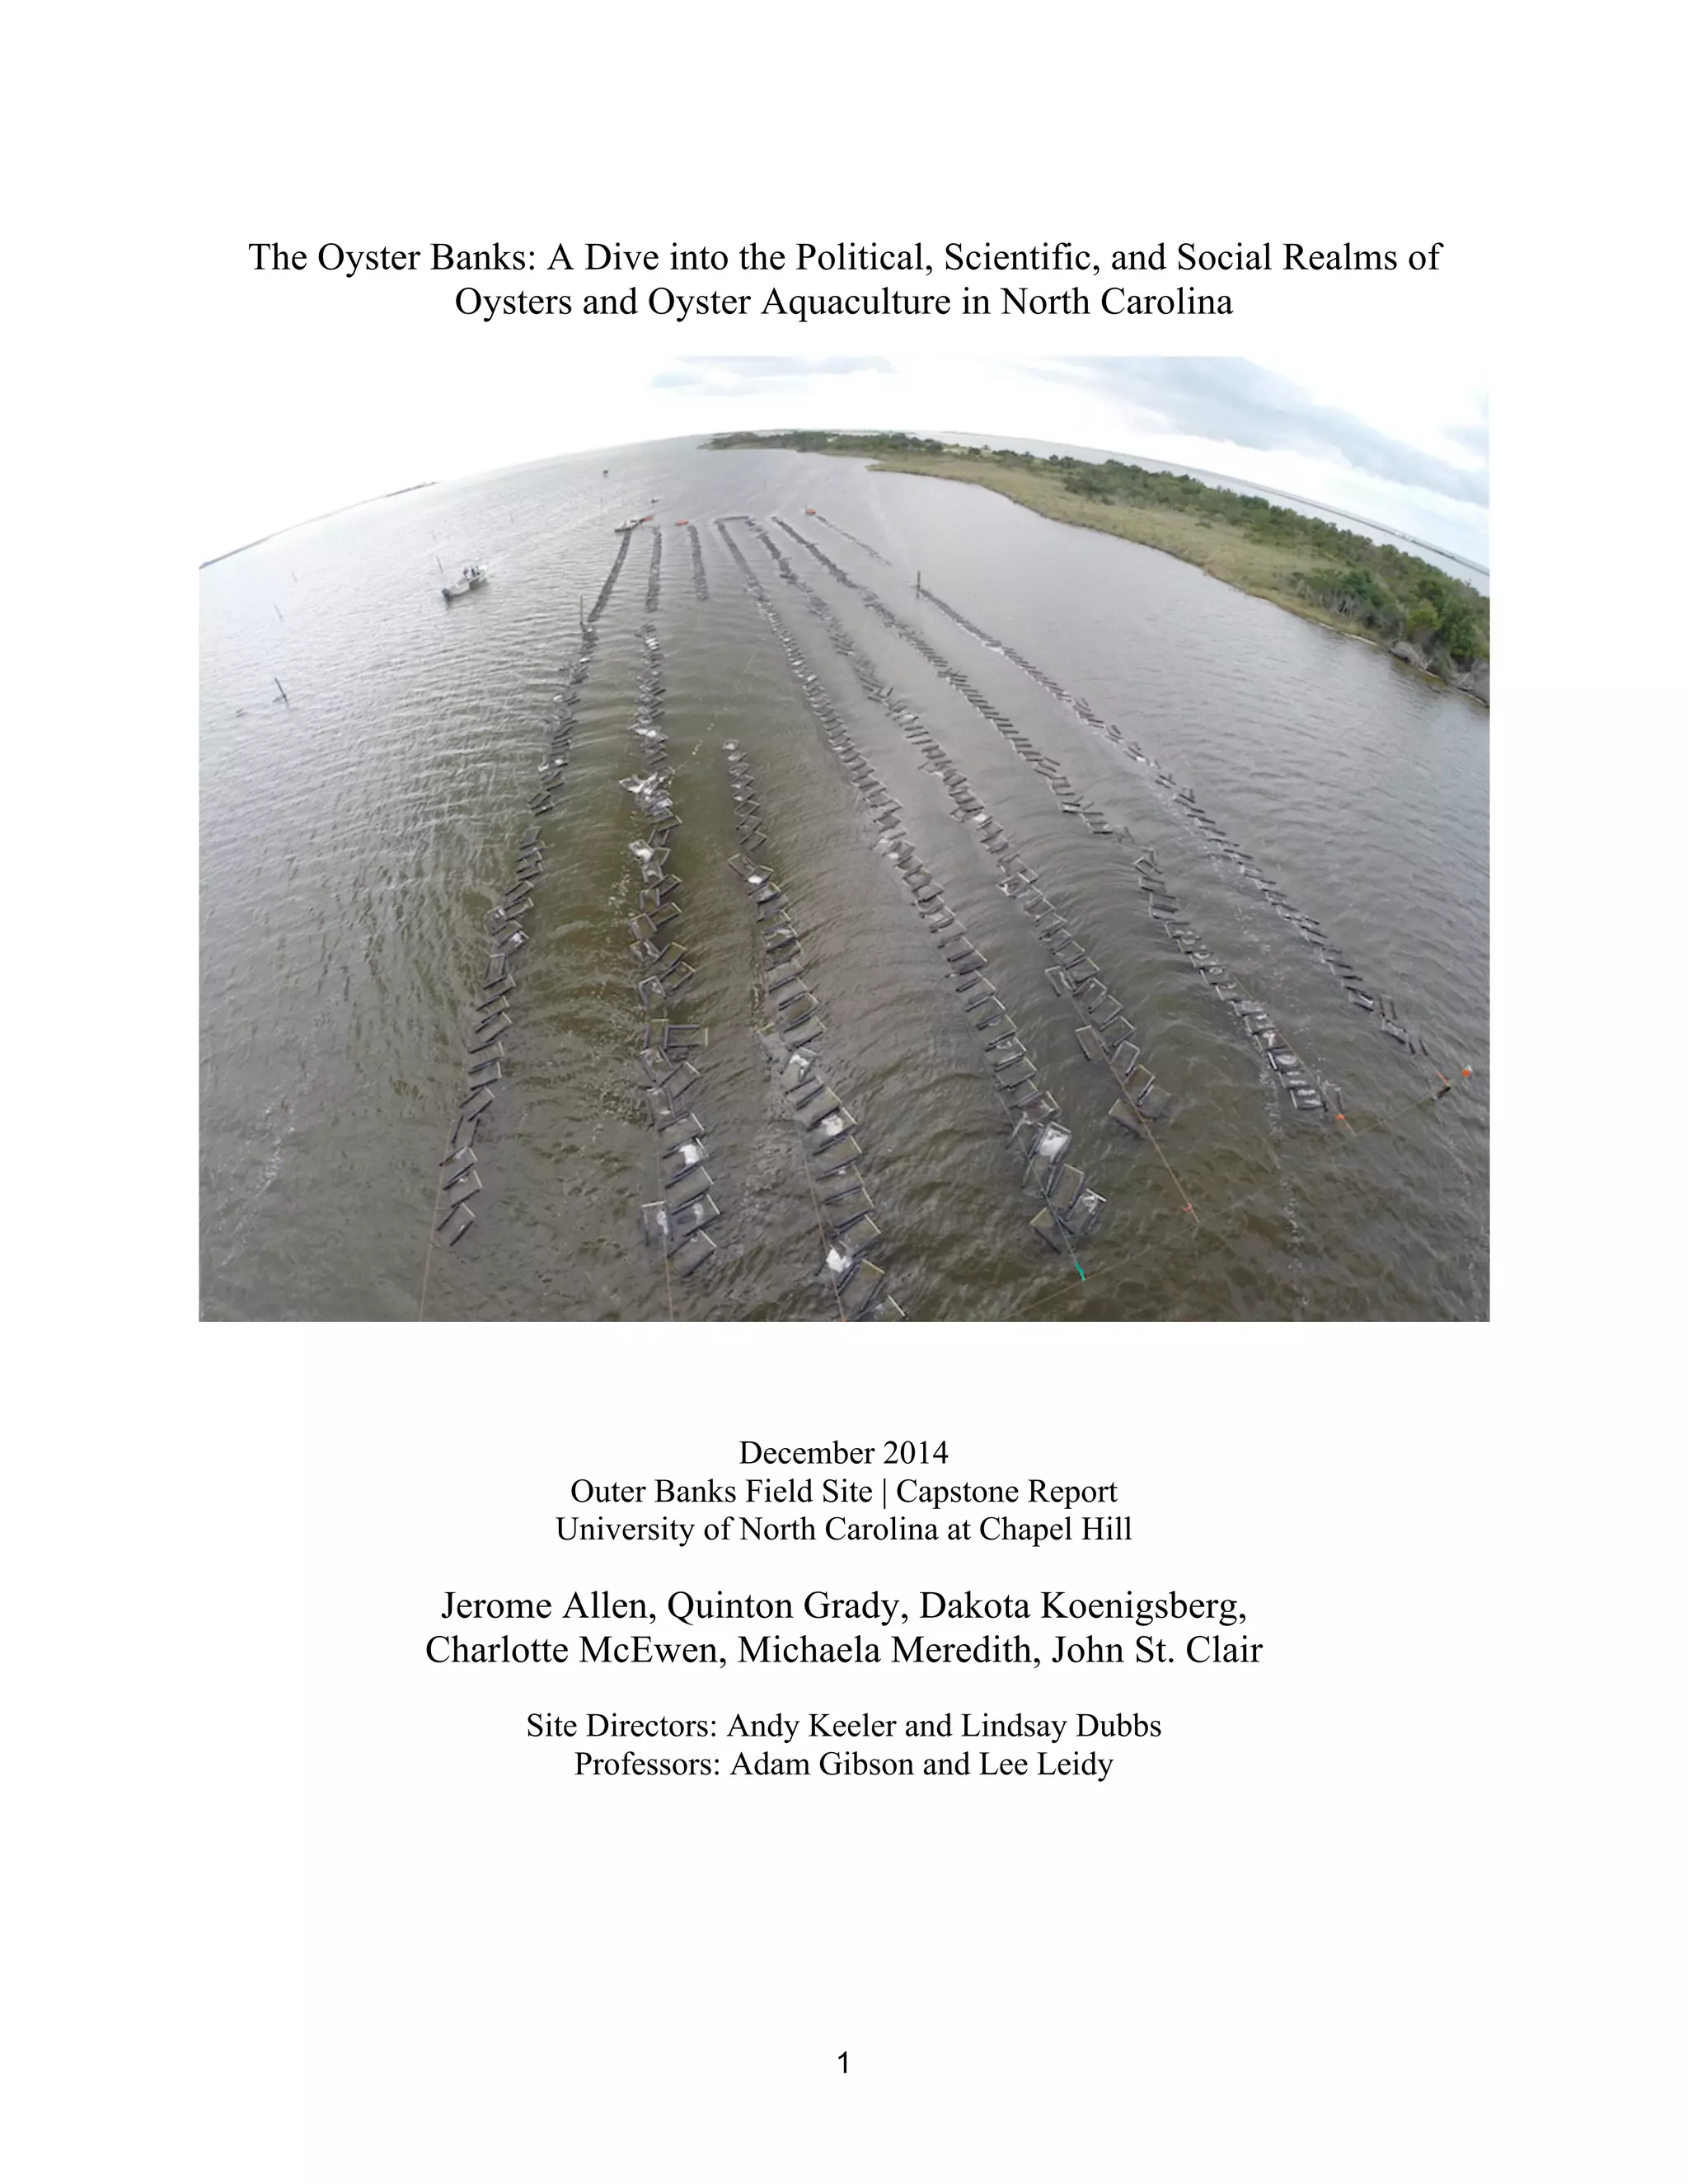
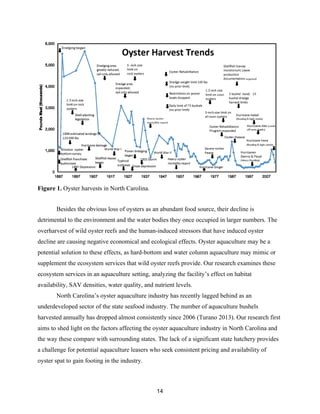
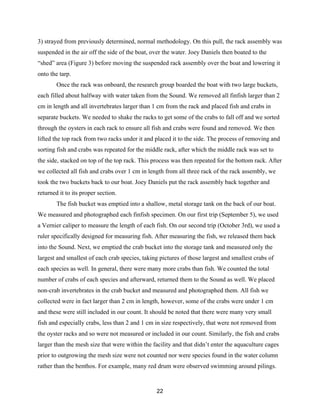
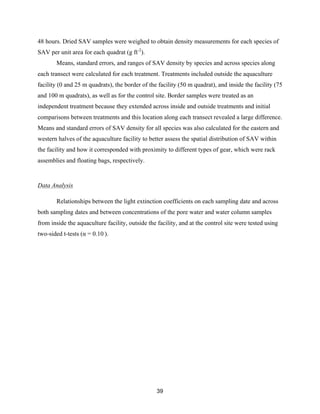
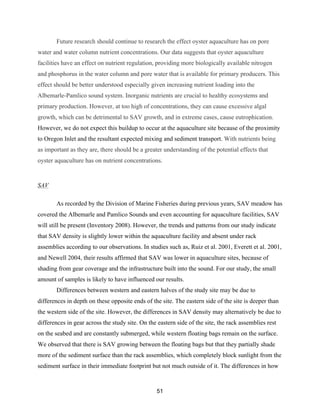
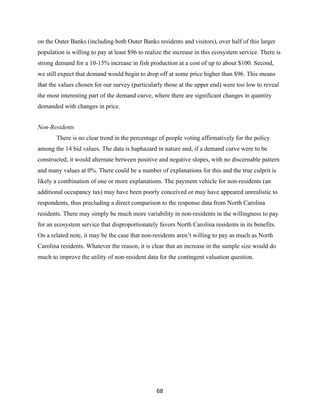
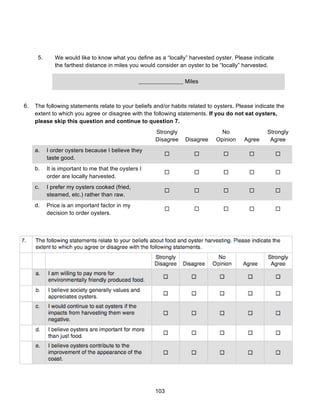
Methods
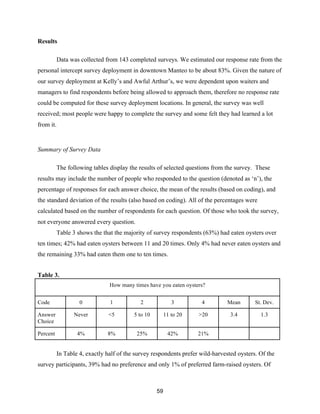
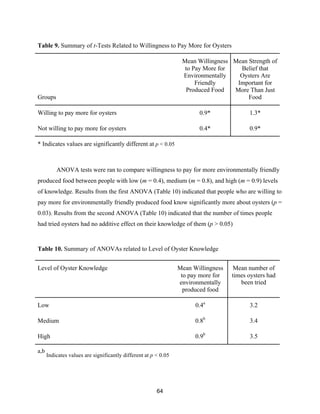
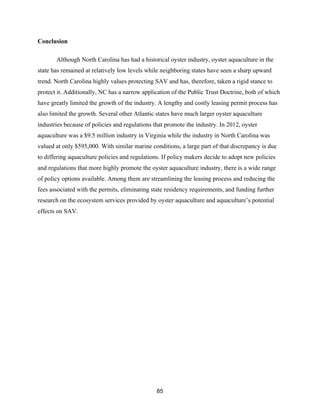
There were generally two treatments and a control that were sampled for each SAV
density, water and sediment water nutrient concentrations, and water clarity. The first treatment
is “inside,” which refers to samples collected inside the footprint of the aquaculture facility, but
that were not occupied by SAG, including racks, bags, docks, and pilings. The second treatment
is “outside,” which refers to samples collected from the edge of the facility to 50 m outside of the
facility. Replicates from both inside and outside were distributed among the southwest,
southeast, northwest, and northeast quadrants of the facility. For SAV density measurements,
there was also a “border” treatment that is explained below.
Water Clarity
Using a meter stick, an average SAV height of 35 cm was determined prior to entering
the research site. Photosynthetically active radiation (PAR), or the wavelengths of solar radiation
that is used by photosynthesizing organisms (400-700 nm), was measured on September 16th
,
2014 and October 2nd
, 2014 using a spherical PAR sensor (LiCor). The LiCor sensor was
positioned just beneath the water surface (Z) and at the predetermined depth of the SAV, 35 cm
above the sediment surface, at each sampling location. Light levels (mmol photons m-2
s-1
) at
these two depths - E0 for the surface and Ez for the predetermined depth- were used to calculate
the mean light extinction coefficient (kd ) at each location using the Lambert-Beer equation
where kd = -[ln (light Z/light O)]/0.35. Extinction coefficients were determined at the northern,
southern, eastern, and western perimeters of the aquaculture facility (outside, O) as well as 4
spots in the boat canal in the middle of the aquaculture facility (inside, I). Extinction coefficients
were also determined at 2 spots at the control site (control, C) on September 16th
, 2014 add at 4
spots on October 2nd
, 2014.
A YSI water quality sonde with conductivity, pH, dissolved oxygen, turbidity, and chl a
probes was used to measure various environmental parameters at each sampling location on
September 16th
, 2014 – both at the aquaculture facility and the control site. Turbidity and
chlorophyll are of particular interest to our water clarity research. Measurements were taken at
the surface and again at our previously determined measurements based on SAV height.](https://image.slidesharecdn.com/7840cfe6-b48d-498a-8820-cc53d932f965-160403190522/85/OBXFS_2014_Capstone-36-320.jpg)
![60
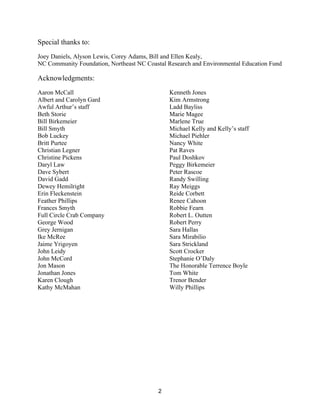
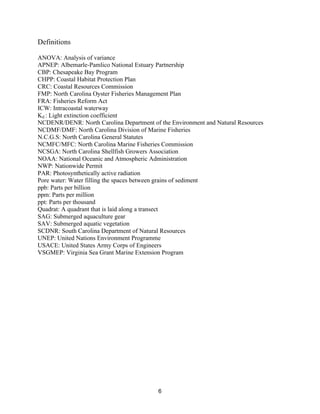
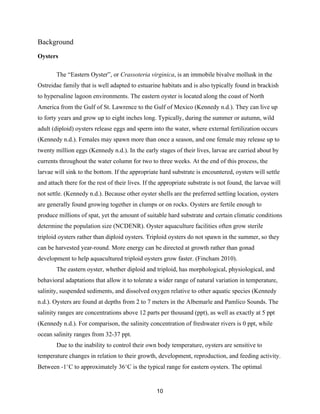
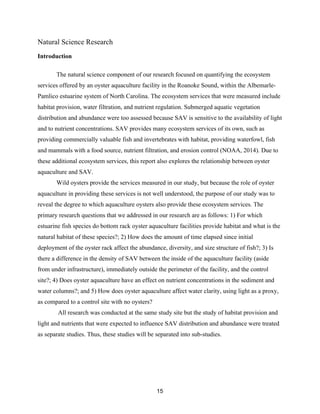
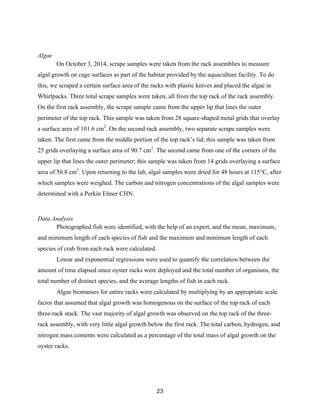
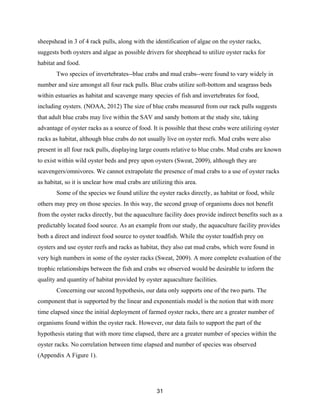
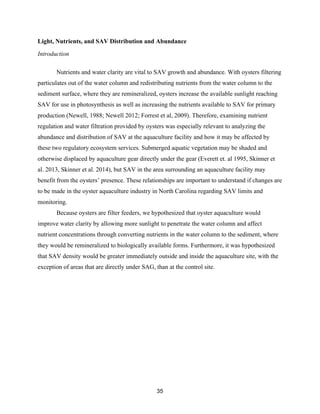
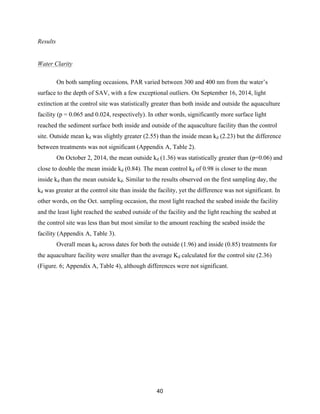
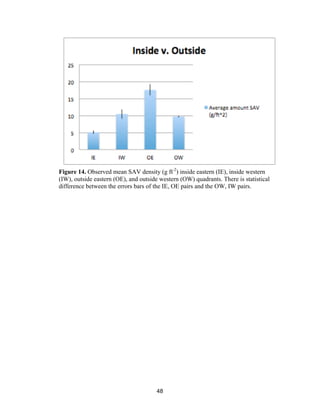
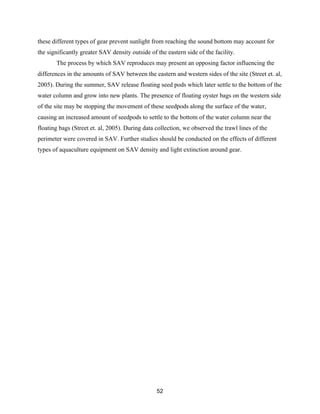
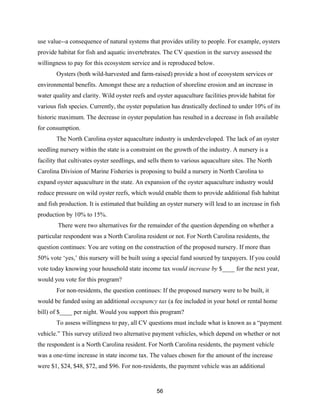
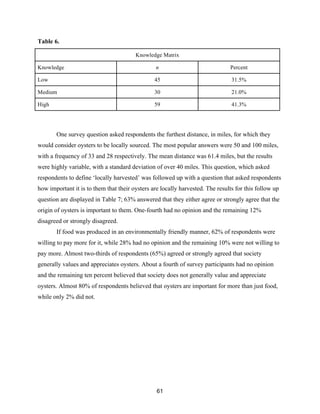
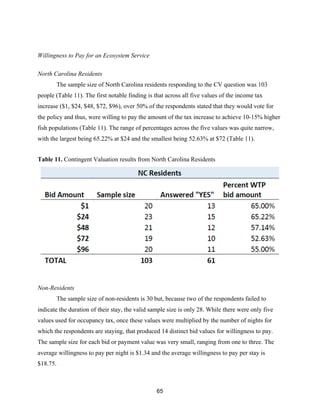
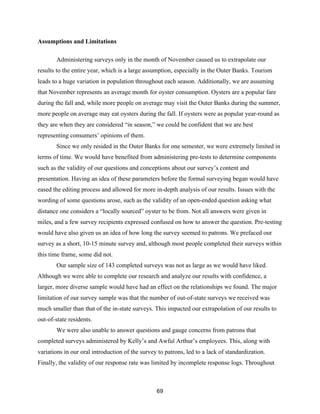
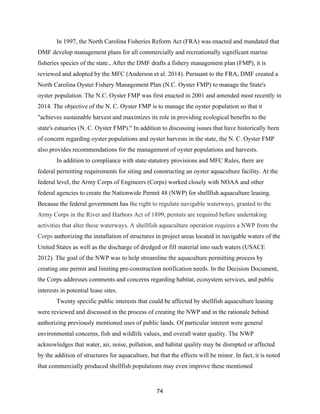
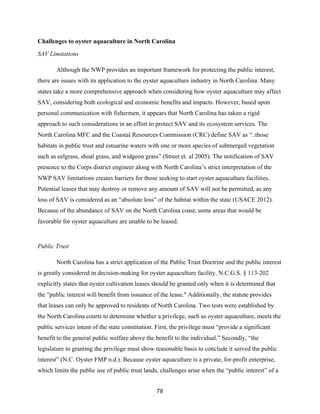
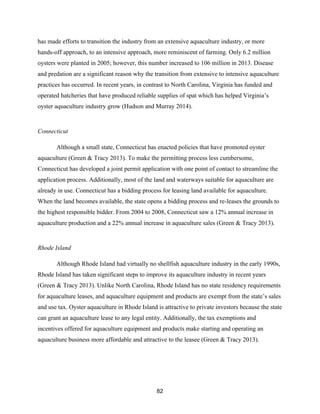
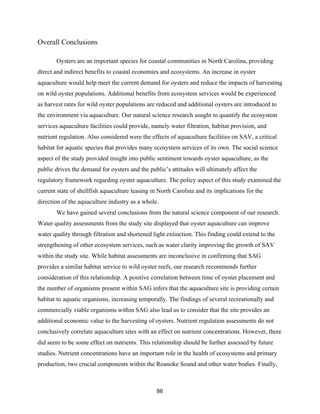
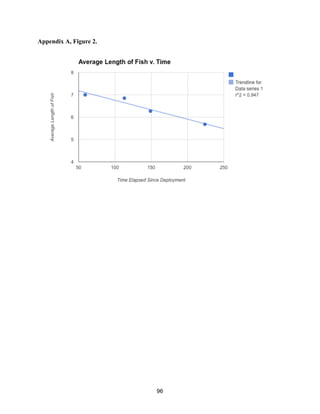
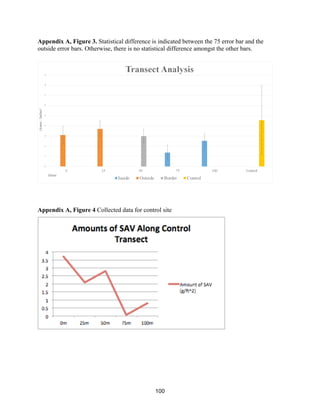
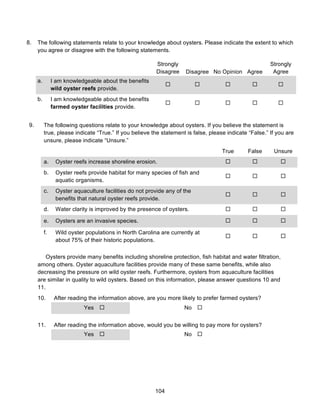
those participants who expressed a preference, about 99% preferred wild-harvested oysters. The
next survey question, the results of which are summarized in Table 5, was a follow-up question
that asked whether respondents would be willing to pay more for their preference of oyster
(either wild-harvested or wild-caught). As Table 5 shows, 60% replied that they would be willing
to pay more for their preference, while only 29% would not be willing to pay more. Lastly, 11%
of respondents replied they “do not eat oysters.”
Table 4.
Which type of oyster would you prefer to eat?
Answer
Choice
Wild-Harvested
Oysters
Farm-Raised
Oysters
I have no
preference.
I do not eat
oysters.
Percent 50% 1% 39% 10%
Table 5.
Based upon your response to the previous question [Question 3 in survey], would you be willing to pay
more for your preference of oyster?
Answer Choice Yes No I don’t eat oysters
Percent 60% 29% 11%
Table 6 displays the breakdown of oyster knowledge levels of survey respondents. The
oyster knowledge values were calculated based on the results of six survey questions intended to
measure oyster knowledge. Results from these questions were then combined into an overall
oyster knowledge metric. Table 6 summarizes the distribution of respondents along the oyster
knowledge continuum.](https://image.slidesharecdn.com/7840cfe6-b48d-498a-8820-cc53d932f965-160403190522/85/OBXFS_2014_Capstone-60-320.jpg)
![73
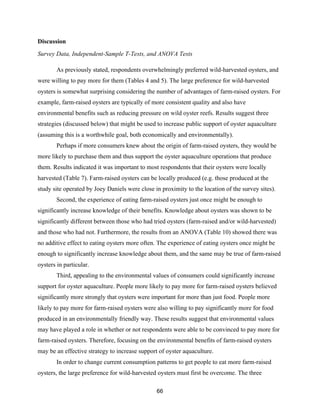
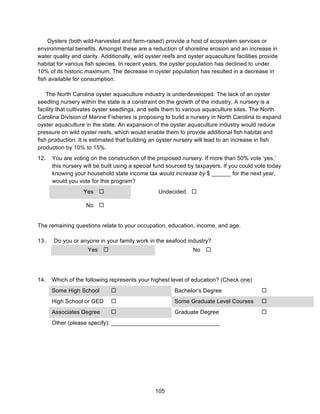
Current state of regulation
The oyster aquaculture industry in North Carolina is regulated by the North Carolina
General Statutes and the Marine Fisheries Commission (MFC) Rules. The MFC is tasked with
managing, restoring, developing, cultivating, conserving, protecting and regulating the state’s
marine and estuarine resources and implementing laws relating to coastal fisheries, including
shellfish (N. C. G. S. Section 143B-289.51). Chapter 113, Article 16 of the N.C.G.S addresses
the cultivation of shellfish with N.C.G.S. § 113-201(b) granting power to the MFC to make rules
to manage oysters and other shellfish and to "take all steps necessary to develop and improve the
cultivation, harvesting, and marketing of [oysters]." The legislative findings provide that,
“shellfish cultivation provides increased seafood production and long-term economic and
employment opportunities . . . [and] provides increased ecological benefits to the estuarine
environment by promoting natural water filtration and increased fishery habitats” (N.C.G.S.
Section 113-201(a)). It is the policy of the state to, “encourage the development of private,
commercial shellfish cultivation in ways that are compatible with other public uses of marine and
estuarine resources” (N. C. G. S. Section 113-201(a)). The MFC delegates authority to the
Division of Marine Fisheries (DMF) to manage the State's oyster resources. DMF is responsible
for the stewardship of the state's marine and estuarine resources. Interestingly, the DMF traces its
roots to 1822, when the North Carolina General Assembly enacted legislation to impose gear
restrictions on oyster harvest (NCDMF).
Generally, the federal government has responsibility for managing fishing activities
occurring from three to two hundred miles from the U.S. coast (Baur 2008). The Magnuson-
Stevens Act (MSA) was passed by Congress in 1976 and established a Fishery Conservation
Zone extending from the U. S. shores to 200 miles (Baur 2008). Additionally, the MSA
established rules for managing fishing activities within this zone. The MSA also implemented a
management structure for domestic fisheries by establishing eight (8) regional fishery
management councils (Baur et al. 2008). These councils have the discretion to determine which
fisheries require conservation and management, and until the council makes this decision, the
fishery is not subject to federal regulation (Baur et al. 2008). In 1996, the Sustainable Fisheries
Act (SFA) was passed and amended the MSA (Baur et al. 2008). Under the SFA, conservation of
fishery stocks was made the top priority of the regional fishery councils (Anderson et al. 2014).](https://image.slidesharecdn.com/7840cfe6-b48d-498a-8820-cc53d932f965-160403190522/85/OBXFS_2014_Capstone-73-320.jpg)
![89
References
Albemarle-Pamlico National Estuary Partnership (APNEP). 2013 North Carolina Oyster
Summit. 2013. North Carolina Department of Environment and Natural Resources. [cited
2014 Dec 7].
Albemarle-Pamlico National Estuary Partnership (APNEP). About US. 2014. North Carolina
Department of Environment and Natural Resources. [cited 2014 Dec 7].
Anderson K, Mirabilio S. 2014. A History of Commercial Fisheries, Regulations and
Management. Legal Tides. [Internet]. [cited 2014 Dec 7]. Available from:
http://ncseagrant.ncsu.edu/ncseagrant_docs/coastallaw/LT/lt_summer_2014.pdf
Bauer D., Eichenberg T., Sutton, M. 2008. Ocean Coastal Law and Policy [Print]. 1st.
Chicago(IL):American Bar Association; [cited 2014 Dec 6]
Blustein D. 2013. August 18. Made in NC: Oyster farmers work to propel aquaculture in
NC. News and Observer [Internet]. [Last Updated August 18, 2013, cited November 20,
2014]
Worm B, Barbier E, Beaumont N, Duffy E, Folke C, Halpern B, Jackson J, et al. 2006. Impacts
of Biodiversity Loss on Ocean Ecosystem Services. Science Magazine Volume 314
(November): 31.
Capers, Robert S. 2000. A comparison of two sampling techniques in the study of submersed
macrophyte richness and abundance. Aquatic Botany.[cited 2014 Dec 7]. 87-92.
Chesapeake Bay Program [Internet]. Annapolis, Maryland. Field Guide. Skilletfish; 2012 [Cited
2014 Nov 21]; [3 screens]. Available from:
http://www.chesapeakebay.net/fieldguide/critter/skilletfish
Chesapeake Bay Program [Internet]. Annapolis, Maryland. Field Guide. Tautog; 2012 [Cited
2014 Nov 21]; [2 screens]. Available from:
http://www.chesapeakebay.net/fieldguide/critter/tautog
Cloern J. 2001. Our evolving conceptual model of the coastal eutrophication problem. Marine
Ecology Progress Series [Internet]. [cited 2014 Nov 21] 210:223-253. Available from:
http://www.int-res.com/articles/meps/210/m210p223.pdf
Coastal Habitat Protection Plan (CHPP). 2005. [Internet] NC Division of Marine Fisheries; [cited
2014 December 4]. Available from:
http://www.ncdmf.net/habitat/chppdocs/A_Title%20ExecSumandTOC.pdf
Conrad B. 2013. North Carolina Shellfish Lease Program [Internet].:NC Division of Marine
Fisheries; [cited 2014 November 20]. Available from:
http://portal.ncdenr.org/c/document_library/get_file?uuid=817a9a88-bf49-4108-be00-
fe93ce2de5ee&groupId=38337
Crawford C, Macleod C, Mitchell I. 2003. Effects of shellfish farming on the benthic
environment. Aquaculture [Internet]. [cited 2014 Dec 7] 224(1-4): 117-140. Available from:
http://ac.els-cdn.com/S0044848603002102/1-s2.0-S0044848603002102-
main.pdf?_tid=5b67d8c0-7e53-11e4-baa2-
00000aab0f02&acdnat=1417985901_0e1700d926a2988b39b51e5a7ab23df1
Dealteris J, Kilpatrick B, Rheault R. 2004. A comparative evaluation of the habitat value of
shellfish aquaculture gear, submerged aquatic vegetation and a non-vegetated seabed”.
Journal of Shellfish Research (Vol. 23, No. 3) [Internet]. [cited 2014 Nov 23]](https://image.slidesharecdn.com/7840cfe6-b48d-498a-8820-cc53d932f965-160403190522/85/OBXFS_2014_Capstone-89-320.jpg)
![90
Dietrich T. 2013. Oyster farming down to a science. Daily Press [Internet]. [2013 Apr 21, cited
2014 Nov 23]. Available from: http://articles.dailypress.com/2013-04-21/news/dp-nws-
aquaculture-report-vims-20130421_1_native-oysters-marine-science-virginia-institute
Division of Marine Fisheries. N.C. Department of Environment and Natural Resources
[Internet]. Raleigh (NC): Division of Marine Fisheries; c2013. Eastern oysters; 2013 [cited
2014 Dec 5]; [about 2 screens]. Available from: http://portal.ncdenr.org/web/mf/35-eastern-
oyster-ssr-2013
Dumbauld, B. R., Ruesink, J. L., & Rumrill, S. S. (2009). The ecological role of bivalve shellfish
aquaculture in the estuarine environment: A review with application to oyster and clam
culture in West Coast (USA) estuaries. Aquaculture, 290(3-4), 196–223.
doi:10.1016/j.aquaculture.2009.02.033
Erbland P, Ozbay G. A Comparison of the Macrofaunal Communities Inhabiting a Crassostrea
virginica Oyster Reef and Oyster Aquaculture Gear in Indian River Bay, Delaware. Journal
of Shellfish Research. 2008 [cited 2014 Dec 5]; Vol. 27, No. 4: 757–768.
Forrest, Barrie M. et al. 2009. Bivalve aquaculture in estuaries: review and synthesis of oyster
cultivation effects. Elsevier Aquaculture. 1-15.
Fincham, Michael W. 2010 Trials & Errors & Triploids Odyssey of an Oyster Inventor
[Internet]. [cited 2014 Dec 9]; [about 10 screens]. Available from:
http://ww2.mdsg.umd.edu/CQ/v09n2/main2/
Frankenberg, D. 1995. North Carolina Blue Ribbon Advisory Council on Oysters: Final Report
on Studies and Recommendations. North Carolina Department of Environment, Health, and
Natural Resources. Raleigh, NC.
Grabowski J, Brumbaugh R, Conrad R. Keeler A, Opaluch J, Peterson C, Piehler M, Powers S,
Smyth A. 2012. Economic Valuation of Ecosystem Services Provided by Oyster Reefs.
BioScience [Internet]. [cited 2014 Nov 23]; 62(10) [about 10 screens]. Available from:
http://bioscience.oxfordjournals.org/content/62/10/900.full.pdf
Green C, Tracy T. 2013. Fostering Shellfish Aquaculture Production in Maryland and Other
States [Internet].:Department of Legislative Services; [cited 2014 Nov 22]. Available from:
http://dls.state.md.us/data/polanasubare/polanasubare_natresenvntra/Fostering-Shellfish-
Aquaculture-Production-in-Maryland-and-Other-States.pdf
Hargis and Haven 1999. Chesapeake Bay Oyster reefs, Their Importance, Destruction and
Guideline for Restoring Them. pp 329-259
Higgins, C. B., Stephenson, K., & Brown, B. L. (2011). Nutrient Bioassimilation Capacity
of Aquacultured Oysters: Quantification of an Ecosystem Service. Journal of Environment
Quality, 40(1), 271. doi:10.2134/jeq2010.0203
Holmes R., Aminot A, Kéroul R. Hooker B, Peterson B. 1999. A simple and precise
method for measuring ammonium in marine and freshwater ecosystems. Canadian Journal
of Fisheries and Aquatic Sciences [Internet]. [cited 2014 Dec 7] 56(10):1801-1808.
Available from: http://www.turnerdesigns.com/t2/doc/appnotes/S-0103.pdf
Hudson K, Murray T. 2014. Virginia Shellfish Aquaculture Situation and Outlook Report.
[Internet]. [2014 April, cited 2014 Nov 23] Virginia Sea Grant Marine Extension Program.
Available from:
http://www.vims.edu/research/units/centerspartners/map/aquaculture/docs_aqua/20140411_
Shellfish_Aq_Report.pdf](https://image.slidesharecdn.com/7840cfe6-b48d-498a-8820-cc53d932f965-160403190522/85/OBXFS_2014_Capstone-90-320.jpg)
![91
Chorus I, Bartram J. 1999. Toxic Cyanobacteria in Water: A Guide to Their Public Health
Consequences, Monitoring and Management. [Internet]. F & FN Spon. Available from:
http://www.who.int/water_sanitation_health/resourcesquality/toxcyanbegin.pdf.
Inventory of SAV Maps and Survey Work in Coastal North Carolina (1981-2008) [Internet].
Morehead City(NC):NC Marine Fisheries; Available from:
http://www.ncfisheries.net/habitat/miscdownloads/SAV_mapping_inventory_2008.pdf
Keeler, A. Total Economic Value and Ecosystem Services. Lecture presented at: Coastal Studies
Institute; 2014 Oct 7; Wanchese, NC.
Kennedy V. Eastern Oyster [Internet]. Cambridge(MA):University of Maryland. Available from:
http://www.dnr.state.md.us/irc/docs/00000260_03.pdf
Kingston, RI . Adapted from Save the Bay; 1998. The Uncommon Guide to Common Life on
Narragansett Bay. Oyster toadfish (Opsanus tau); Unknown [cited 2014 Nov 20]; [1
screen]. Available from: http://www.edc.uri.edu/restoration/html/gallery/fish/toad.htm
Louisiana Revised Statutes. Chapter 59 Article 579,.2
Lutz CG, Sambidi P, Harrison RW. Agricultural Marketing Resource Center [Internet]. Ames
(IA): Ag Marketing Resource Center; c2002-2014. Oyster profile; 2012 [cited 2014 Dec 5];
[about 5 screens]. Available from:
http://www.agmrc.org/commodities__products/aquaculture/oyster-profile/
Maryland Department of Natural Resources. Shellfish Aquaculture. [Internet]. [cited 2014 Nov
21]. Available from: http://dnr2.maryland.gov/fisheries/Pages/aquaculture/shellfish.aspx
Mirabilio, S. 2014. Shellfish Regulation at the State Level. Lecture presented at: Coastal Studies
Institute; 2014 Nov 6; Wanchese, NC.
National Oceanic and Atmospheric Administration. Chesapeake Bay Office [Internet]. Blue
crab; August 2012 [cited 2014 Nov 16]; [7 screens]. Available from:
http://chesapeakebay.noaa.gov/fish-facts/blue-crab
NCSGA. North Carolina Shellfish Growers Association [Internet]. Available from:
http://www.ncagr.gov/markets/aquaculture/NCSG.html
Newell R. 1988. Ecological Changes in Chesapeake Bay: Are They the Result of
Overharvesting the American Oyster, Crassostrea Virginica? [Internet]. University of
Maryland, Horn Point Environmental Laboratories. [cited 2014 Nov 19]. Available from:
http://www.oyster-restoration.org/wp-content/uploads/2012/06/Newell-1988-filtering.pdf
Newell, R. 2004. Ecosystem influences of natural and cultivated populations of suspension
feeding bivalve molluscs: a review. Journal of Shellfish Research. [Internet]. Vol 23 (3):
867-874. [cited 2014 November 24]. Available from:
http://darc.cms.udel.edu/ibog/newellecobivalve2.pdf
Newell R, Koch E. 2004. Modeling seagrass density and distribution in response to changes
in turbidity stemming from bivalve filtration and seagrass sediment stabilization. Estuaries.
October 2004. [Internet]. Vol 27 (No. 5): 793-806. [cited 2014 Nov 26]. Available from:
http://www.coonamessettfarm.com/sitebuildercontent/sitebuilderfiles/Modeling_Seagrass_D
ensity_Distribution_in_Response.pdf
Newell R, Cornwell JC, Owens MS. 2002. Influence of simulated bivalve biodeposition
and microphytobenthos on sediment nitrogen dynamics: a laboratory study. [Internet]
.Limnology and Oceanography. 47(5): 1367-1379. [cited 2014 Nov 26]. Available from:
http://www.ecsga.org/Pages/Sustainability/bivalve_biodeposition_paper.pdf](https://image.slidesharecdn.com/7840cfe6-b48d-498a-8820-cc53d932f965-160403190522/85/OBXFS_2014_Capstone-91-320.jpg)
![92
NOAA Chesapeake Bay Office. 2014. Submerged Aquatic Vegetation [Internet]. NOAA
Chesapeake Bay Office. Available from: http://chesapeakebay.noaa.gov/submerged-aquatic-
vegetation/submerged-aquatic-vegetation
NOAA Chesapeake Bay Office. 2014. Oyster Reefs [Internet]. NOAA Chesapeake Bay
Office. [cited 20 November 2014]. Available from:
http://chesapeakebay.noaa.gov/oysters/oyster-reefs
North Carolina Coastal Federation. Oyster Habitat [Internet]. North Carolina Coast Federation.
Available from: http://www.nccoast.org/Content.aspx?key=0dec568b-85f4-4e84-86d1-
8a449db4055f&title=Oyster+Habitat
North Carolina Division of Marine Fisheries (NCDMF). North Carolina Shellfish Bottom Lease
Application [Internet]. Morehead City(NC): [Last Updated, cited 2014 November 10] .
Available from: http://portal.ncdenr.org/c/document_library/get_file?uuid=c44ecfcd-721f-
464d-84b3-e9c9d90f16c9&groupId=38337
North Carolina Division of Marine Fisheries. North Carolina Shellfish Lease Water Column
Application [Internet]. Morehead City(NC), cited 2014 November 10] . Available from:
http://portal.ncdenr.org/c/document_library/get_file?uuid=4b9a8236-63bd-40b2-a3d6-
cd3964ac3187&groupId=38337
North Carolina General Statutes. Chapter 1 Article 45.
North Carolina General Statutes. Chapter 113 Article 16.
North Carolina Rural Economic Development Center . 2013. A comparative case study of
Virginia and North Carolina’s oyster aquaculture development. [Internet]. [cited 2014 Dec
6]. Available from:
http://ncseagrant.ncsu.edu/ncseagrant_docs/products/2010s/comparative_study_va_nc_oyste
r_aquaculture.pdf
Ocean Water: Salinity [Internet]. Arlington (VA):Office of Naval Research; [cited 2014 Dec
6] . Available from: http://www.onr.navy.mil/focus/ocean/water/salinity1.html
Officer, C. G, Smayda, T. J., Mann, R. (1982). Benthic filter feeding: A natural eutrophication
control. Mar Ecol. Prog. Ser. 9: 203-210
Orth, R. et al. Long term trends in submersed aquatic vegetation (SAV) in Chesapeake Bay,
USA, related to water quality [Internet]. Estuaries and Coasts. 2010. Vol 33: 1144-1163.
[cited 2014 Nov 24]. Available from:
http://www.chesapeakebay.net/channel_files/13327/long-
term_trends_in_submerged_aquatic_vegetation.pdf
Peninsula Salt Water Sport Fisherman’s Association. [Internet]. Newport News (VA): Tautog;
unknown [cited 2014 Nov 24]; [2 screens]. Available from:
http://www.pswsfa.com/tautog.htm
Pollack J, Yoskowitz D, Kim HC, Montagna P. 2013. Role and Value of Nitrogen
Regulation Provided by Oysters (Crassostrea Virginica) in the Mission-Aransas Estuary,
Texas, USA [Internet]. PLoS One. Available from:
http://www.plosone.org/article/info%3Adoi%2F10.1371%2Fjournal.pone.0065314.
Pollack J, Montagna P, Yoskowitz D, Stunz G, Kim HC. 2010. Ecosystem Services of
Oyster Reefs [Internet]. Harte Research Institute for Gulf of Mexico Studies, Texas A&M
University-Corpus Christi. Available from:
https://www.estuaries.org/pdf/2010conference/tuesday16/spinnaker/session4/pollack-
ecosystem.pdf](https://image.slidesharecdn.com/7840cfe6-b48d-498a-8820-cc53d932f965-160403190522/85/OBXFS_2014_Capstone-92-320.jpg)
![93
Ruiz, JM et. al. Effects of Fish Farm Loadings on Seagrass (Posidonia oceanica) Distribution,
Growth and Photosynthesis [Internet]. Marine Pollution Bulletin. Vol. 42 (9): 749-760.
[cited 2014 Nov 21]. Available from: http://portal.nceas.ucsb.edu/working_group/valuation-
of-coastal-habitats/meta-analysis/papers-for-meta-analysis-database/seagrass-articles-
chris/newseagrass/ruiz2003mpb.pdf
Shellfish Aquaculture: Ecosystem Effects, Benthic-Pelagic Coupling and Potential for Nutrient
Trading [Internet]. University of Maryland Center for Environmental Science. [2012];
Available from: http://www.chesapeakebay.net/channel_files/18087/attachment_v_-
_oyster_aquaculture_report_2.pdf.
Shellfish Culture is Good for the Environment. East Coast Shellfish Growers Association
[Internet]. [cited 2014 Nov 20] [about 3 screens] Available from:
http://www.ecsga.org/Pages/Sustainability/CultureBenefits.htm
Shiavanto et. al. Legal and Regulatory Hurdles to Mariculture in Louisiana [Internet]. Baton
Rouge, Louisiana:Louisiana Seagrant. [cited 2014 Nov 3] [19 screens] Available from:
http://www.mcatoolkit.org/pdf/ISLMC_04/Schiavinato_Presentation.pdf
Skinner, M. a., Courtenay, S. C., McKindsey, C. W., Carver, C. E., & Mallet, A. L. (2014).
Experimental determination of the effects of light limitation from suspended bag oyster
(Crassostrea virginica) aquaculture on the structure and photosynthesis of eelgrass (Zostera
marina). Journal of Experimental Marine Biology and Ecology, 459, 169–180.
doi:10.1016/j.jembe.2014.05.012
Skinner, M., Courtenay, S., & McKindsey, C. (2013). Reductions in distribution, photosynthesis,
and productivity of eelgrass Zostera marina associated with oyster Crassostrea virginica
aquaculture. Marine Ecology Progress Series, 486, 105–119. doi:10.3354/meps10345
South Carolina Department of Natural Resources [Internet]. Columbia (SC): 2013. Marine
Species. Sheepshead; 2013 [cited 2014 Nov 22]; [4 screens]. Available from:
http://www.dnr.sc.gov/marine/species/sheepshead.html
Smith, Val H. and Schindler, David W. Eutrophication Science: Where do we go from here?
Trends in Ecology and Evolution. [Internet]. 2009. Vol 24 (4): 201-207. [cited 2014 Nov
28]. Available from:
http://izt.ciens.ucv.ve/ecologia/Archivos/ECO_POB%202009/ECOPO7_2009/Smith%20y
%20Schindler%202009.pdf
Smithsonian Marine Station at Fort Pierce. K. Hill [Internet]. Fort Pierce (FL): Species
Inventory. Archos_probat (Sheepshead); September 2005 [cited 2014 Nov 16]; [9 screens].
Available from: http://www.sms.si.edu/IRLSpec/Archos_probat.htm
Smithsonian Marine Station at Fort Pierce. Keith Sweat [Internet]. Fort Pierce (FL): Species
Inventory. Atlantic Mud Crab; August 20 2009 [cited 2014 Nov 16]; [7 screens]. Available
from: http://www.sms.si.edu/IRLSpec/Panope_herbsti.htm
Standard Conditions for Oyster Leasing Areas [Internet]. Baton Rouge(NC):Louisiana
Department of Wildlife and Fisheries (LDWF); [2007 February 28, cited 2014 December 5].
Available from:
http://dnr.louisiana.gov/assets/docs/coastal/CUP/oysteractivities/StandardConditionsOyster
LeasingArea.pdf
Street et. al. Coastal Habitat Protection Plan (2005) [Internet]. Morehead City (NC):NC Division
of Marine Fisheries. [cited 2014 Nov 3] Available from:
http://www.ncfisheries.net/habitat/chpp2k5/_Complete%20CHPP.pdf](https://image.slidesharecdn.com/7840cfe6-b48d-498a-8820-cc53d932f965-160403190522/85/OBXFS_2014_Capstone-93-320.jpg)
![94
Tallman J, Forrester G. Oyster Grow-Out Cages Function as Artificial Reefs for Temperate
Fishes. Transactions of the American Fisheries Society. 2007 [cited 2014 Dec 5]; 136: 790–
799.
Thomas M. Soniat, Christopher M. Finelli, and Jenny T. Ruiz. 2004. Vertical Structure and
Predator Refuge Mediate Oyster Reef Development and Community Dynamics [Internet].
Elsevier. [cited 2014 Nov 5]; [about 2 screens] Available from:
http://www.sciencedirect.com/science/article/pii/S0022098104002497.
Turano, Marc J. North Carolina Aquaculture Development Conference. 2013. Shellfish
Production Methods and Economics - Eastern Oyster [Internet]. [cited 2014 Nov 9]; [about
18 screens] Available from:
http://www.ncaquaculture.org/pdfs/2013_marine_session/turano_economics.pdf
United States Army Corp of Engineers. 2012. Decision Document Nationwide Permit 48
[Internet]. [cited 2014 Nov 7]; [about 48 screens] Available from:
http://www.usace.army.mil/Portals/2/docs/civilworks/nwp/2012/NWP_48_2012.pdf
University of Rhode Island Environmental Data Center [Internet]. Kingston (RI); c2014. [cited
2014 Nov 4]. Available from: http://www.edc.uri.edu
University of North Carolina Wilmington. The North Carolina Shellfish Siting Tool. [Internet]
[cited 2014 Nov 6]; [about 2 screens] http://uncw.edu/benthic/sitingtool/
Virginia Institute of Marine Sciences. [Internet] Glouchester Point (VA). Marty Cavalluzzi. Fish
of the Month. Feather Blenny; 1999 July 13 [cited 2014 Nov 20]; [2 screens]. Available
from: http://www.fisheries.vims.edu/blenny.htm
Virginia Marine Resources Commission. Shellfish Aquaculture, Farming and Gardening
[Internet]. (VA):Virginia.gov; [cited 2014 Nov 23]. Available from:
http://www.mrc.virginia.gov/Shellfish_Aquaculture.shtm
Woods Hole Sea Grant. 2000 Sep. Shellfish Aquaculture in Massachusetts [Internet]. Woods
Hole (MA):Woods Hole Oceanographic Institution. [cited 2014 Dec 6]; [about 5 screens].
Available from: http://www.whoi.edu/seagrant/page.do?pid=51817&tid=282&cid=88727](https://image.slidesharecdn.com/7840cfe6-b48d-498a-8820-cc53d932f965-160403190522/85/OBXFS_2014_Capstone-94-320.jpg)


![Closed loop Urbanism [Autosaved]](https://cdn.slidesharecdn.com/ss_thumbnails/40783ce2-f8fb-43df-b422-fc3b0ac7d766-160328143157-thumbnail.jpg?width=640&height=640&fit=bounds)


