Download as PDF, PPTX

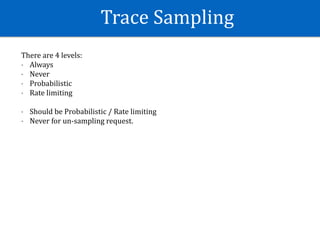
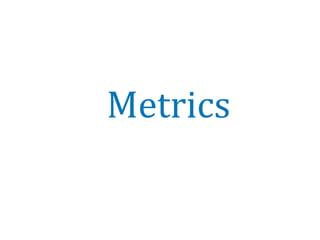
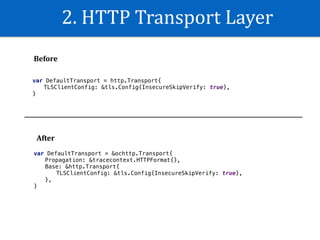
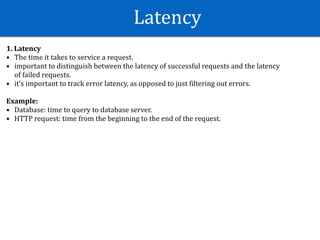
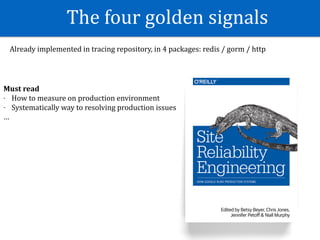
![Why use OpenCensus / OpenTracing
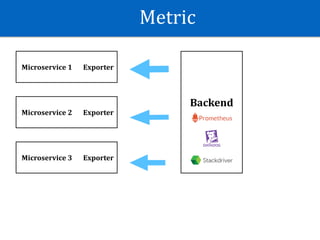
- Standard format with backend (Jaeger, Zipkin, …)
- Abstract logic code.
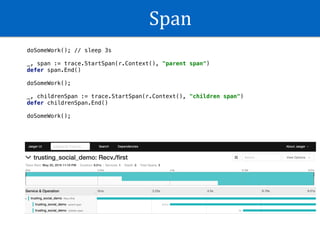
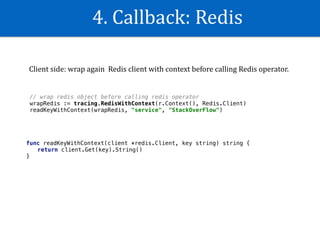
_, span := trace.StartSpan(r.Context(), "child")
defer span.End()
span.Annotate([]trace.Attribute{trace.StringAttribute("key", "value")}, “querying")
span.AddAttributes(trace.StringAttribute("hello", "world"))
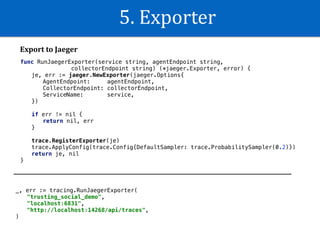
je, err := jaeger.NewExporter(jaeger.Options{
AgentEndpoint: agentEndpoint,
CollectorEndpoint: collectorEndpoint,
ServiceName: service,
})
trace.RegisterExporter(je)](https://image.slidesharecdn.com/2019-06-observability-191228121633/85/Observability-and-its-application-16-320.jpg)


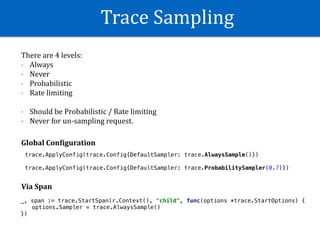
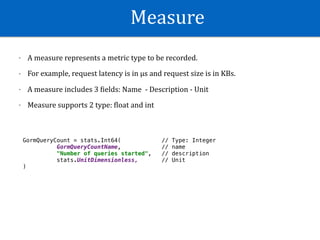
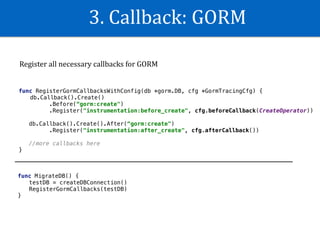
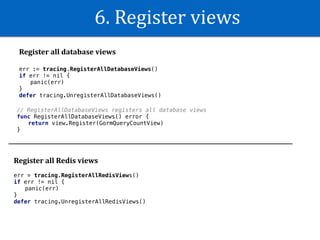
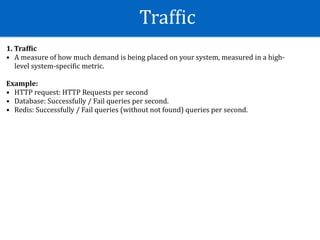
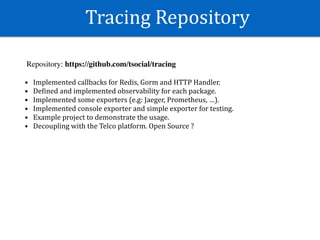
![View
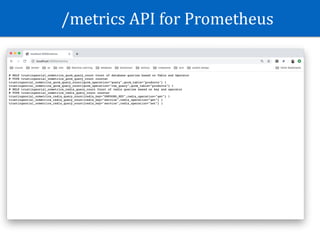
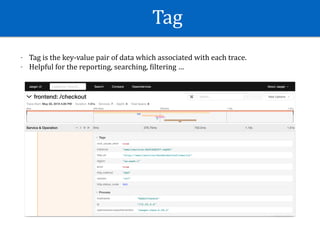
- Views are the coupling of an Aggregation applied to a Measure and optionally Tags.
- Supported aggregation function: Count / Distribution / Sum / LastValue.
- Multiple views can use same measure but only when different aggregation.
- The various tags used to group and Wilter collected metrics later on.
GormQueryCountView = &view.View{
Name: GormQueryCountName,
Description: "Count of database queries based on Table and Operator",
TagKeys: []tag.Key{GormOperatorTag, GormTableTag},
Measure: GormQueryCount,
Aggregation: view.Count(),
}](https://image.slidesharecdn.com/2019-06-observability-191228121633/85/Observability-and-its-application-42-320.jpg)
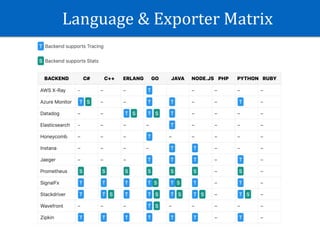
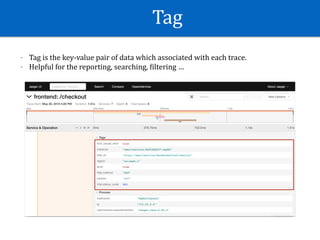
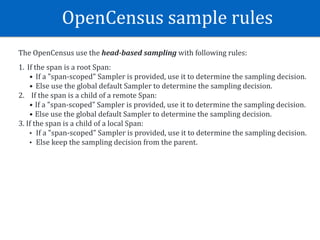
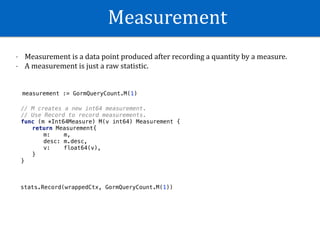
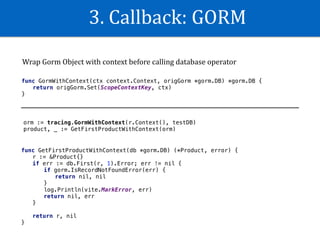
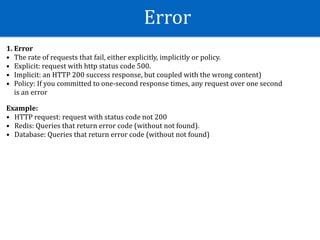
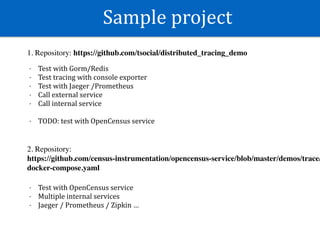
![Context Propagation: B3 Standard
Header Data:
X-B3-Sampled:[1]
X-B3-Spanid:[dacdb2208f874447]
X-B3-Traceid:[9ca4a513af5f299a856dec51336a051b]
var requestOption = comm.RequestOption{
Transport: &ochttp.Transport{
Propagation: &b3.HTTPFormat{},
Base: &http.Transport{
TLSClientConfig: &tls.Config{InsecureSkipVerify: true},
},
},
}](https://image.slidesharecdn.com/2019-06-observability-191228121633/85/Observability-and-its-application-45-320.jpg)
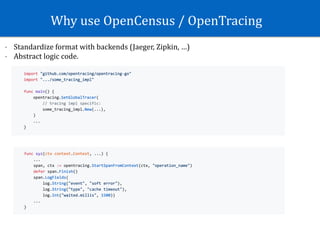
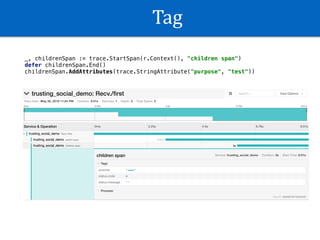
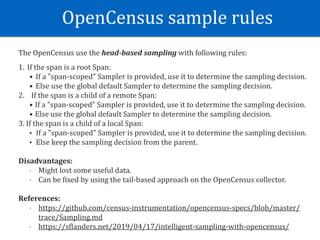
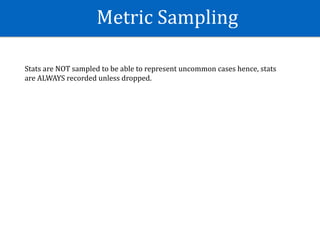
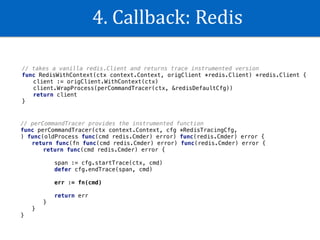
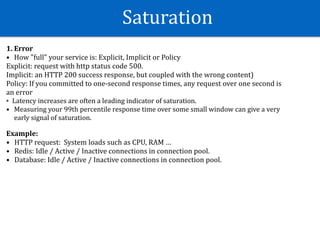
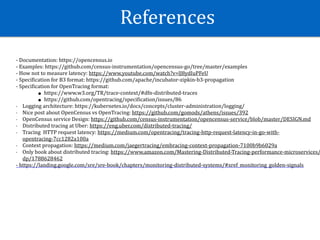
![Context Propagation: OpenTracing Standard
Header Data:
Traceparent:[00-a9f4dc05b7a78f6f2f717d7396d9450f-187065dac4cd685c-01]
var requestOption = comm.RequestOption{
Transport: &ochttp.Transport{
Propagation: &tracecontext.HTTPFormat{},
Base: &http.Transport{
TLSClientConfig: &tls.Config{InsecureSkipVerify: true},
},
},
}](https://image.slidesharecdn.com/2019-06-observability-191228121633/85/Observability-and-its-application-46-320.jpg)
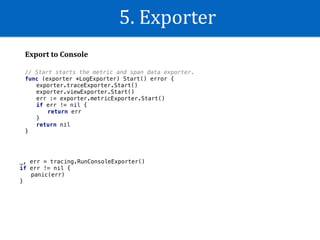
![5. Exporter
Export to Prometheus
func RunPrometheusExporter(namespace string) (*prometheus.Exporter, error) {
pe, err := prometheus.NewExporter(prometheus.Options{
Namespace: namespace,
})
view.RegisterExporter(pe)
return pe, nil
}
// add api endpoint for prometheus
app.Mux.Handle("/metrics", pe)
scrape_configs:
- job_name: 'trustingsocial_ocmetrics'
scrape_interval: 5s
static_configs:
- targets: ['host.docker.internal:3000']
Create entry point /metrics for prometheus service call
Sample prometheus conWiguration:](https://image.slidesharecdn.com/2019-06-observability-191228121633/85/Observability-and-its-application-57-320.jpg)
![Export trace
func (exporter *TraceExporter) ExportSpan(sd *trace.SpanData) {
var (
traceID = hex.EncodeToString(sd.SpanContext.TraceID[:])
spanID = hex.EncodeToString(sd.SpanContext.SpanID[:])
parentSpanID = hex.EncodeToString(sd.ParentSpanID[:])
)
// RunJaegerExporter exports trace to Jaeger
}
func (exporter *TraceExporter) Start() {
trace.RegisterExporter(exporter)
}
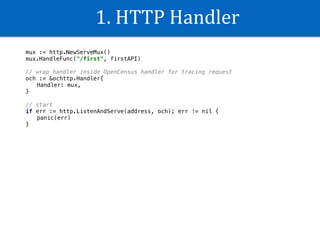
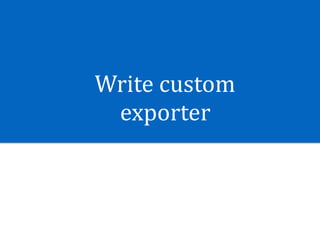
1. Implement ExportSpan function
2. Call trace.RegisterExporter](https://image.slidesharecdn.com/2019-06-observability-191228121633/85/Observability-and-its-application-60-320.jpg)
![Export metric
// ExportMetrics implements metricexport.Exporter's interface.
func (exporter *MetricExporter) ExportMetrics(ctx context.Context,
metrics []*metricdata.Metric) error {
for _, metric := range metrics {
// process each metric
}
return nil
}
// Start starts printing log
func (exporter *MetricExporter) Start() error {
exporter.initReaderOnce.Do(func() {
exporter.intervalReader, _ = metricexport.NewIntervalReader(
exporter.reader,
exporter,
)
})
exporter.intervalReader.ReportingInterval = exporter.reportingInterval
return exporter.intervalReader.Start()
}
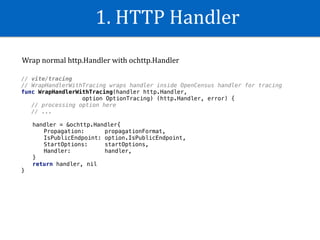
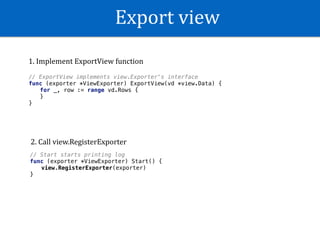
1. Implement ExportMetrics function
2. Interval polling to get latest metric data](https://image.slidesharecdn.com/2019-06-observability-191228121633/85/Observability-and-its-application-62-320.jpg)


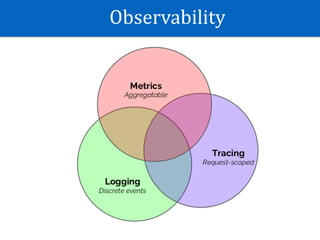
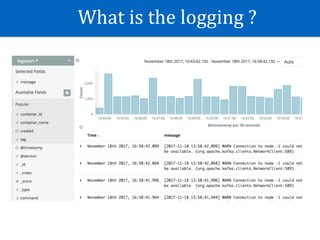
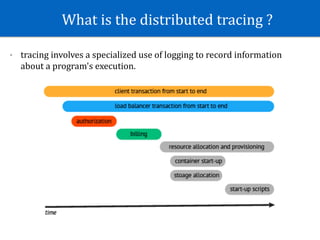
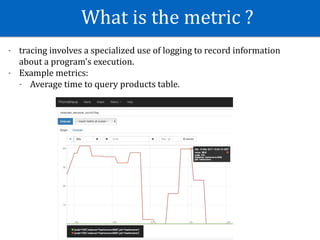
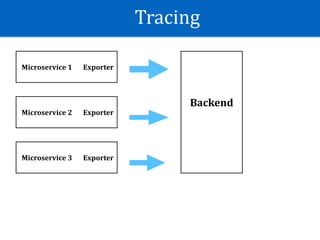
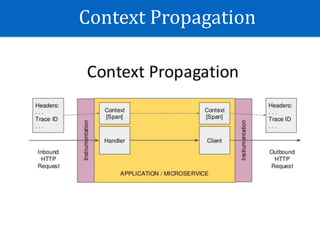
The document discusses observability practices, particularly focusing on logging and distributed tracing, highlighting the roles of metrics in monitoring system performance. It explains the concepts of traces, spans, and tags in tracing, alongside the importance of tools like OpenCensus for standardizing backends and enabling intelligent sampling. Additionally, it covers the implementation of tracing and metrics collection using various libraries and supports various configurations for effective observability.