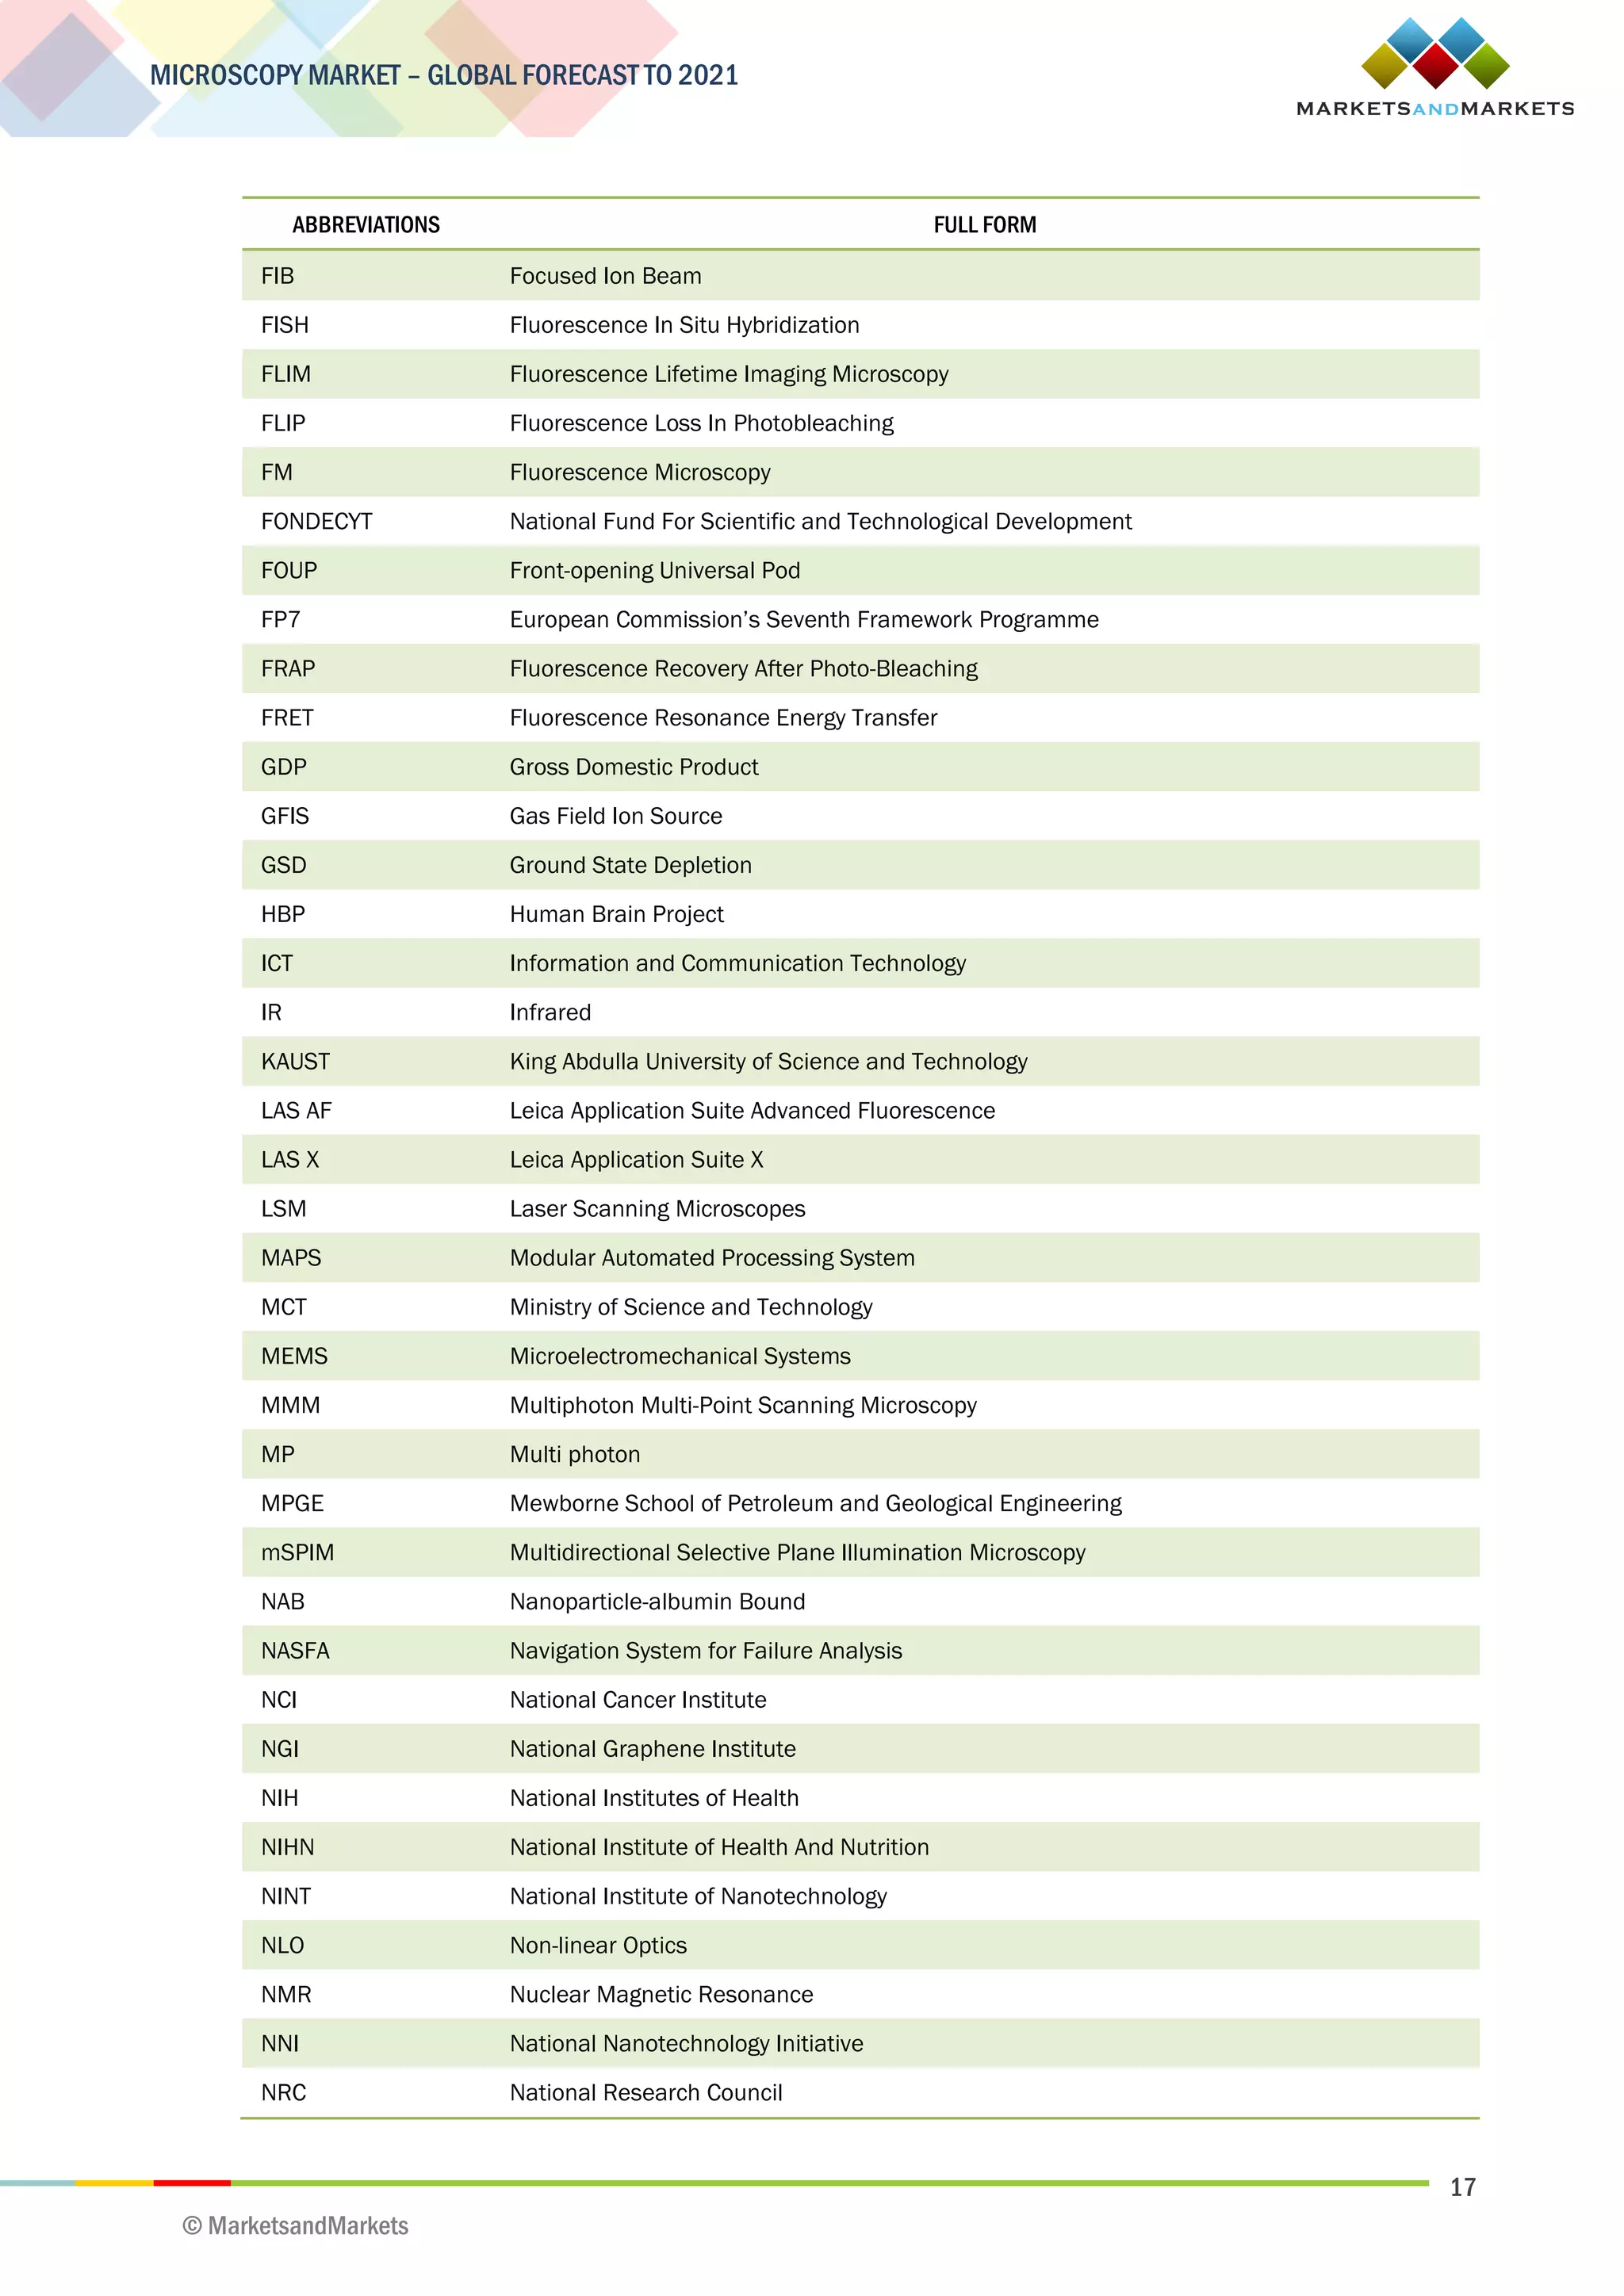
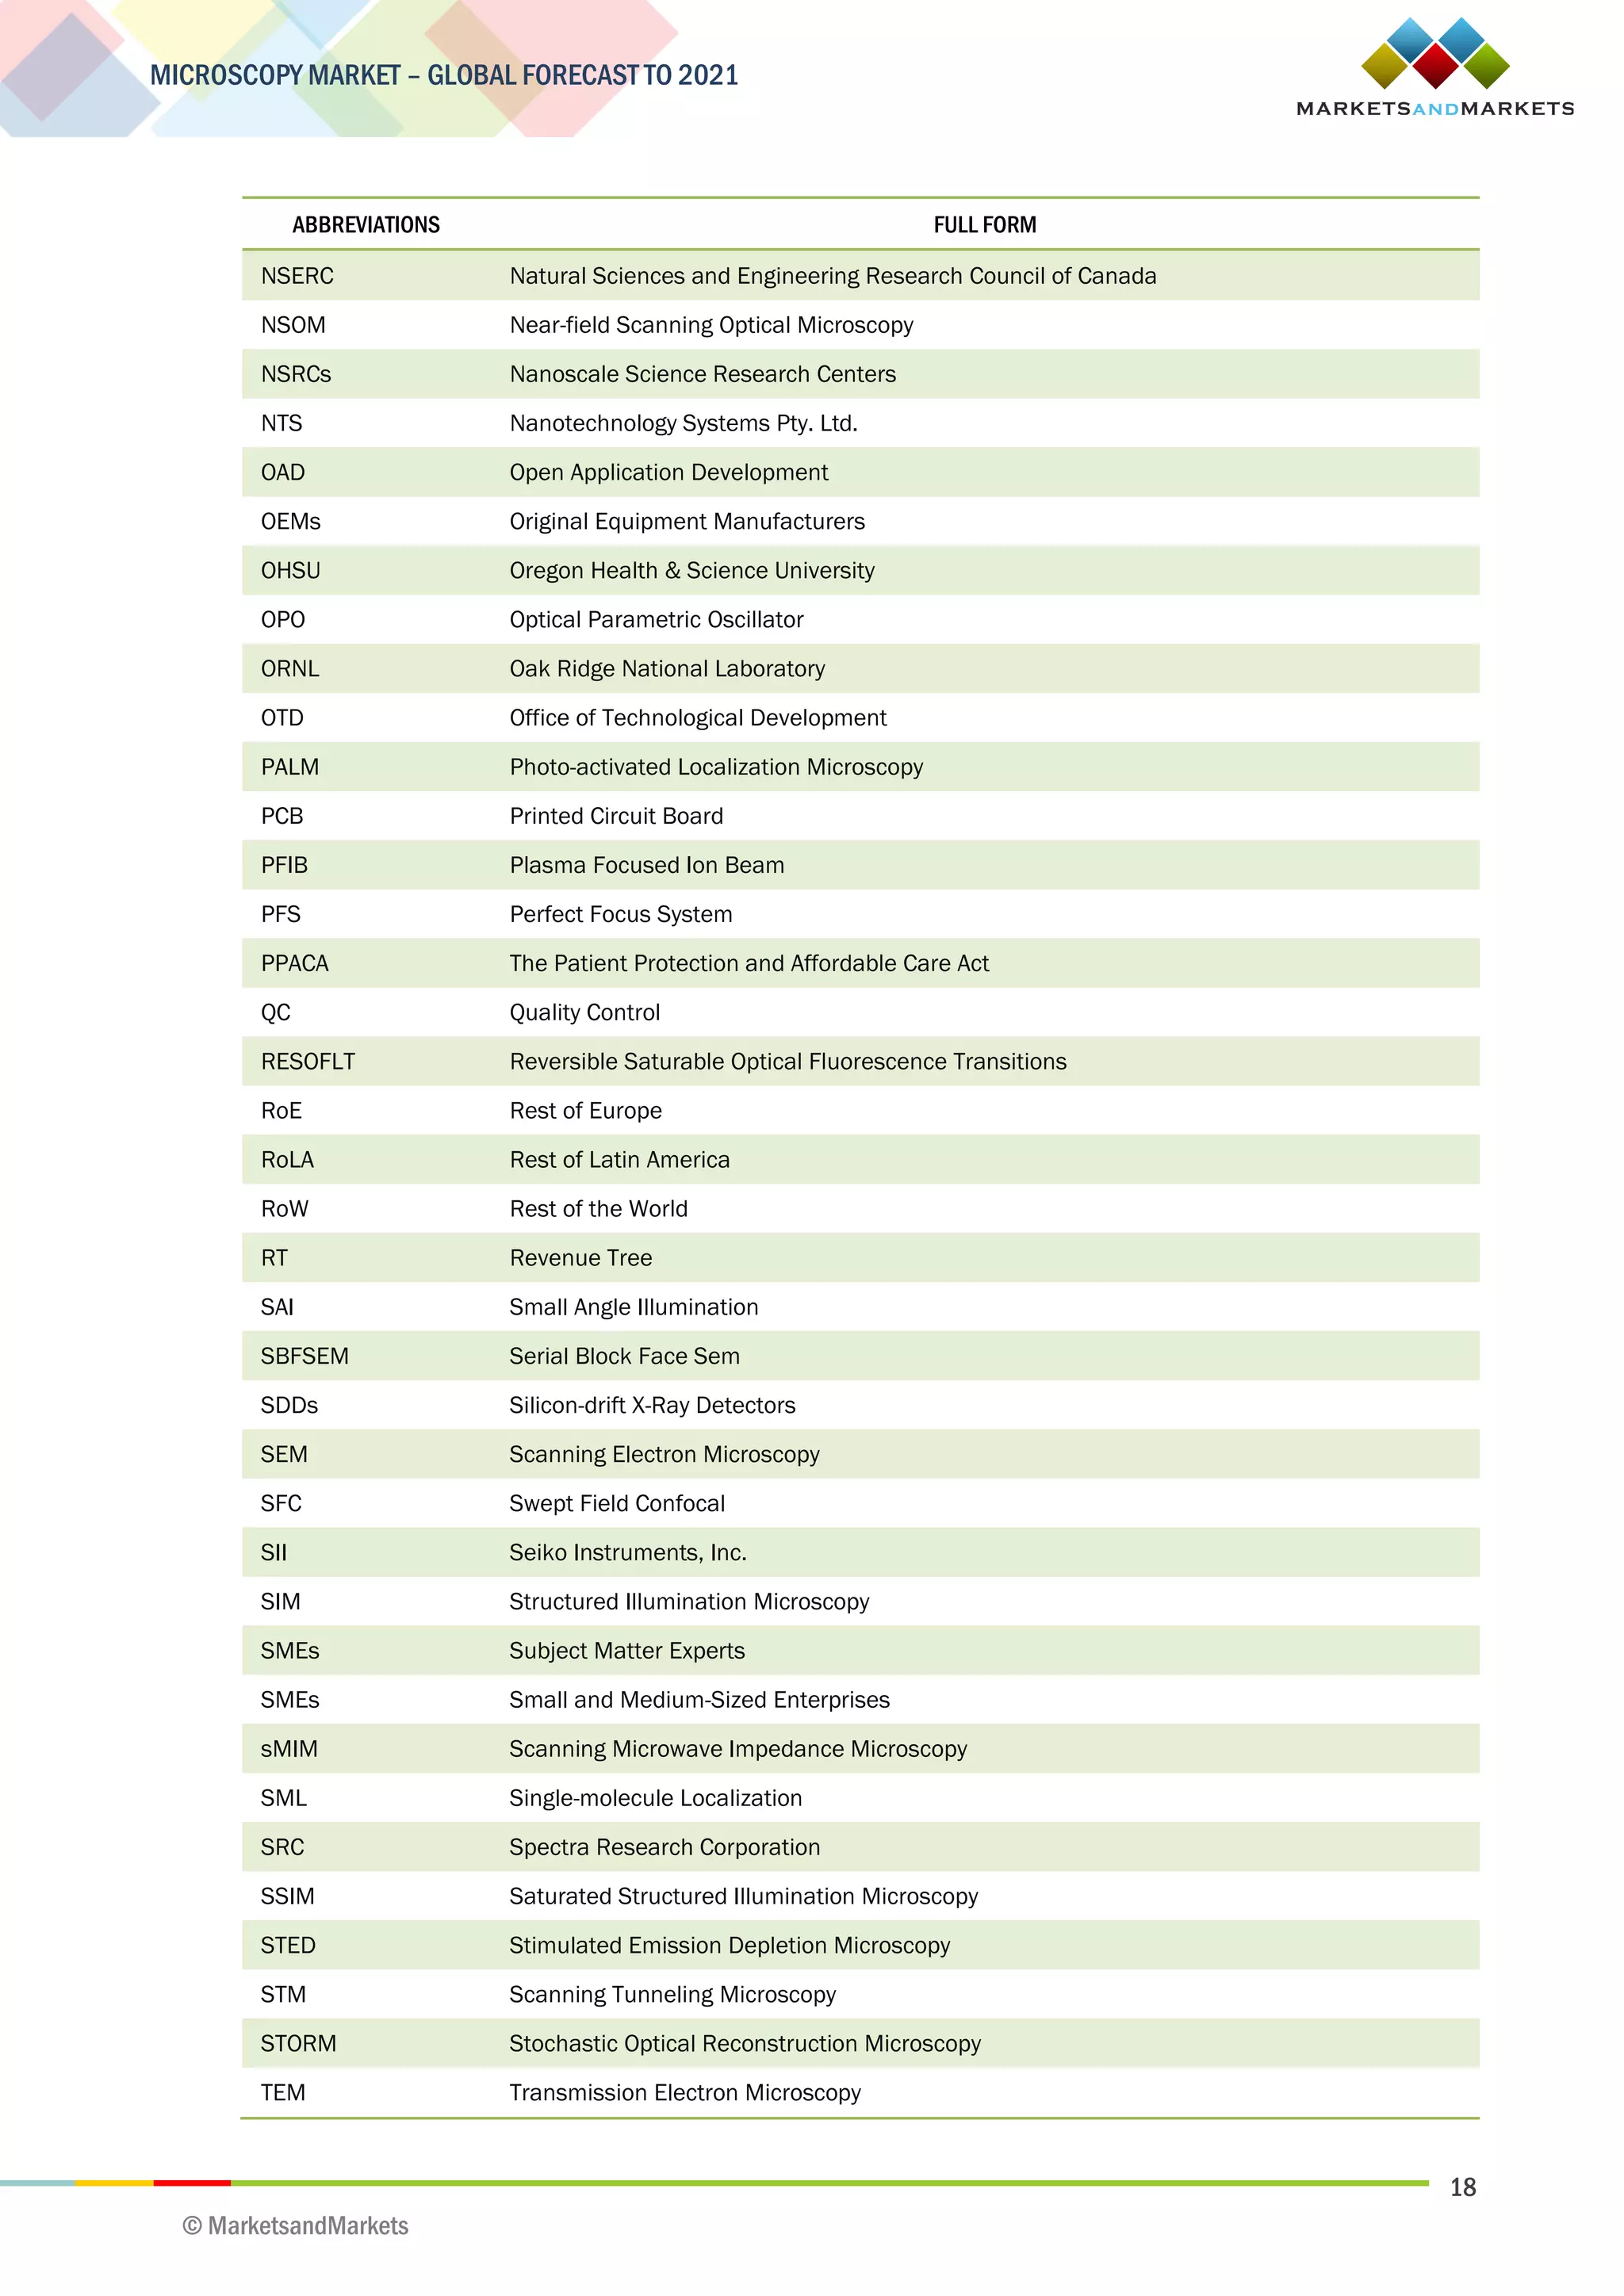
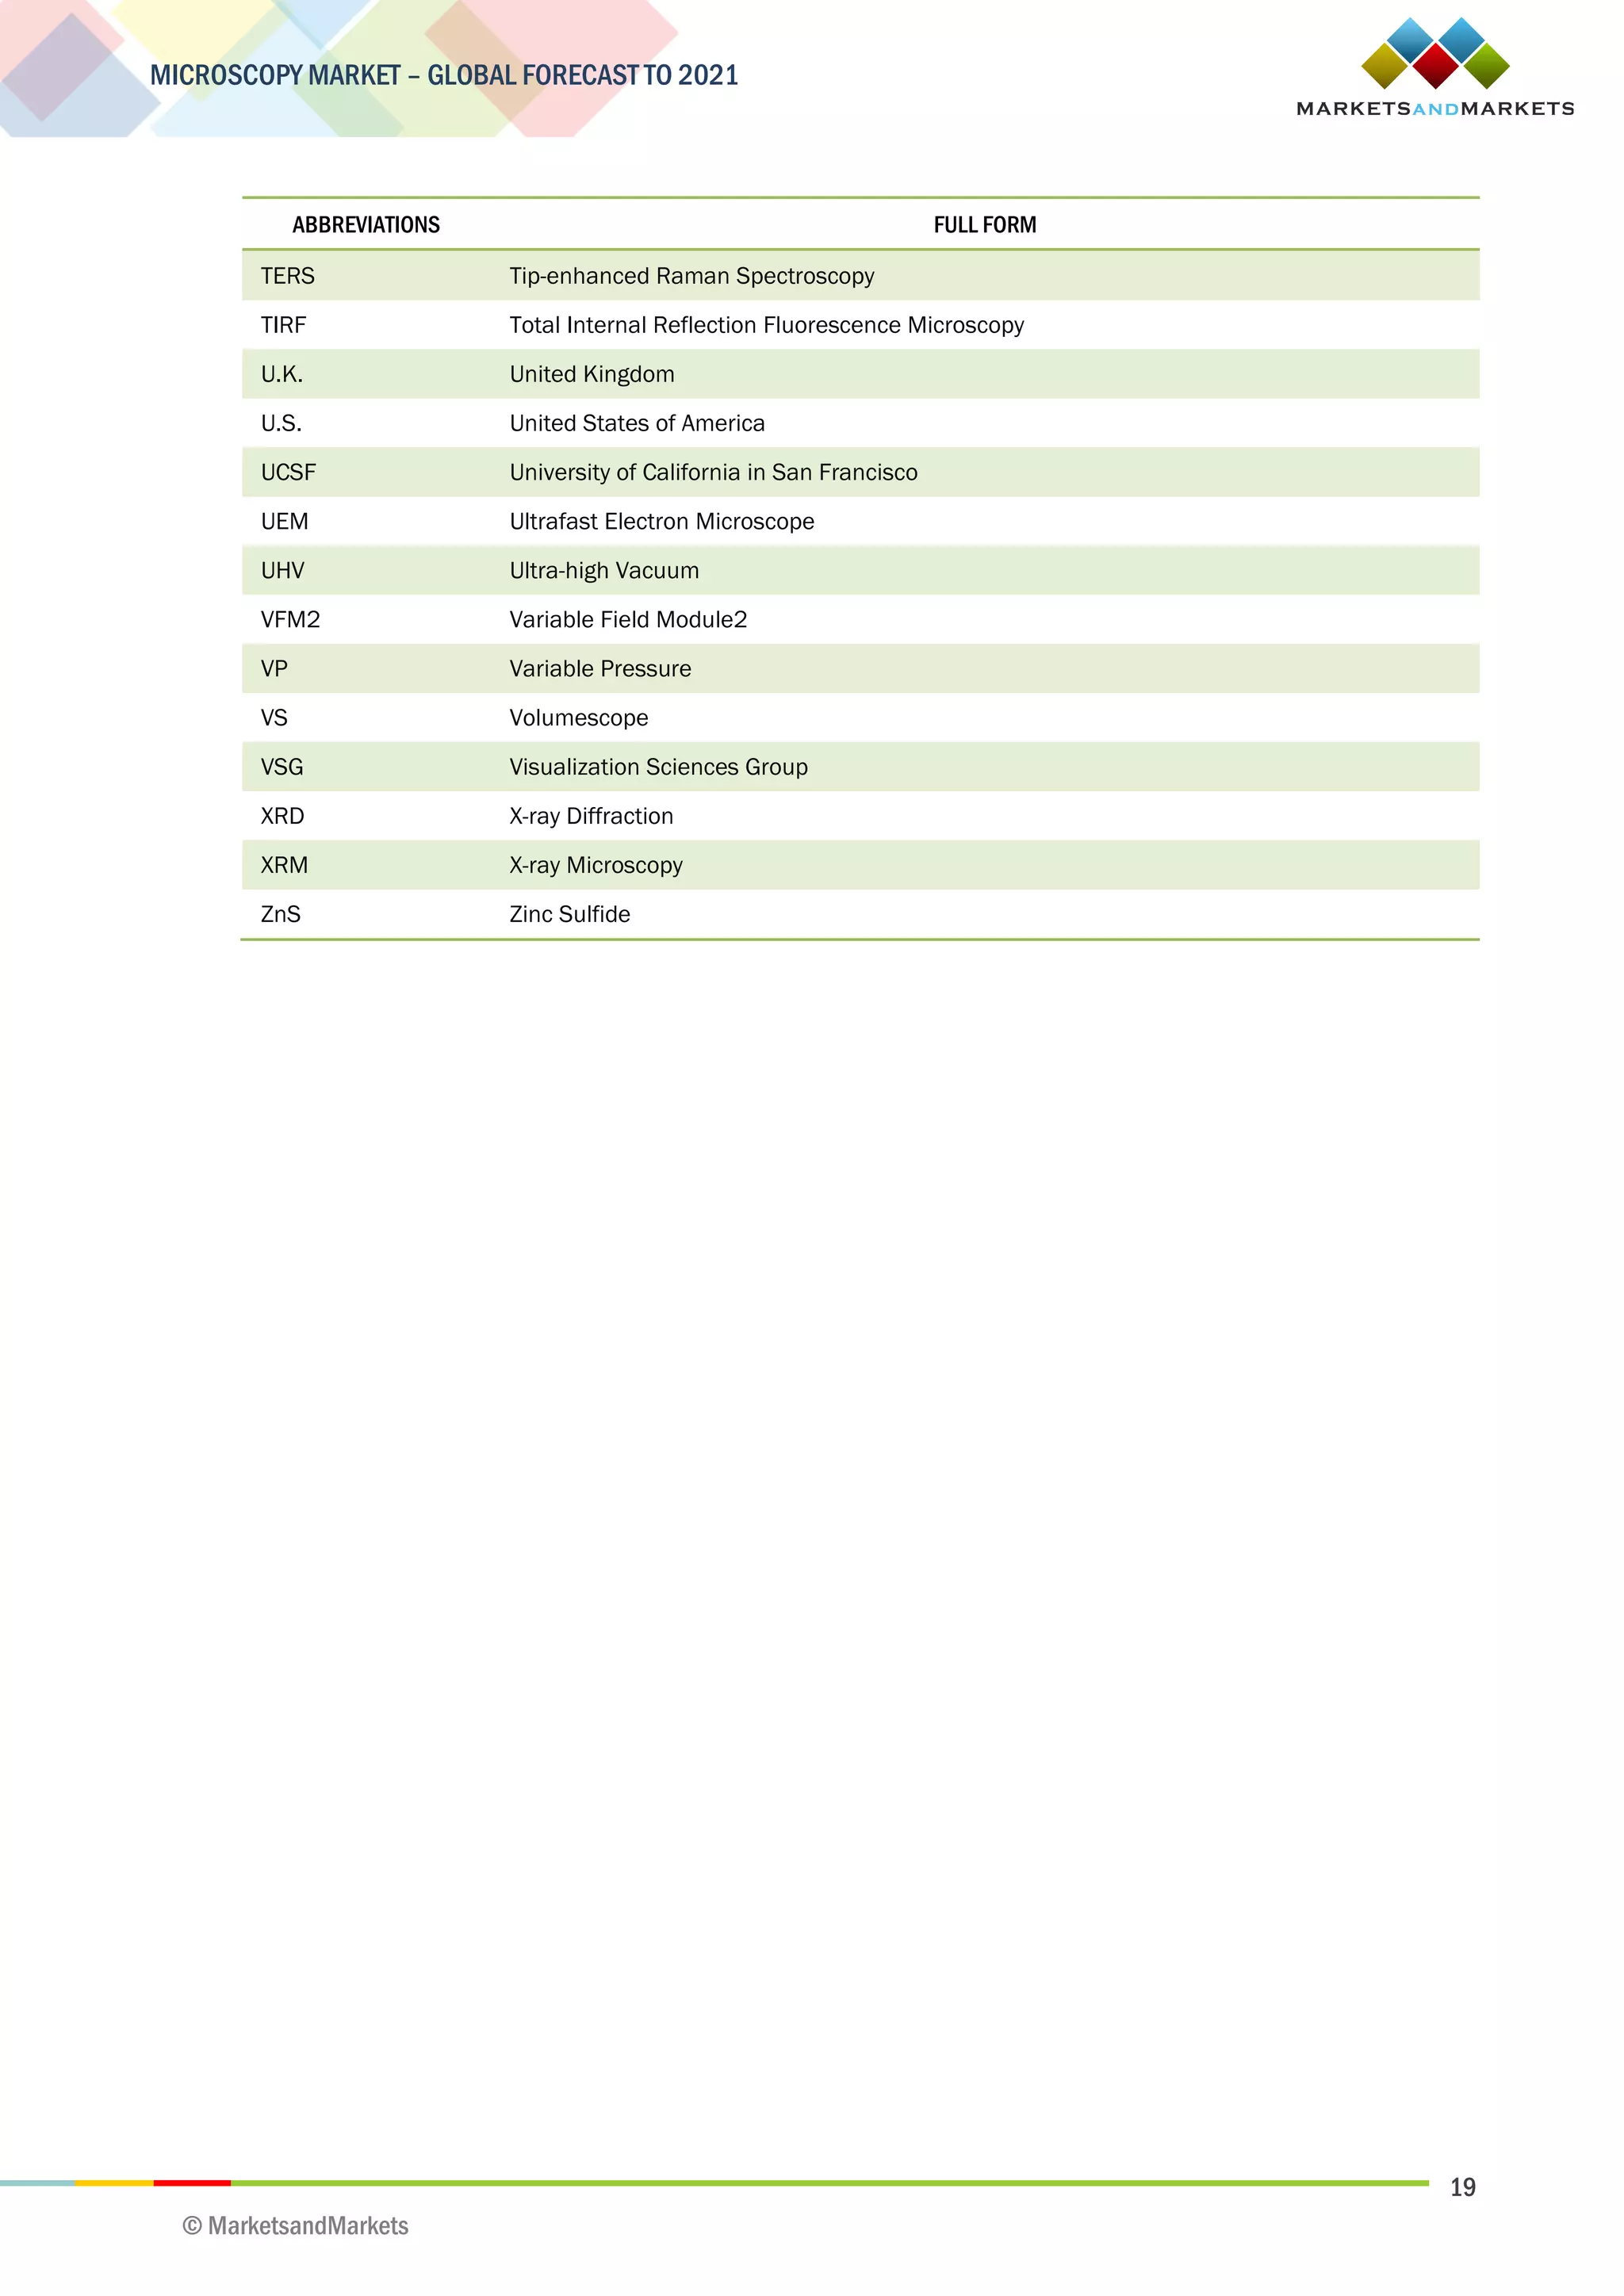
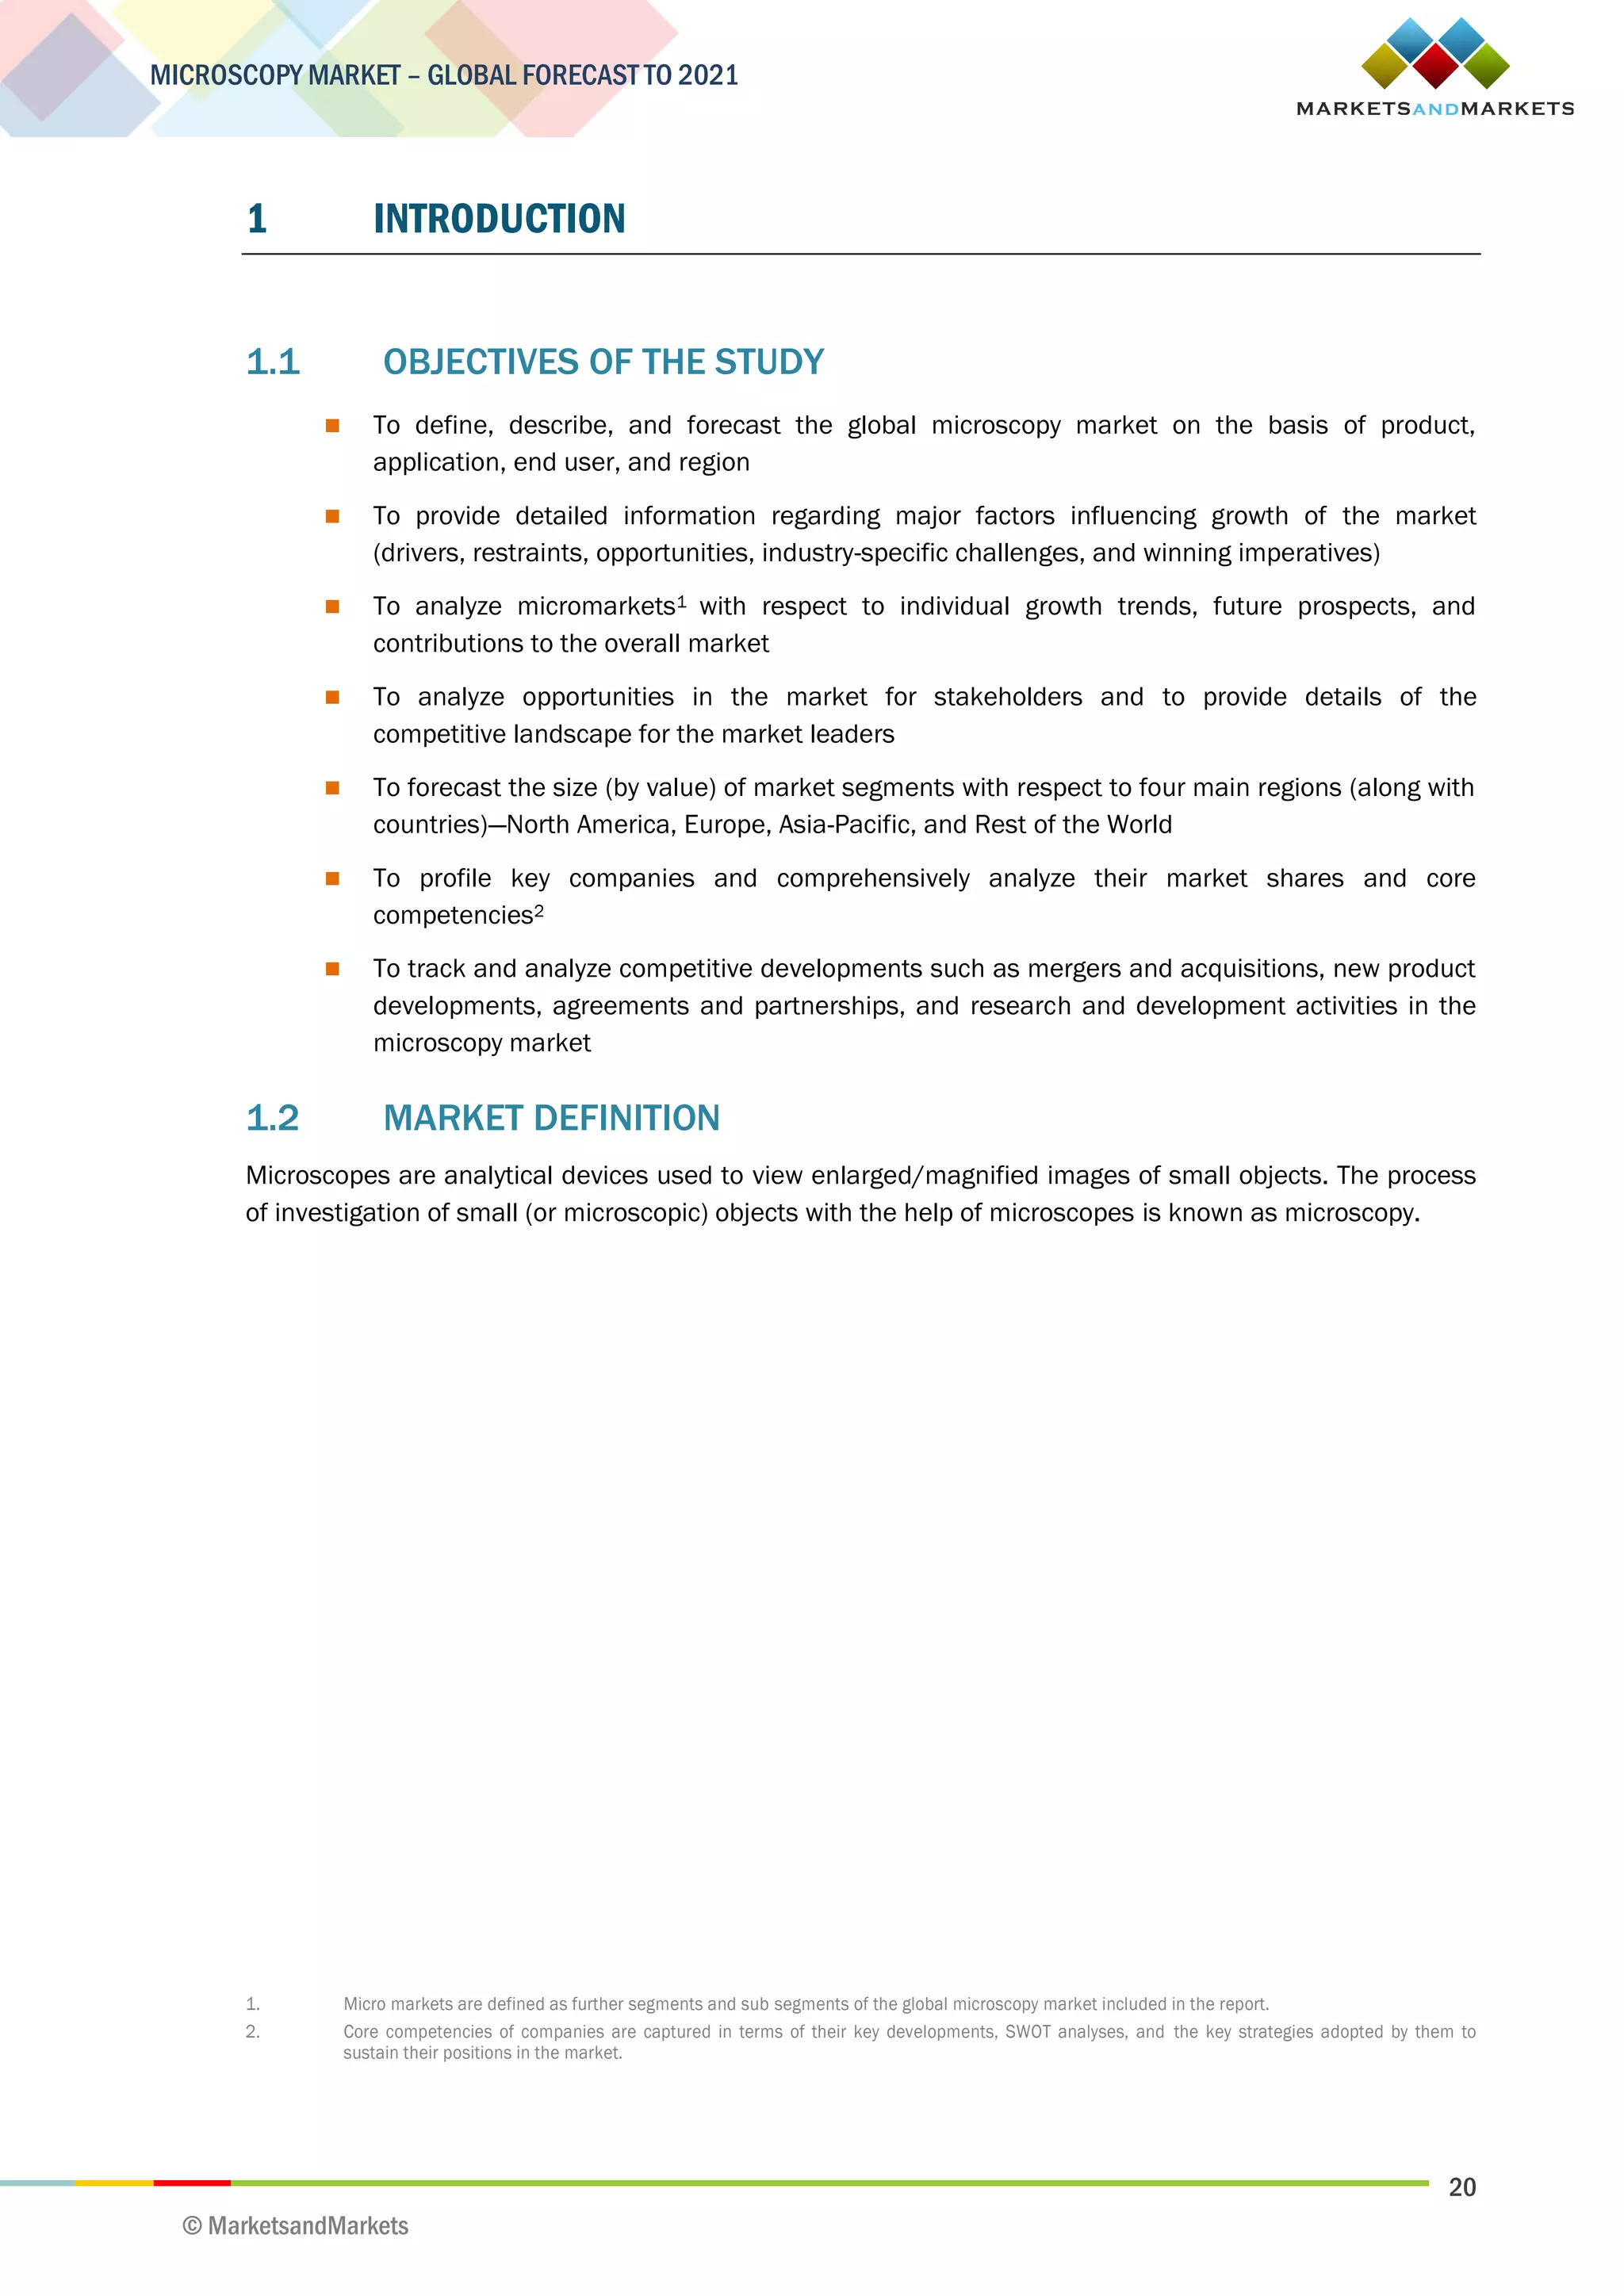
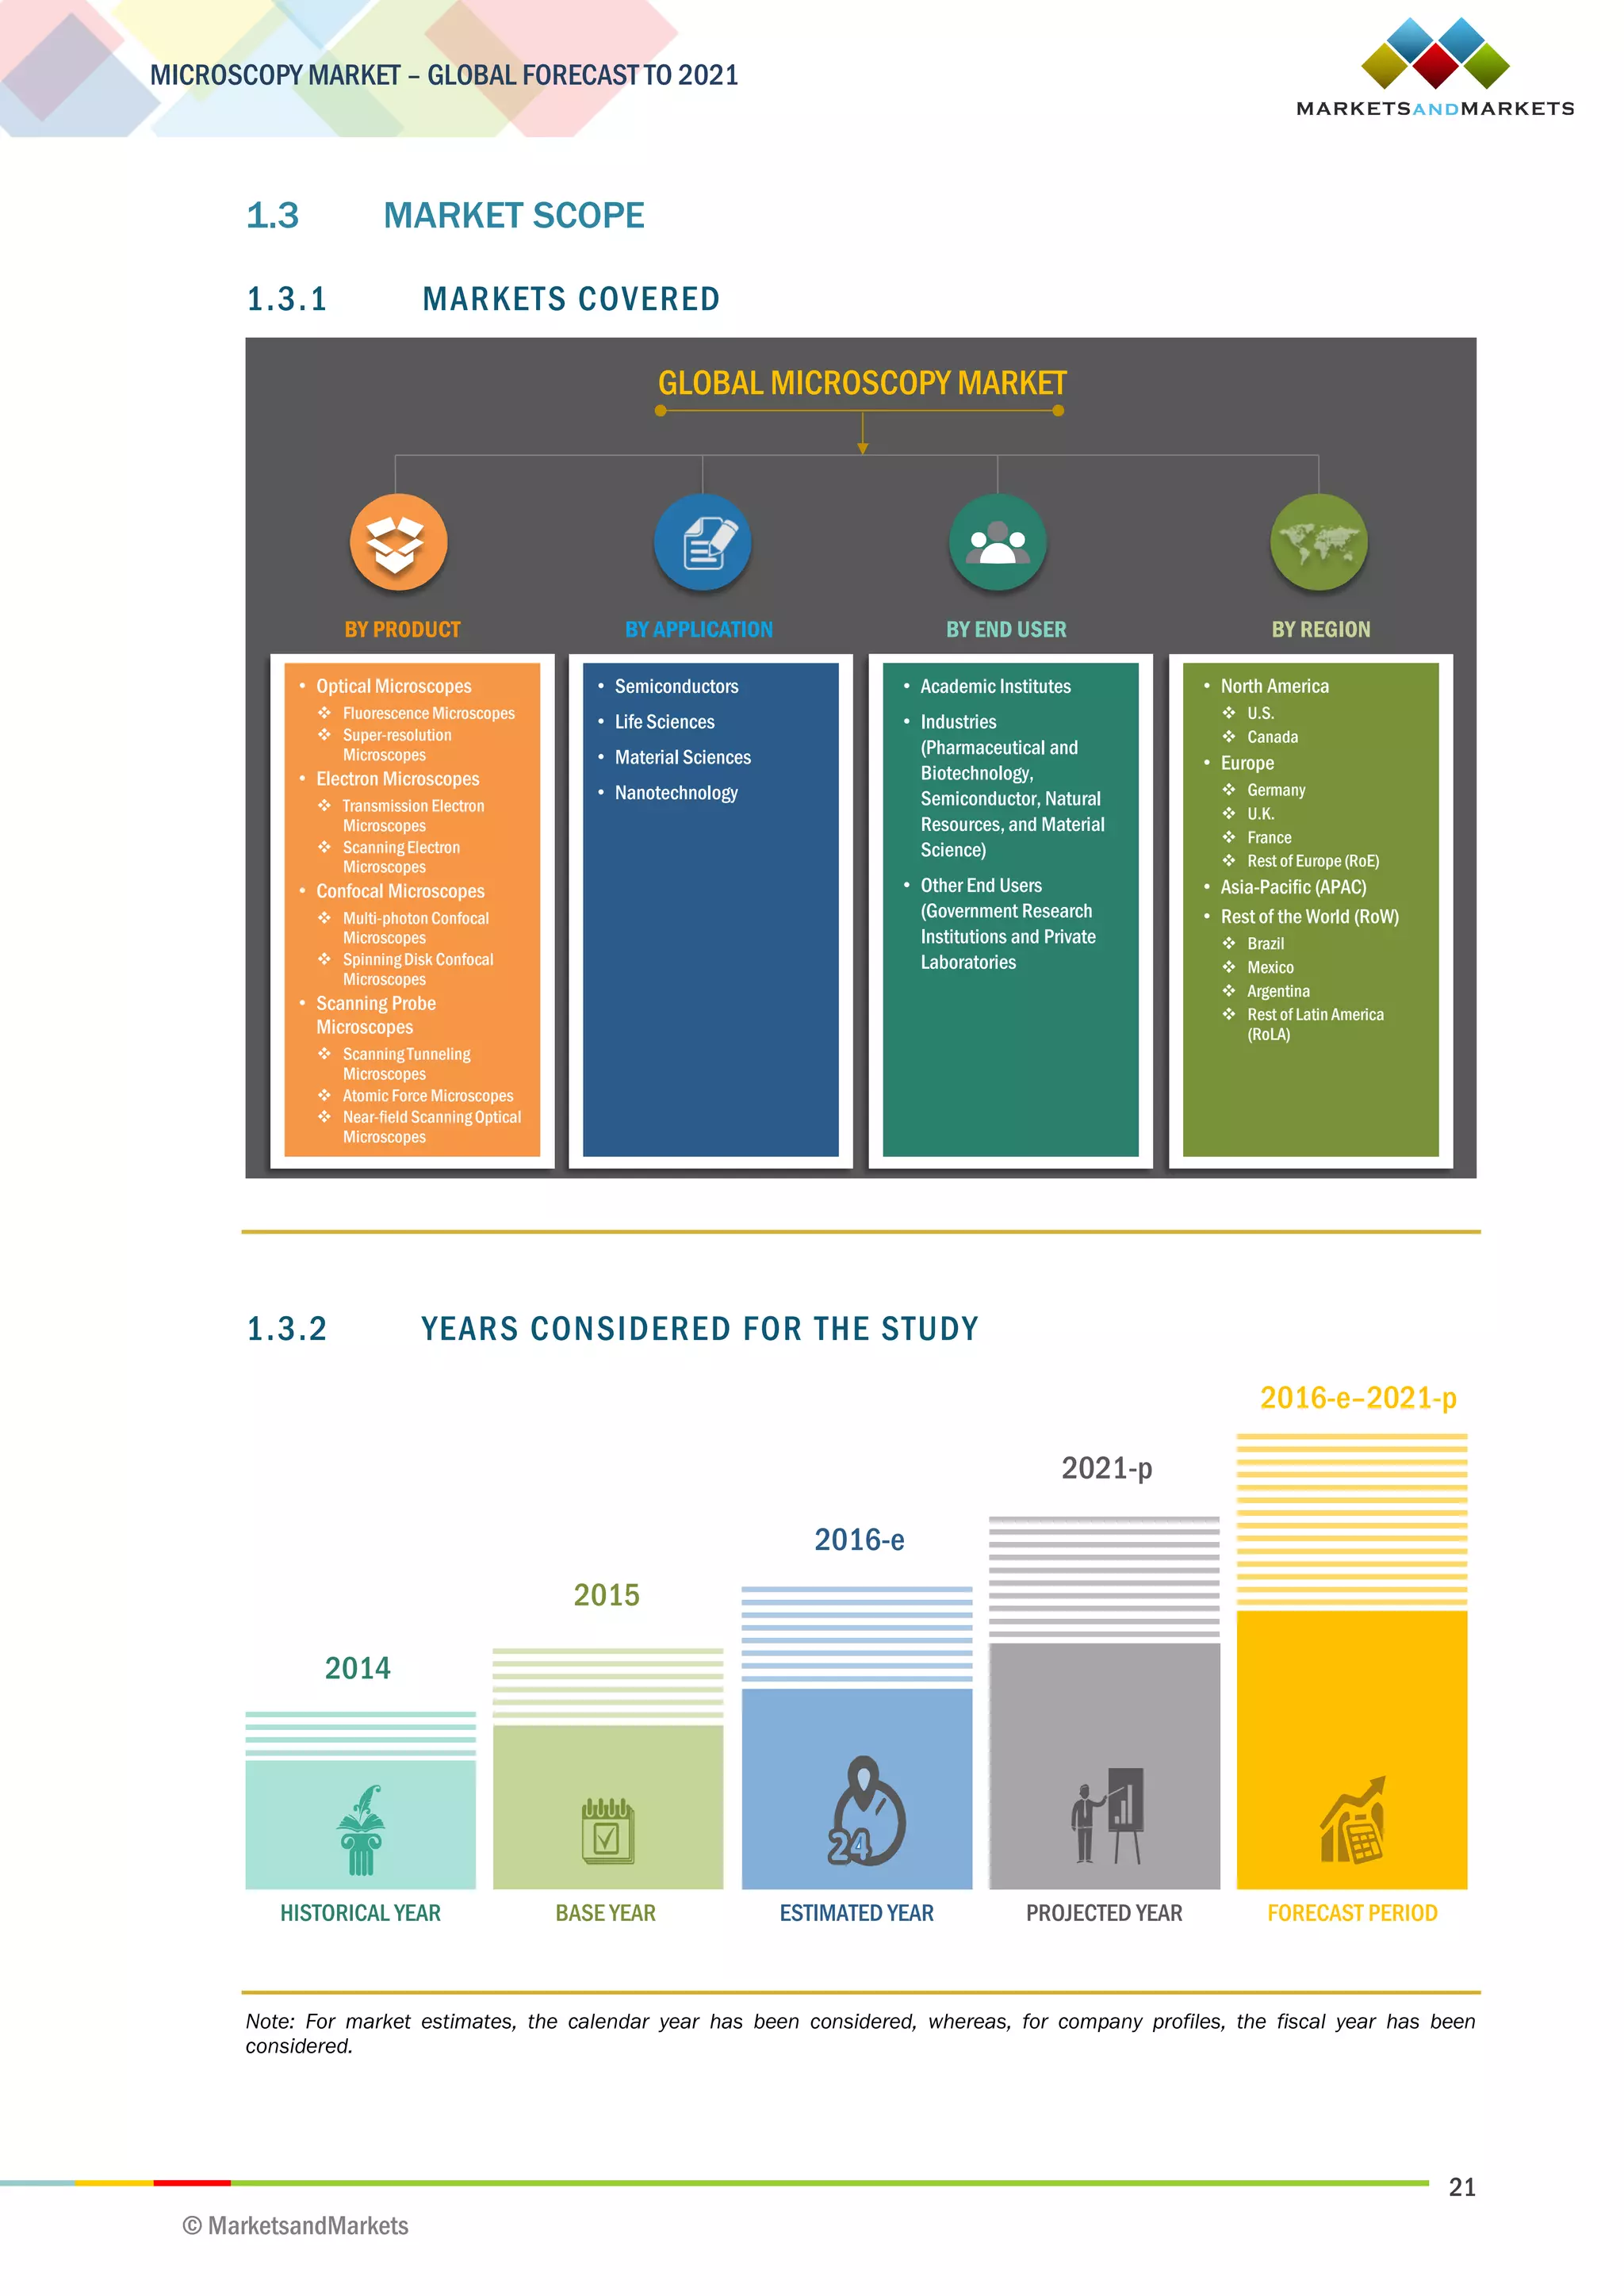
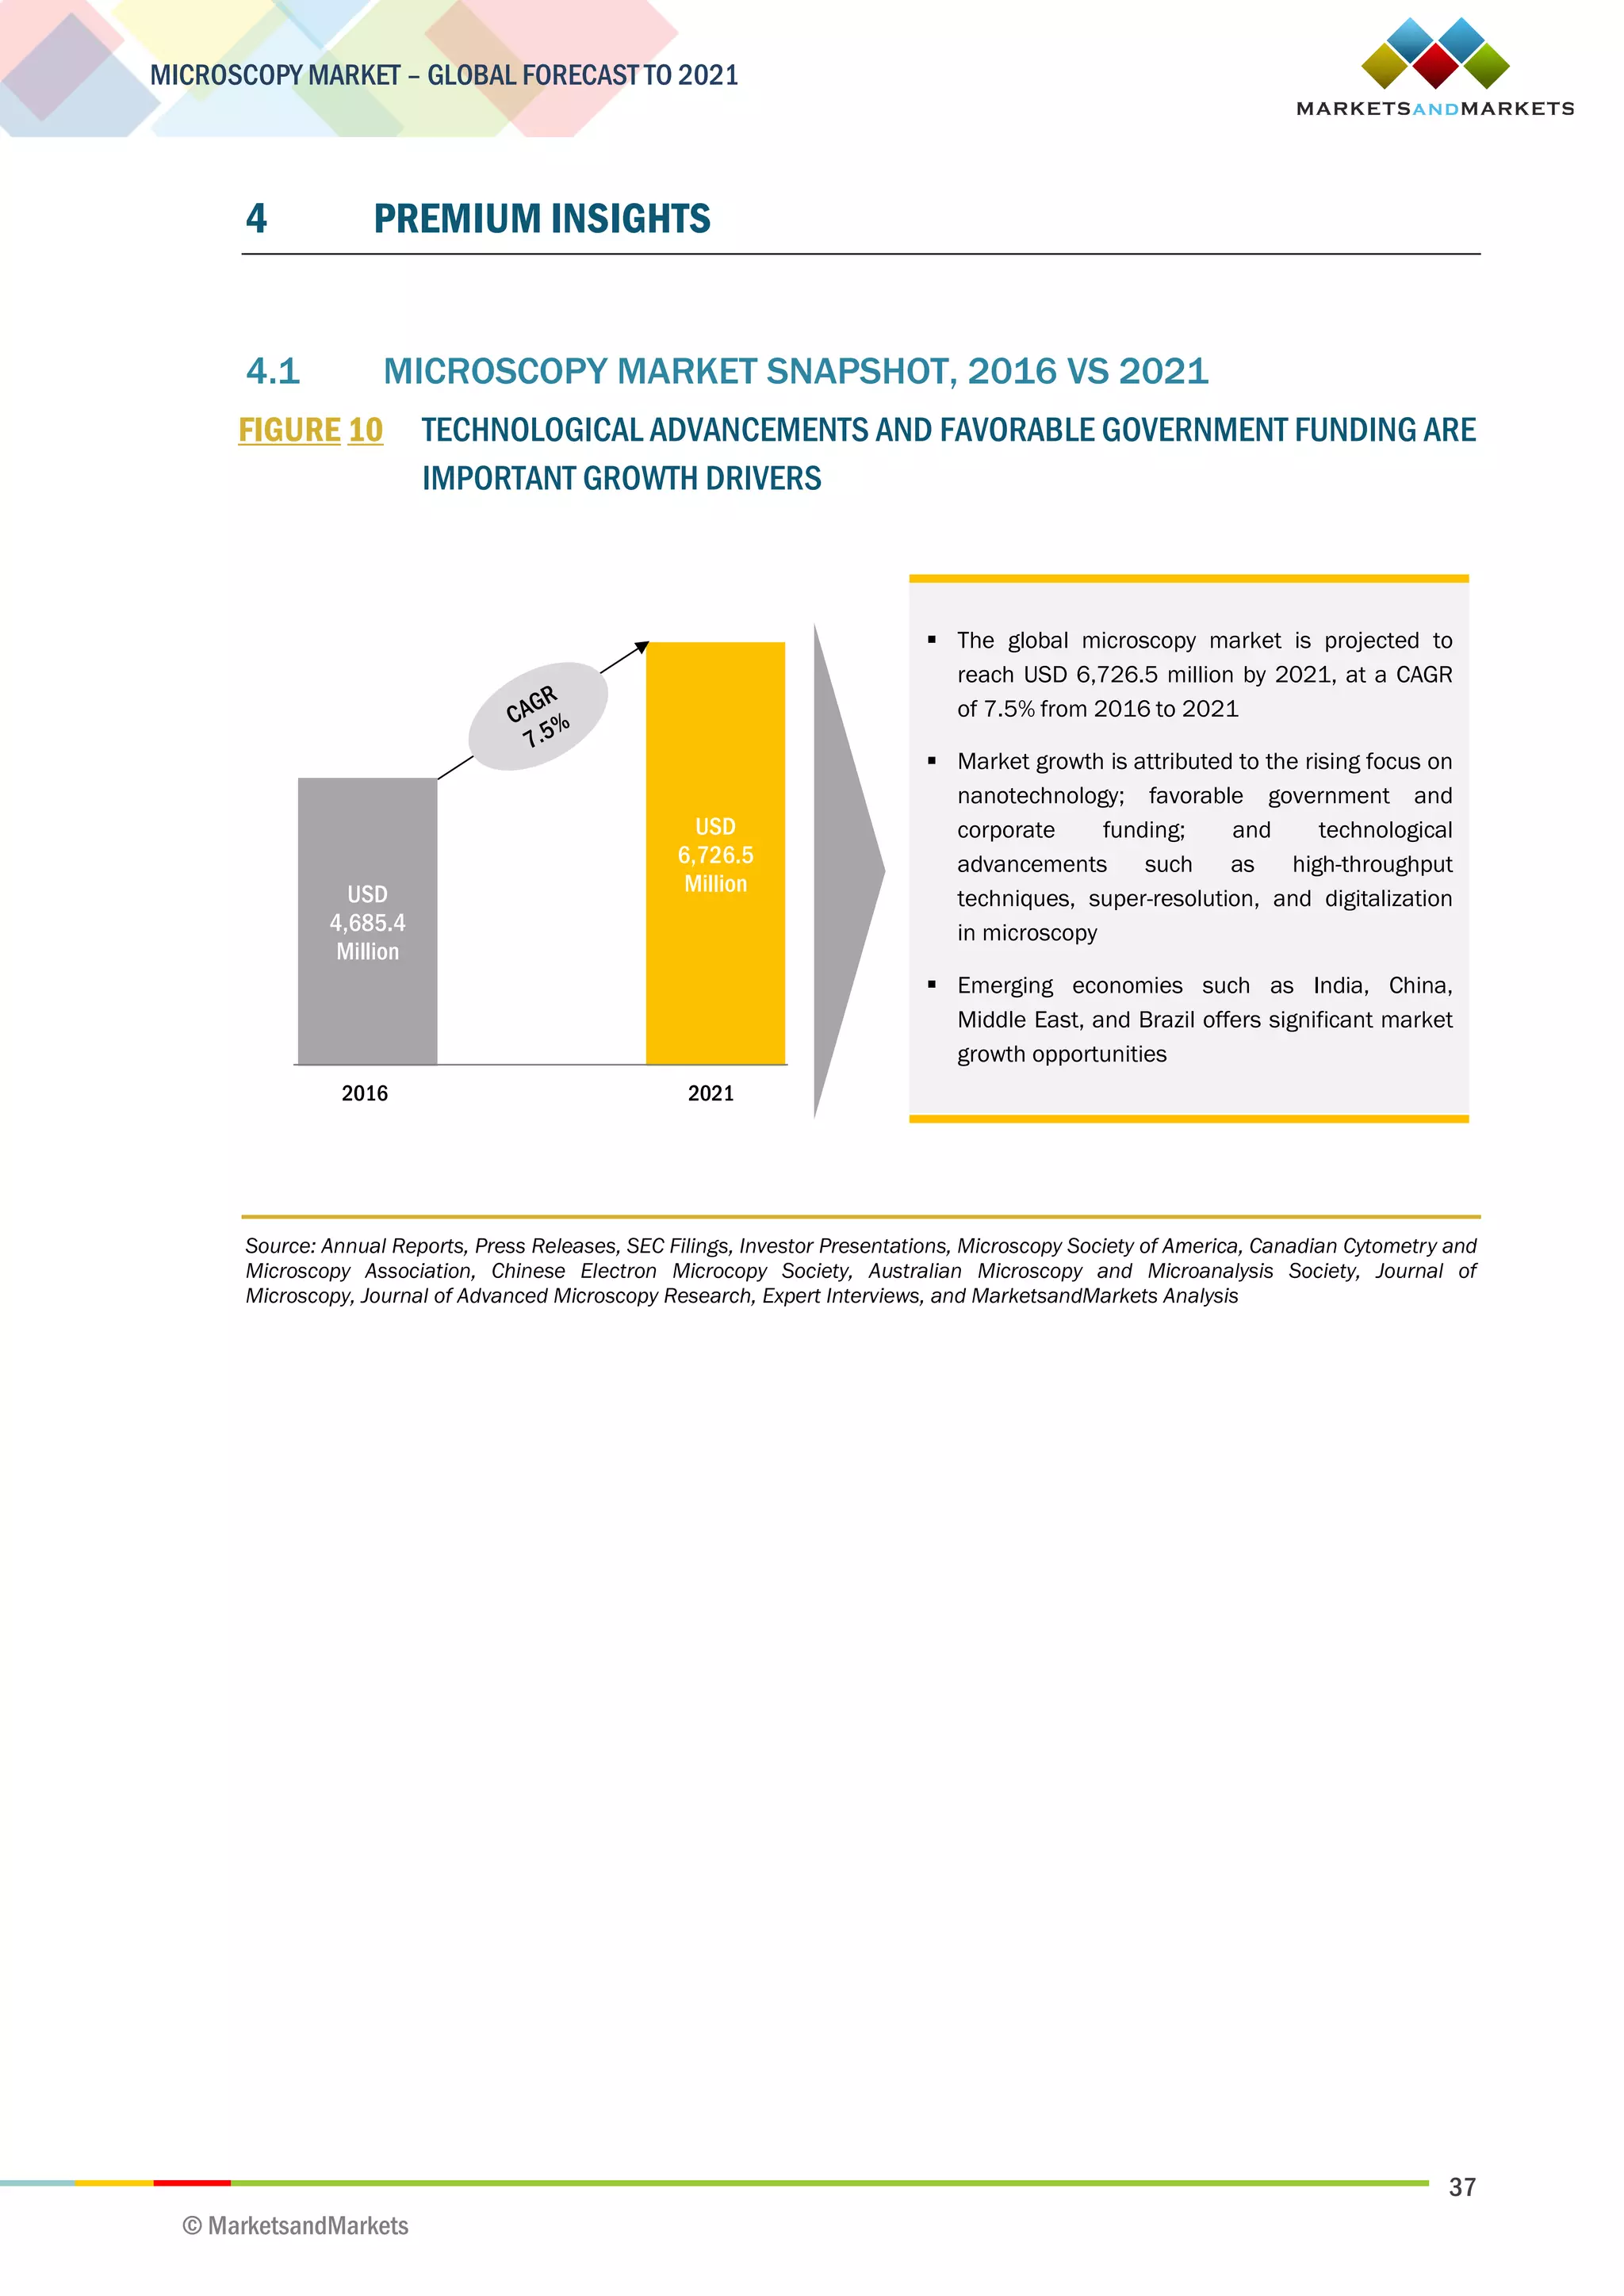
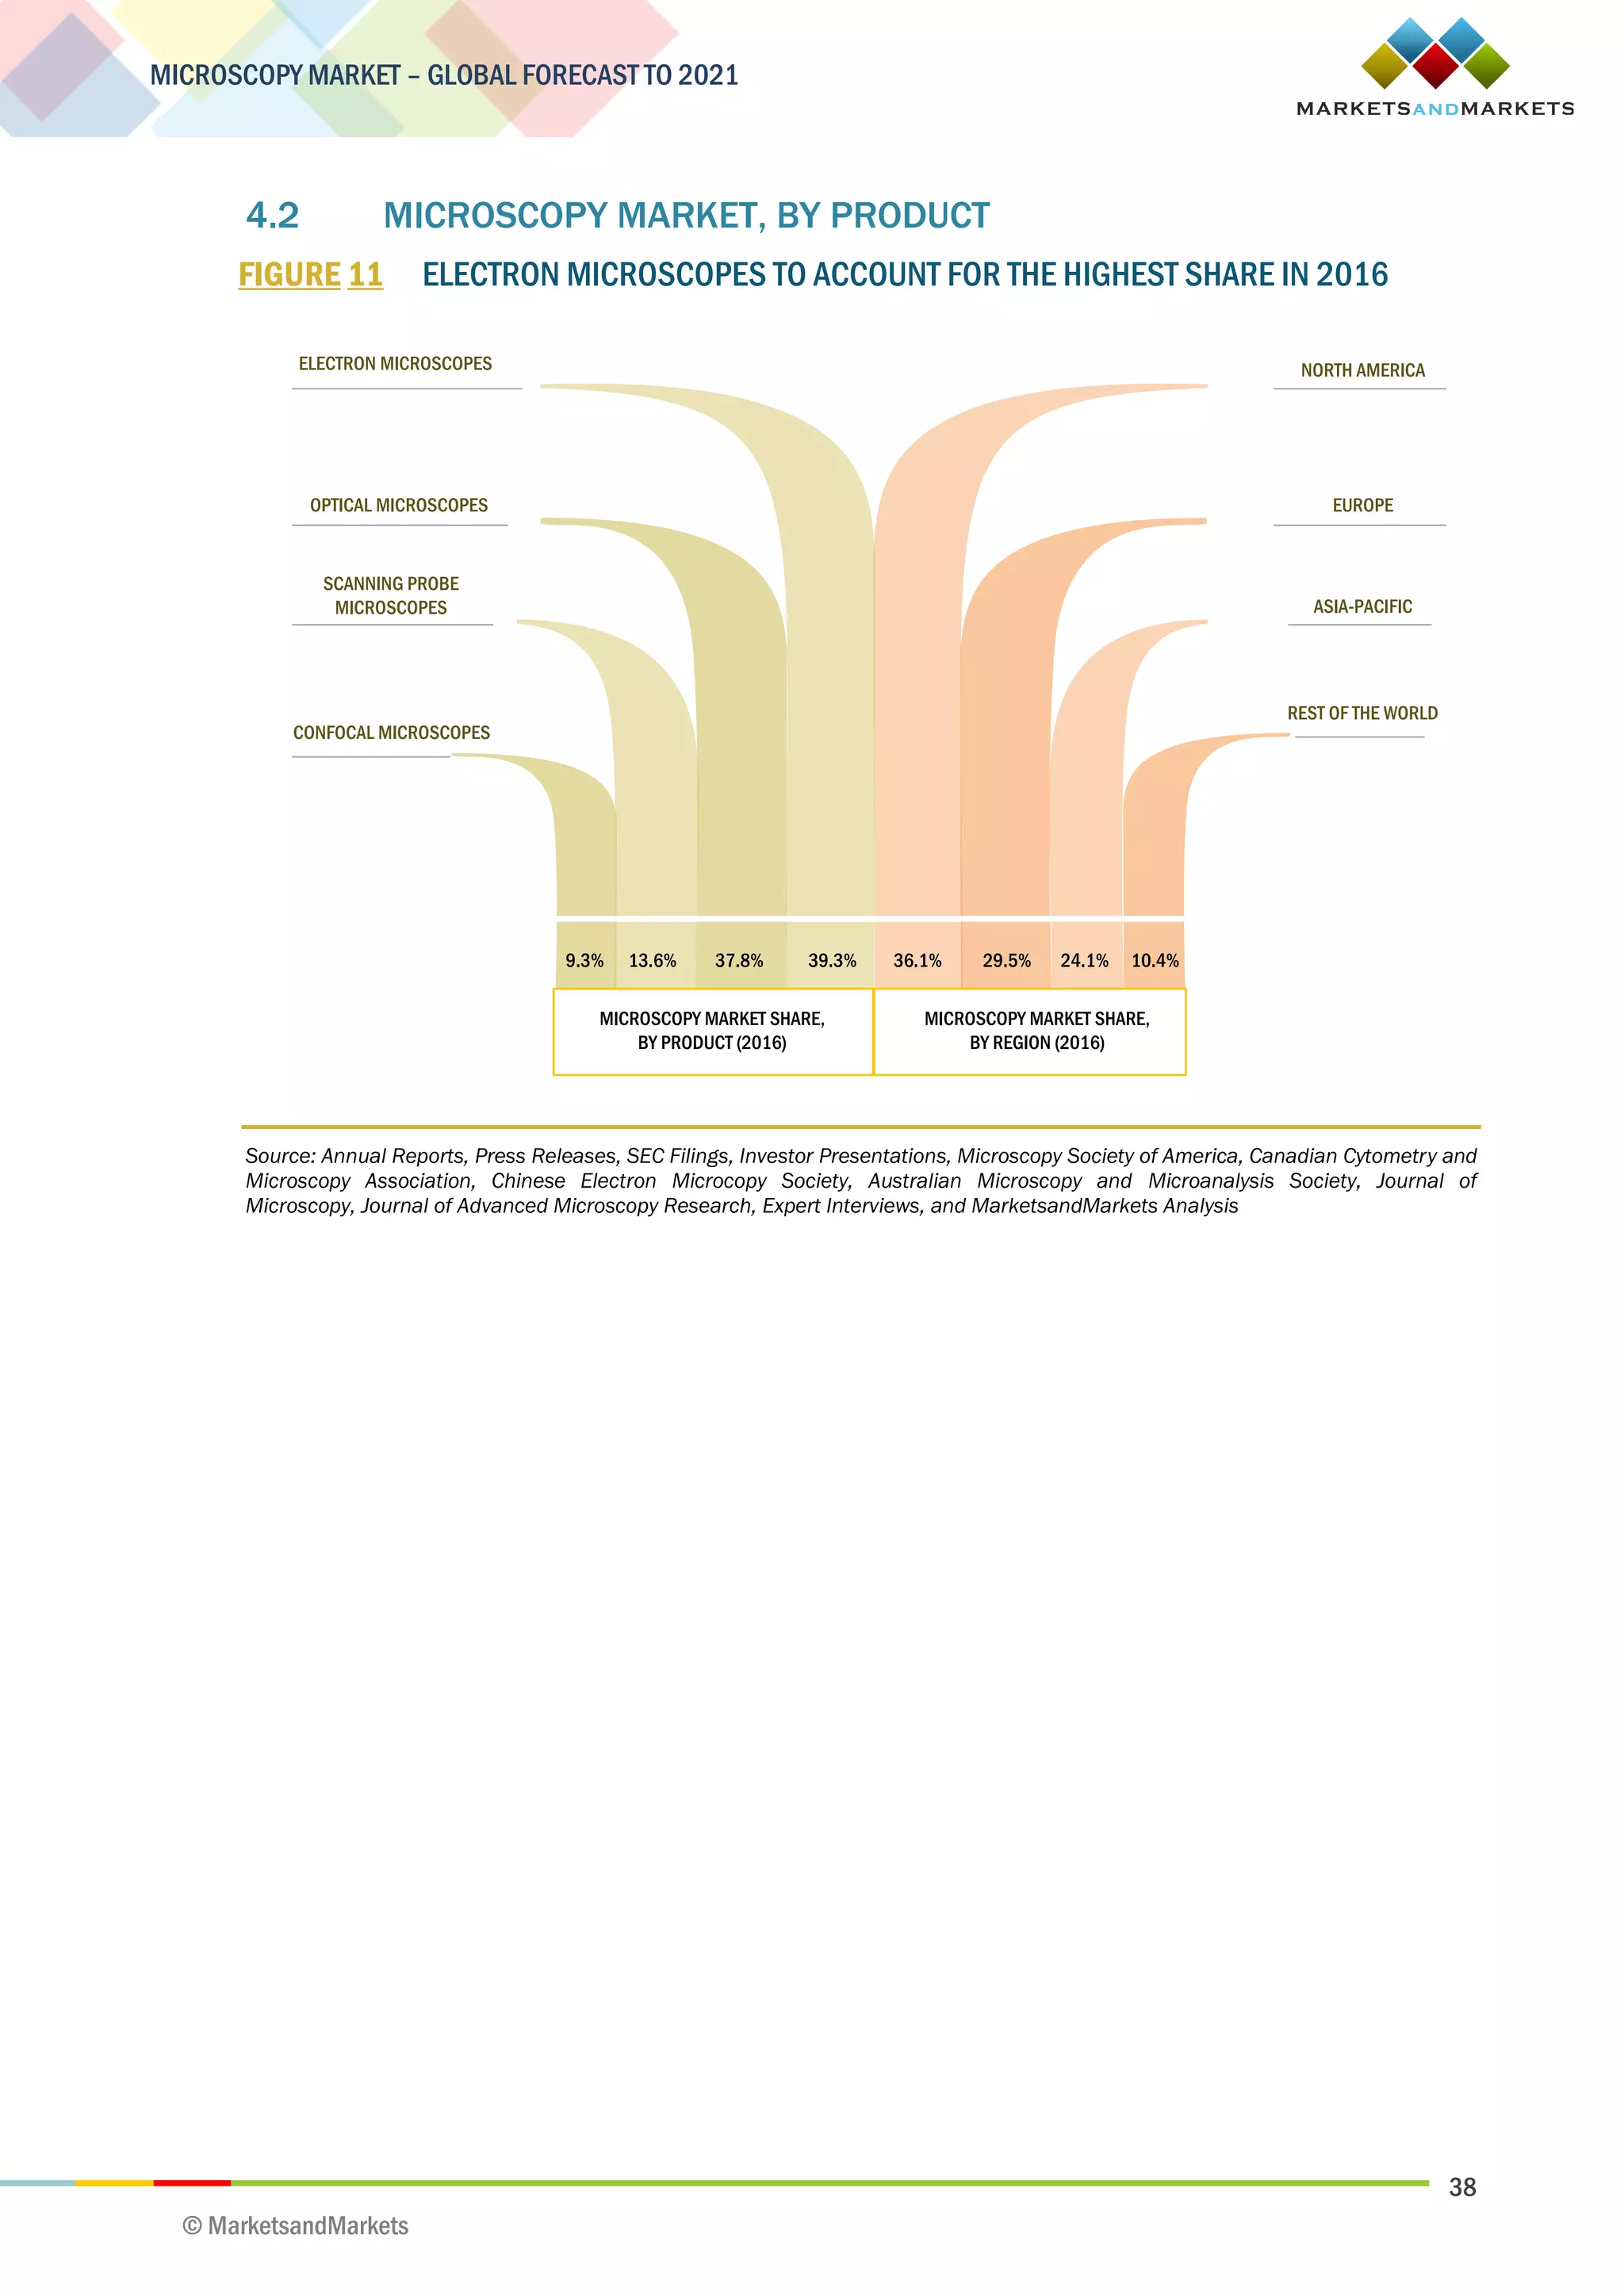
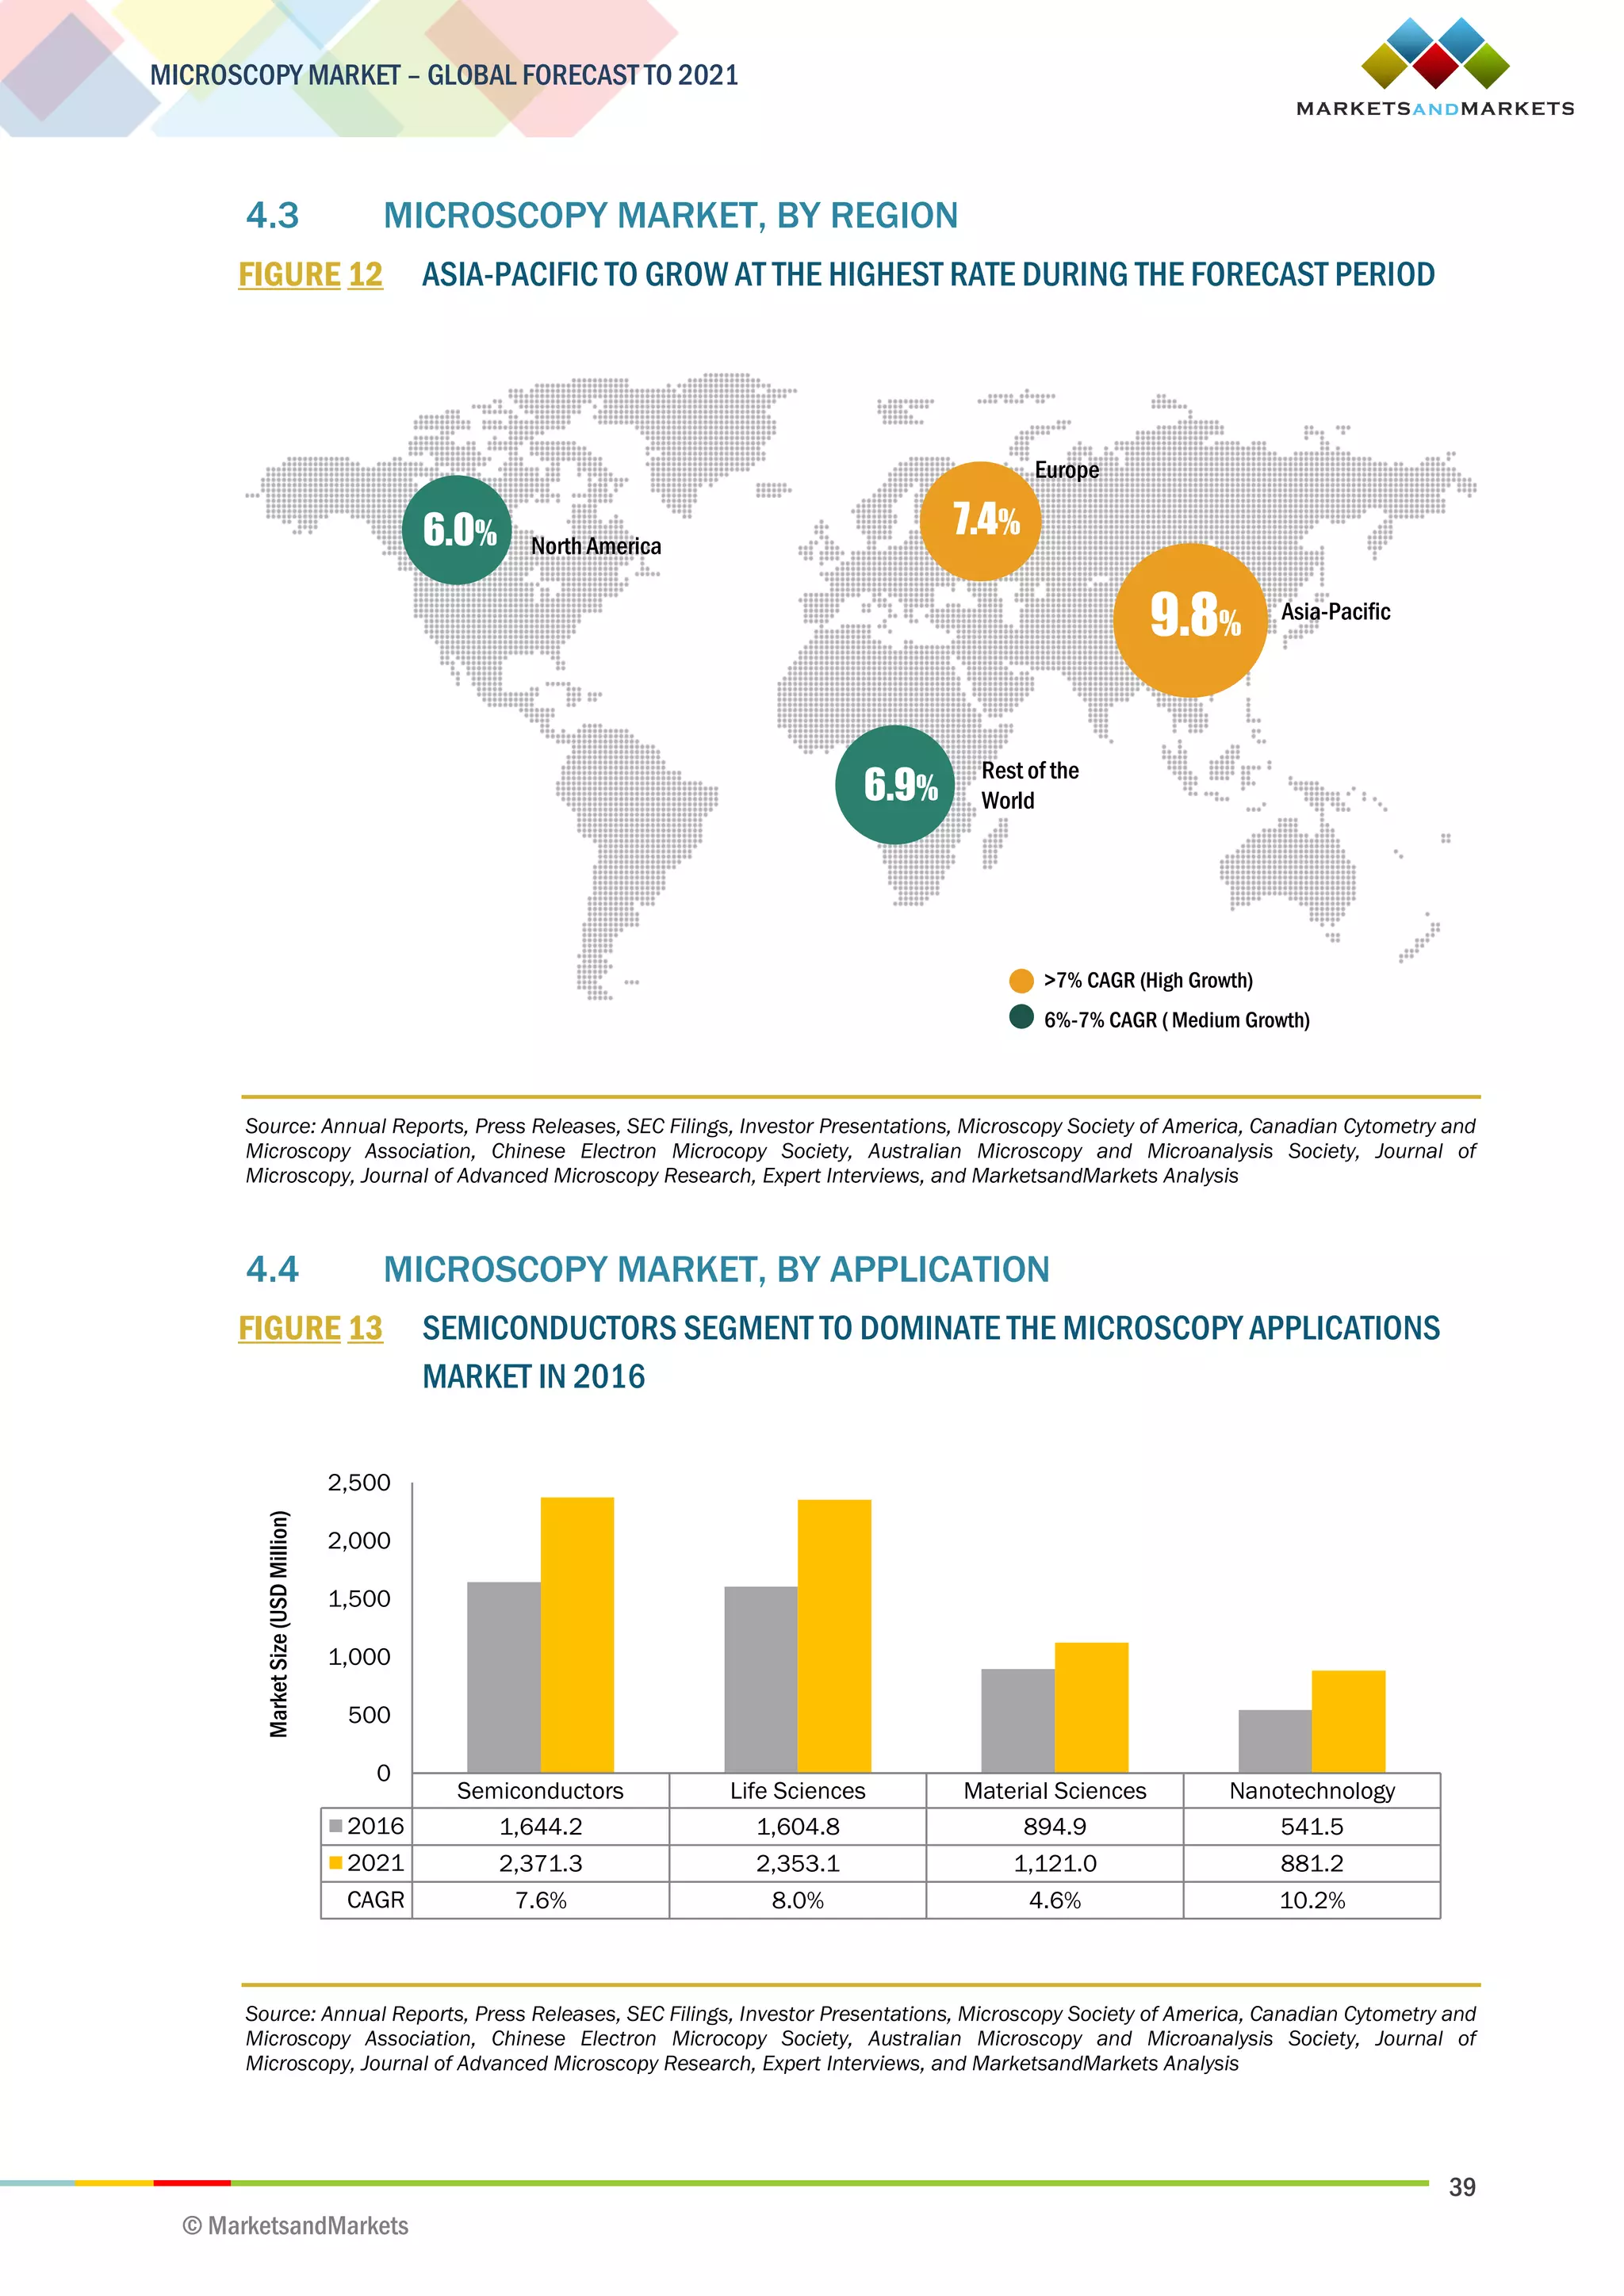
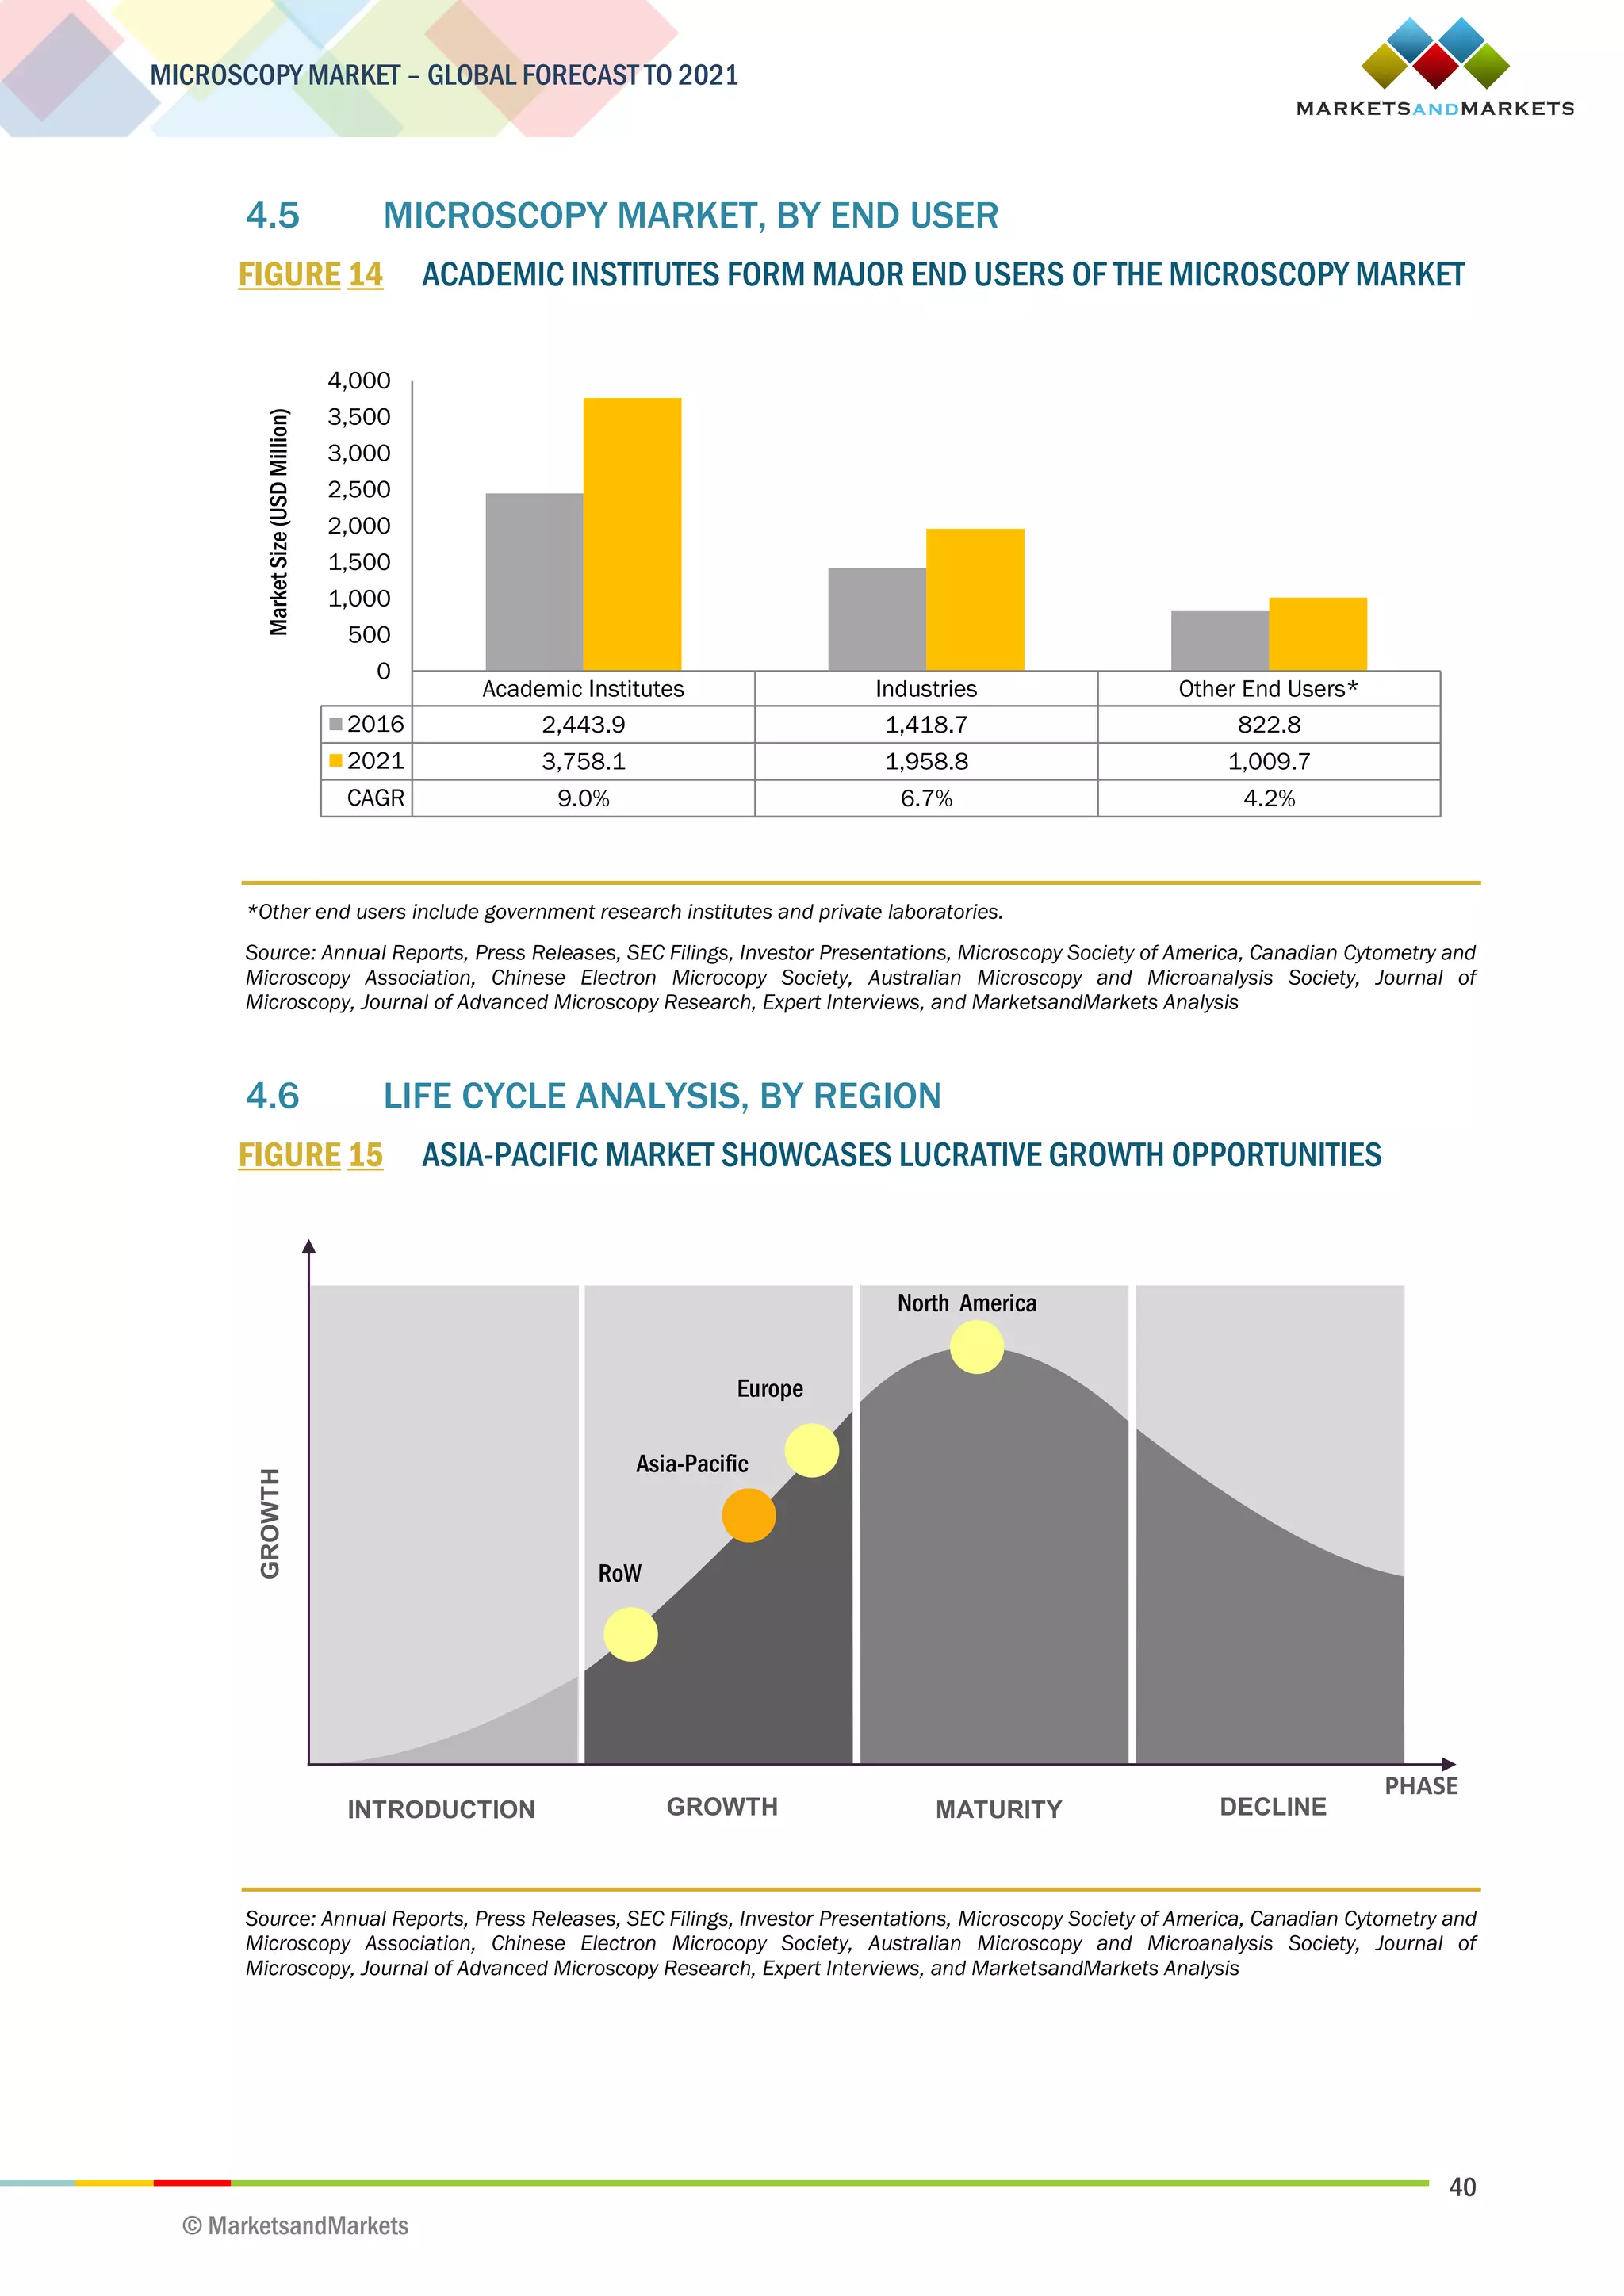
2
MICROSCOPY MARKET – GLOBAL FORECAST TO 2021
© MarketsandMarkets
MarketsandMarkets is a global market research and consulting company. It is World’s No. 2 in terms of
premium market research studies published annually. Serving as a business intelligence partner to Fortune
500 companies across the world, it provides multi-client reports, company profiles, databases, and custom
research services.
MarketsandMarkets covers seventeen industry verticals, including advanced materials, aerospace and
defense, agriculture, automotive and transportation, biotechnology, building and construction, chemicals,
energy and power, food and beverages, industrial automation, medical devices, mining, minerals and metals,
packaging, pharmaceuticals, semiconductor and electronics, and telecommunications and IT.
Copyright © 2016 MarketsandMarkets
All Rights Reserved. This document contains highly confidential information and is the sole property of
MarketsandMarkets. No part of it may be circulated, copied, quoted, or otherwise reproduced without the
written approval of MarketsandMarkets.
3
MICROSCOPY MARKET – GLOBAL FORECAST TO 2021
© MarketsandMarkets
TABLE OF CONTENTS
1 INTRODUCTION........................................................................................................ 20
1.1 OBJECTIVES OF THE STUDY...........................................................................................................20
1.2 MARKET DEFINITION.....................................................................................................................20
1.3 MARKET SCOPE............................................................................................................................21
1.3.1 MARKETS COVERED.......................................................................................................21
1.3.2 YEARS CONSIDERED FOR THE STUDY..............................................................................21
1.4 CURRENCY...................................................................................................................................22
1.5 LIMITATIONS ................................................................................................................................22
1.6 STAKEHOLDERS...........................................................................................................................22
2 RESEARCH METHODOLOGY...................................................................................... 23
2.1 MARKET SIZE ESTIMATION............................................................................................................25
2.2 MARKET BREAKDOWN AND DATA TRIANGULATION........................................................................27
2.2.1 KEY DATA FROM SECONDARY SOURCES.........................................................................28
2.2.2 KEY DATA FROM PRIMARY SOURCES..............................................................................28
2.2.2.1 Key industry insights..........................................................................................29
2.3 ASSUMPTIONS.............................................................................................................................30
3 EXECUTIVE SUMMARY.............................................................................................. 31
3.1 CURRENT SCENARIO ....................................................................................................................32
3.2 FUTURE OUTLOOK ........................................................................................................................32
3.3 CONCLUSION...............................................................................................................................36
4 PREMIUM INSIGHTS ................................................................................................ 37
4.1 MICROSCOPY MARKET SNAPSHOT, 2016 VS 2021.......................................................................37
4.2 MICROSCOPY MARKET, BY PRODUCT............................................................................................38
4.3 MICROSCOPY MARKET, BY REGION ..............................................................................................39
4.4 MICROSCOPY MARKET, BY APPLICATION ......................................................................................39
4.5 MICROSCOPY MARKET, BY END USER...........................................................................................40
4.6 LIFE CYCLE ANALYSIS, BY REGION ................................................................................................40
5 MARKET OVERVIEW.................................................................................................. 41
5.1 INTRODUCTION ............................................................................................................................42
5.2 MARKET DYNAMICS......................................................................................................................42
5.2.1 DRIVERS........................................................................................................................43
5.2.1.1 Rising focus on nanotechnology.........................................................................43
5.2.1.2 Favorable government and corporate funding for research and
development.....................................................................................................43
5.2.1.3 Technological advancements.............................................................................44
4
MICROSCOPY MARKET – GLOBAL FORECAST TO 2021
© MarketsandMarkets
5.2.2 RESTRAINTS...................................................................................................................44
5.2.2.1 High cost of advanced microscopes ...................................................................44
5.2.2.2 Implementation of excise tax by the U.S. government .........................................45
5.2.2.3 Heavy custom duty on medical devices...............................................................45
5.2.3 OPPORTUNITIES.............................................................................................................45
5.2.3.1 Emerging markets .............................................................................................45
5.2.3.2 New application areas such as quantum dots and optogenetics..........................45
5.2.3.3 Integration of microscopy with spectroscopy ......................................................46
5.2.4 CHALLENGES.................................................................................................................46
5.2.4.1 Sample preparation...........................................................................................46
5.2.4.2 Requirement of a high degree of technical expertise...........................................46
6 MICROSCOPY MARKET, BY PRODUCT....................................................................... 47
6.1 INTRODUCTION ............................................................................................................................48
6.2 ELECTRON MICROSCOPES ...........................................................................................................49
6.2.1 TRANSMISSION ELECTRON MICROSCOPES (TEM)...........................................................52
6.2.2 SCANNING ELECTRON MICROSCOPES (SEM)..................................................................53
6.3 OPTICAL MICROSCOPES...............................................................................................................54
6.3.1 FLUORESCENCE MICROSCOPES ....................................................................................58
6.3.1.1 Total Internal Reflection Fluorescence Microscopy (TIRF)....................................59
6.3.1.2 Fluorescence Resonance Energy Transfer (FRET).................................................59
6.3.1.3 Fluorescence Recovery After Photo-Bleaching (FRAP).........................................59
6.3.1.4 Fluorescence Lifetime Imaging Microscopy (FLIM)..............................................59
6.3.2 SUPER-RESOLUTION MICROSCOPES..............................................................................59
6.3.2.1 Stochastic Optical Reconstruction Microscopy (STORM).....................................60
6.3.2.2 Structured Illumination Microscopy (SIM) ..........................................................60
6.3.2.3 Stimulated Emission Depletion Microscopy (STED).............................................60
6.3.2.4 Coherent Anti-Strokes Raman Scattering Microscopy (CARS)..............................60
6.3.2.5 Photo-Activated Localization Microscopy (PALM) ...............................................60
6.3.2.6 Reversible Saturable Optical Fluorescence Transitions (RESOLFT).......................60
6.4 CONFOCAL MICROSCOPES...........................................................................................................62
6.4.1 MULTI-PHOTON CONFOCAL MICROSCOPES....................................................................64
6.4.2 SPINNING DISK CONFOCAL MICROSCOPES....................................................................65
6.5 SCANNING PROBE MICROSCOPES (SPM) .....................................................................................65
6.5.1 SCANNING TUNNELING MICROSCOPES (STM) ................................................................69
6.5.2 ATOMIC FORCE MICROSCOPES (AFM) ............................................................................70
6.5.3 NEAR-FIELD SCANNING OPTICAL MICROSCOPES (NSOM)...............................................71
5
MICROSCOPY MARKET – GLOBAL FORECAST TO 2021
© MarketsandMarkets
7 MICROSCOPY MARKET, BY APPLICATION.................................................................. 72
7.1 INTRODUCTION ............................................................................................................................73
7.2 SEMICONDUCTORS......................................................................................................................74
7.3 LIFE SCIENCES.............................................................................................................................78
7.4 MATERIAL SCIENCES....................................................................................................................82
7.5 NANOTECHNOLOGY......................................................................................................................85
8 MICROSCOPY MARKET, BY END USER...................................................................... 89
8.1 INTRODUCTION ............................................................................................................................90
8.2 ACADEMIC INSTITUTES.................................................................................................................91
8.3 INDUSTRIES.................................................................................................................................95
8.4 OTHER END USERS (GOVERNMENT RESEARCH INSTITUTIONS AND PRIVATE
LABORATORIES)...........................................................................................................................98
9 MICROSCOPY MARKET, BY REGION........................................................................ 101
9.1 INTRODUCTION ..........................................................................................................................102
9.2 NORTH AMERICA........................................................................................................................104
9.2.1 U.S. .............................................................................................................................108
9.2.2 CANADA.......................................................................................................................110
9.3 EUROPE.....................................................................................................................................113
9.3.1 GERMANY....................................................................................................................118
9.3.2 THE U.K........................................................................................................................120
9.3.3 FRANCE .......................................................................................................................122
9.3.4 REST OF EUROPE (ROE)................................................................................................124
9.4 ASIA-PACIFIC.............................................................................................................................126
9.5 REST OF THE WORLD (ROW)........................................................................................................130
9.5.1 BRAZIL.........................................................................................................................133
9.5.2 MEXICO .......................................................................................................................136
9.5.3 ARGENTINA..................................................................................................................139
9.5.4 REST OF LATIN AMERICA (ROLA)...................................................................................142
10 COMPETITIVE LANDSCAPE ..................................................................................... 145
10.1 OVERVIEW..................................................................................................................................146
10.2 MARKET ANALYSIS.....................................................................................................................147
10.3 BATTLE FOR MARKET SHARE: NEW PRODUCT LAUNCHES IS THEKEY GROWTH STRATEGY
ADOPTED BY MARKET COMPANIES.............................................................................................149
10.4 NEW PRODUCT LAUNCHES .........................................................................................................150
10.5 AGREEMENTS, PARTNERSHIPS, AND COLLABORATIONS .............................................................151
10.6 ACQUISITIONS............................................................................................................................152
10.7 EXPANSIONS..............................................................................................................................153
6
MICROSCOPY MARKET – GLOBAL FORECAST TO 2021
© MarketsandMarkets
11 COMPANY PROFILES.............................................................................................. 154
11.1 INTRODUCTION ..........................................................................................................................154
11.2 BRUKER CORPORATION .............................................................................................................155
11.2.1 BUSINESS OVERVIEW...................................................................................................155
11.2.2 PRODUCTS OFFERED....................................................................................................156
11.2.3 RECENT DEVELOPMENTS..............................................................................................157
11.2.4 MNM VIEW...................................................................................................................158
11.3 LEICA MICROSYSTEMS GMBH ....................................................................................................159
11.3.1 BUSINESS OVERVIEW...................................................................................................159
11.3.2 PRODUCTS OFFERED....................................................................................................160
11.3.3 RECENT DEVELOPMENTS..............................................................................................162
11.3.4 MNM VIEW...................................................................................................................163
11.4 CARL ZEISS AG...........................................................................................................................164
11.4.1 BUSINESS OVERVIEW...................................................................................................164
11.4.2 PRODUCTS OFFERED....................................................................................................165
11.4.3 RECENT DEVELOPMENTS..............................................................................................166
11.4.4 MNM VIEW...................................................................................................................168
11.5 NIKON CORPORATION ................................................................................................................169
11.5.1 BUSINESS OVERVIEW...................................................................................................169
11.5.2 PRODUCTS OFFERED....................................................................................................170
11.5.3 RECENT DEVELOPMENTS..............................................................................................171
11.5.4 MNM VIEW...................................................................................................................172
11.6 FEI CO........................................................................................................................................173
11.6.1 BUSINESS OVERVIEW...................................................................................................173
11.6.2 PRODUCTS OFFERED....................................................................................................174
11.6.3 RECENT DEVELOPMENTS..............................................................................................175
11.6.4 MNM VIEW...................................................................................................................176
11.7 OLYMPUS CORPORATION ...........................................................................................................177
11.7.1 BUSINESS OVERVIEW...................................................................................................177
11.7.2 PRODUCTS OFFERED....................................................................................................178
11.7.3 RECENT DEVELOPMENTS..............................................................................................178
11.8 ASYLUM RESEARCH (OXFORD INSTRUMENTS) ............................................................................180
11.8.1 BUSINESS OVERVIEW...................................................................................................180
11.8.2 PRODUCTS OFFERED....................................................................................................181
11.8.3 RECENT DEVELOPMENTS..............................................................................................181
11.9 DANISH MICRO ENGINEERING....................................................................................................183
11.9.1 BUSINESS OVERVIEW...................................................................................................183
11.9.2 PRODUCTS OFFERED....................................................................................................183
11.9.3 RECENT DEVELOPMENTS..............................................................................................183
7
MICROSCOPY MARKET – GLOBAL FORECAST TO 2021
© MarketsandMarkets
11.10 JEOL LTD. ...................................................................................................................................184
11.10.1 BUSINESS OVERVIEW...................................................................................................184
11.10.2 PRODUCTS OFFERED....................................................................................................185
11.10.3 RECENT DEVELOPMENTS..............................................................................................186
11.11 HITACHI HIGH-TECHNOLOGIES CORPORATION ............................................................................187
11.11.1 BUSINESS OVERVIEW...................................................................................................187
11.11.2 PRODUCTS OFFERED....................................................................................................188
11.11.3 RECENT DEVELOPMENTS..............................................................................................189
12 APPENDIX.............................................................................................................. 190
12.1 INSIGHTS OF INDUSTRY EXPERTS ...............................................................................................190
12.2 DISCUSSION GUIDE ...................................................................................................................191
12.3 OTHER DEVELOPMENTS..............................................................................................................195
12.4 KNOWLEDGE STORE: MARKETSANDMARKETS’ SUBSCRIPTION PORTAL.......................................206
12.5 INTRODUCING RT: REAL-TIME MARKET INTELLIGENCE.................................................................208
12.6 AVAILABLE CUSTOMIZATIONS.....................................................................................................209
12.7 RELATED REPORTS.....................................................................................................................210
8
MICROSCOPY MARKET – GLOBAL FORECAST TO 2021
© MarketsandMarkets
LIST OF TABLES
TABLE 1 GLOBAL MICROSCOPY MARKET SIZE, BY PRODUCT, 2014–2021 (USD MILLION) 48
TABLE 2 ELECTRON MICROSCOPES MARKET SIZE, BY TYPE, 2014-2021 (USD MILLION) 49
TABLE 3 ELECTRON MICROSCOPES MARKET SIZE, BY REGION, 2014-2021 (USD MILLION) 50
TABLE 4 NORTH AMERICA: ELECTRON MICROSCOPES MARKET SIZE, BY COUNTRY,
2014–2021 (USD MILLION) 50
TABLE 5 EUROPE: ELECTRON MICROSCOPES MARKET SIZE, BY COUNTRY/REGION,
2014–2021 (USD MILLION) 51
TABLE 6 ROW: ELECTRON MICROSCOPES MARKET SIZE, BY COUNTRY/REGION,
2014–2021 (USD MILLION) 51
TABLE 7 TRANSMISSION ELECTRON MICROSCOPES MARKET SIZE, BY REGION,
2014-2021 (USD MILLION) 52
TABLE 8 ROW: TRANSMISSION ELECTRON MICROSCOPES MARKET SIZE,
BY COUNTRY/REGION, 2014–2021 (USD MILLION) 52
TABLE 9 SEM MARKET SIZE, BY REGION, 2014-2021 (USD MILLION) 53
TABLE 10 ROW: SEM MARKET SIZE, BY COUNTRY/REGION, 2014-2021 (USD MILLION) 53
TABLE 11 OPTICAL MICROSCOPES MARKET SIZE, BY TYPE, 2014-2021 (USD MILLION) 55
TABLE 12 OPTICAL MICROSCOPES MARKET SIZE, BY REGION, 2014-2021 (USD MILLION) 56
TABLE 13 NORTH AMERICA: OPTICAL MICROSCOPES MARKET SIZE, BY COUNTRY,
2014–2021 (USD MILLION) 56
TABLE 14 EUROPE: OPTICAL MICROSCOPES MARKET SIZE, BY COUNTRY/REGION,
2014–2021 (USD MILLION) 57
TABLE 15 ROW: OPTICAL MICROSCOPES MARKET SIZE, BY COUNTRY/REGION,
2014–2021 (USD MILLION) 57
TABLE 16 FLUORESCENCE MICROSCOPES MARKET SIZE, BY REGION,
2014–2021 (USD MILLION) 58
TABLE 17 ROW: FLUORESCENCE MICROSCOPES MARKET SIZE, BY COUNTRY/REGION,
2014–2021 (USD MILLION) 58
TABLE 18 SUPER-RESOLUTION MICROSCOPES MARKET SIZE, BY REGION,
2014–2021 (USD MILLION) 61
TABLE 19 ROW: SUPER-RESOLUTION MICROSCOPES MARKET SIZE, BY COUNTRY/REGION,
2014–2021 (USD MILLION) 61
TABLE 20 CONFOCAL MICROSCOPES MARKET SIZE, BY REGION, 2014-2021 (USD MILLION) 63
TABLE 21 NORTH AMERICA: CONFOCAL MICROSCOPES MARKET SIZE, BY COUNTRY,
2014–2021 (USD MILLION) 63
TABLE 22 EUROPE: CONFOCAL MICROSCOPES MARKET SIZE, BY COUNTRY/REGION,
2014–2021 (USD MILLION) 64
TABLE 23 ROW: CONFOCAL MICROSCOPES MARKET SIZE, BY COUNTRY/REGION,
2014–2021 (USD MILLION) 64
TABLE 24 SPM MARKET SIZE, BY TYPE, 2014-2021 (USD MILLION) 66
TABLE 25 SPM MARKET SIZE, BY REGION, 2014-2021 (USD MILLION) 67
TABLE 26 NORTH AMERICA: SPM MARKET SIZE, BY COUNTRY, 2014–2021 (USD MILLION) 67
TABLE 27 EUROPE: SPM MARKET SIZE, BY COUNTRY/REGION, 2014–2021 (USD MILLION) 67
TABLE 28 ROW: SPM MARKET SIZE, BY COUNTRY/REGION, 2014–2021 (USD MILLION) 68
TABLE 29 STM MARKET SIZE, BY REGION, 2014-2021 (USD MILLION) 69
TABLE 30 ROW: STM MARKET SIZE, BY COUNTRY/REGION, 2014–2021 (USD MILLION) 69
9
MICROSCOPY MARKET – GLOBAL FORECAST TO 2021
© MarketsandMarkets
TABLE 31 AFM MARKET SIZE, BY REGION, 2014-2021 (USD MILLION) 70
TABLE 32 ROW: AFM MARKET SIZE, BY COUNTRY/REGION, 2014–2021 (USD MILLION) 70
TABLE 33 NSOM MARKET SIZE, BY REGION, 2014-2021 (USD MILLION) 71
TABLE 34 ROW: NSOM MARKET SIZE, BY COUNTRY/REGION, 2014–2021 (USD MILLION) 71
TABLE 35 GLOBAL MICROSCOPY MARKET SIZE, BY APPLICATION, 2014–2021 (USD MILLION) 73
TABLE 36 MICROSCOPY MARKET SIZE FOR SEMICONDUCTORS, BY REGION,
2014–2021 (USD MILLION) 75
TABLE 37 NORTH AMERICA: MICROSCOPY MARKET SIZE FOR SEMICONDUCTORS,
BY COUNTRY, 2014–2021 (USD MILLION) 75
TABLE 38 EUROPE: MICROSCOPY MARKET SIZE FOR SEMICONDUCTORS,
BY COUNTRY/REGION, 2014–2021 (USD MILLION) 76
TABLE 39 ROW: MICROSCOPY MARKET SIZE FOR SEMICONDUCTORS, BY COUNTRY/REGION,
2014–2021 (USD MILLION) 76
TABLE 40 MICROSCOPY MARKET SIZE FOR SEMICONDUCTORS, BY PRODUCT,
2014–2021 (USD MILLION) 77
TABLE 41 MICROSCOPY MARKET SIZE FOR LIFE SCIENCES, BY REGION,
2014–2021 (USD MILLION) 79
TABLE 42 NORTH AMERICA: MICROSCOPY MARKET SIZE FOR LIFE SCIENCES, BY COUNTRY,
2014–2021 (USD MILLION) 80
TABLE 43 EUROPE: MICROSCOPY MARKET SIZE FOR LIFE SCIENCES, BY COUNTRY/REGION,
2014–2021 (USD MILLION) 80
TABLE 44 ROW: MICROSCOPY MARKET SIZE FOR LIFE SCIENCES, BY COUNTRY,
2014–2021 (USD MILLION) 81
TABLE 45 MICROSCOPY MARKET SIZE FOR LIFE SCIENCES, BY PRODUCT,
2014–2021 (USD MILLION) 81
TABLE 46 MICROSCOPY MARKET SIZE FOR MATERIAL SCIENCES, BY REGION,
2014–2021 (USD MILLION) 82
TABLE 47 NORTH AMERICA: MICROSCOPY MARKET SIZE FOR MATERIAL SCIENCES,
BY COUNTRY, 2014–2021 (USD MILLION) 82
TABLE 48 EUROPE: MICROSCOPY MARKET SIZE FOR MATERIAL SCIENCES,
BY COUNTRY/REGION, 2014–2021 (USD MILLION) 83
TABLE 49 ROW: MICROSCOPY MARKET SIZE FOR MATERIAL SCIENCES,
BY COUNTRY/REGION, 2014–2021 (USD MILLION) 84
TABLE 50 MICROSCOPY MARKET SIZE FOR MATERIAL SCIENCES, BY PRODUCT,
2014–2021 (USD MILLION) 84
TABLE 51 MICROSCOPY MARKET SIZE FOR NANOTECHNOLOGY, BY REGION,
2014–2021 (USD MILLION) 85
TABLE 52 NORTH AMERICA: MICROSCOPY MARKET SIZE FOR NANOTECHNOLOGY,
BY COUNTRY, 2014–2021 (USD MILLION) 86
TABLE 53 EUROPE: MICROSCOPY MARKET SIZE FOR NANOTECHNOLOGY,
BY COUNTRY/REGION, 2014–2021 (USD MILLION) 86
TABLE 54 ROW: MICROSCOPY MARKET SIZE FOR NANOTECHNOLOGY, BY COUNTRY/REGION,
2014–2021 (USD MILLION) 87
TABLE 55 MICROSCOPY MARKET SIZE FOR NANOTECHNOLOGY, BY PRODUCT,
2014–2021 (USD MILLION) 88
TABLE 56 MICROSCOPY MARKET SIZE, BY END USER, 2014–2021 (USD MILLION) 90
TABLE 57 MICROSCOPY MARKET SIZE FOR ACADEMIC INSTITUTES, BY REGION,
2014–2021 (USD MILLION) 93
TABLE 58 NORTH AMERICA: MICROSCOPY MARKET SIZE FOR ACADEMIC INSTITUTES,
BY COUNTRY, 2014–2021 (USD MILLION) 93
10
MICROSCOPY MARKET – GLOBAL FORECAST TO 2021
© MarketsandMarkets
TABLE 59 EUROPE: MICROSCOPY MARKET SIZE FOR ACADEMIC INSTITUTES,
BY COUNTRY/REGION, 2014–2021 (USD MILLION) 94
TABLE 60 ROW: MICROSCOPY MARKET SIZE FOR ACADEMIC INSTITUTES,
BY COUNTRY/REGION, 2014 –2021 (USD MILLION) 94
TABLE 61 MICROSCOPY MARKET SIZE FOR INDUSTRIES, BY REGION,
2014–2021 (USD MILLION) 96
TABLE 62 NORTH AMERICA: MICROSCOPY MARKET SIZE FOR INDUSTRIES, BY COUNTRY,
2014–2021 (USD MILLION) 96
TABLE 63 EUROPE: MICROSCOPY MARKET SIZE FOR INDUSTRIES, BY COUNTRY/REGION,
2014–2021 (USD MILLION) 97
TABLE 64 ROW: MICROSCOPY MARKET SIZE FOR INDUSTRIES, BY COUNTRY/REGION,
2014–2021 (USD MILLION) 97
TABLE 65 MICROSCOPY MARKET SIZE FOR OTHER END USERS, BY REGION,
2014–2021 (USD MILLION) 99
TABLE 66 NORTH AMERICA: MICROSCOPY MARKET SIZE FOR OTHER END USERS,
BY COUNTRY, 2014 –2021 (USD MILLION) 99
TABLE 67 EUROPE: MICROSCOPY MARKET SIZE FOR OTHER END USERS,
BY COUNTRY/REGION, 2014 –2021 (USD MILLION) 100
TABLE 68 ROW: MICROSCOPY MARKET SIZE FOR OTHER END USERS, BY COUNTRY/REGION,
2014–2021 (USD MILLION) 100
TABLE 69 MICROSCOPY MARKET SIZE, BY REGION, 2014–2021 (USD MILLION) 103
TABLE 70 NORTH AMERICA: MICROSCOPY MARKET SIZE, BY PRODUCT,
2014-2021 (USD MILLION) 106
TABLE 71 NORTH AMERICA: OPTICAL MICROSCOPES MARKET SIZE, BY TYPE,
2014-2021 (USD MILLION) 106
TABLE 72 NORTH AMERICA: ELECTRON MICROSCOPES MARKET SIZE, BY TYPE,
2014-2021 (USD MILLION) 106
TABLE 73 NORTH AMERICA: SPM MARKET SIZE, BY TYPE, 2014-2021 (USD MILLION) 107
TABLE 74 NORTH AMERICA: MICROSCOPY MARKET SIZE, BY APPLICATION,
2014-2021 (USD MILLION) 107
TABLE 75 NORTH AMERICA: MICROSCOPY MARKET SIZE, BY END USER,
2014-2021 (USD MILLION) 108
TABLE 76 NORTH AMERICA: MICROSCOPY MARKET SIZE, BY COUNTRY,
2014-2021 (USD MILLION) 108
TABLE 77 U.S.: MICROSCOPY MARKET SIZE, BY PRODUCT, 2014-2021 (USD MILLION) 109
TABLE 78 U.S.: MICROSCOPY MARKET SIZE, BY APPLICATION, 2014-2021 (USD MILLION) 110
TABLE 79 U.S.: MICROSCOPY MARKET SIZE, BY END USER, 2014-2021 (USD MILLION) 110
TABLE 80 CANADA: MICROSCOPY MARKET SIZE, BY PRODUCT, 2014-2021 (USD MILLION) 111
TABLE 81 CANADA: MICROSCOPY MARKET SIZE, BY APPLICATION, 2014-2021 (USD MILLION) 111
TABLE 82 CANADA: MICROSCOPY MARKET SIZE, BY END USER, 2014-2021 (USD MILLION) 112
TABLE 83 EUROPE: MICROSCOPY MARKET SIZE, BY PRODUCT, 2014-2021 (USD MILLION) 115
TABLE 84 EUROPE: OPTICAL MICROSCOPES MARKET SIZE, BY TYPE,
2014-2021 (USD MILLION) 116
TABLE 85 EUROPE: ELECTRON MICROSCOPES MARKET SIZE, BY TYPE,
2014-2021 (USD MILLION) 116
TABLE 86 EUROPE: SPM MARKET SIZE, BY TYPE, 2014-2021 (USD MILLION) 116
TABLE 87 EUROPE: MICROSCOPY MARKET SIZE, BY APPLICATION,
2014-2021 (USD MILLION) 117
TABLE 88 EUROPE: MICROSCOPY MARKET SIZE, BY END USER, 2014-2021 (USD MILLION) 117
11
MICROSCOPY MARKET – GLOBAL FORECAST TO 2021
© MarketsandMarkets
TABLE 89 EUROPE: MICROSCOPY MARKET SIZE, BY COUNTRY/REGION,
2014-2021 (USD MILLION) 117
TABLE 90 GERMANY: MICROSCOPY MARKET SIZE, BY PRODUCT, 2014-2021 (USD MILLION) 118
TABLE 91 GERMANY: MICROSCOPY MARKET SIZE, BY APPLICATION,
2014-2021 (USD MILLION) 119
TABLE 92 GERMANY: MICROSCOPY MARKET SIZE, BY END USER, 2014-2021 (USD MILLION) 120
TABLE 93 U.K.: MICROSCOPY MARKET SIZE, BY PRODUCT, 2014-2021 (USD MILLION) 121
TABLE 94 U.K.: MICROSCOPY MARKET SIZE, BY APPLICATION, 2014-2021 (USD MILLION) 121
TABLE 95 U.K.: MICROSCOPY MARKET SIZE, BY END USER, 2014-2021 (USD MILLION) 121
TABLE 96 FRANCE: MICROSCOPY MARKET SIZE, BY PRODUCT, 2014-2021 (USD MILLION) 122
TABLE 97 FRANCE: MICROSCOPY MARKET SIZE, BY APPLICATION, 2014-2021 (USD MILLION) 122
TABLE 98 FRANCE: MICROSCOPY MARKET SIZE, BY END USER, 2014-2021 (USD MILLION) 123
TABLE 99 ROE: MICROSCOPY MARKET SIZE, BY PRODUCT, 2014-2021 (USD MILLION) 124
TABLE 100 ROE: MICROSCOPY MARKET SIZE, BY APPLICATION, 2014-2021 (USD MILLION) 125
TABLE 101 ROE: MICROSCOPY MARKET SIZE, BY END USER, 2014-2021 (USD MILLION) 125
TABLE 102 ASIA-PACIFIC: MICROSCOPY MARKET SIZE, BY PRODUCT,
2014-2021 (USD MILLION) 128
TABLE 103 ASIA-PACIFIC: OPTICAL MICROSCOPES MARKET SIZE, BY TYPE,
2014-2021 (USD MILLION) 128
TABLE 104 ASIA-PACIFIC: ELECTRON MICROSCOPES MARKET SIZE, BY TYPE,
2014-2021 (USD MILLION) 128
TABLE 105 ASIA-PACIFIC: SPM MARKET SIZE, BY TYPE, 2014-2021 (USD MILLION) 129
TABLE 106 ASIA-PACIFIC: MICROSCOPY MARKET SIZE, BY APPLICATION,
2014-2021 (USD MILLION) 129
TABLE 107 ASIA-PACIFIC: MICROSCOPY MARKET SIZE, BY END USER,
2014-2021 (USD MILLION) 129
TABLE 108 ROW: MICROSCOPY MARKET SIZE, BY PRODUCT, 2014-2021 (USD MILLION) 130
TABLE 109 ROW: OPTICAL MICROSCOPES MARKET SIZE, BY TYPE, 2014-2021 (USD MILLION) 130
TABLE 110 ROW: ELECTRON MICROSCOPES MARKET SIZE, BY TYPE,
2014-2021 (USD MILLION) 131
TABLE 111 ROW: SPM MARKET SIZE, BY TYPE, 2014-2021 (USD MILLION) 131
TABLE 112 ROW: MICROSCOPY MARKET SIZE, BY APPLICATION, 2014-2021 (USD MILLION) 131
TABLE 113 ROW: MICROSCOPY MARKET SIZE, BY END USER, 2014-2021 (USD MILLION) 132
TABLE 114 ROW: MICROSCOPY MARKET SIZE, BY COUNTRY/REGION,
2014-2021 (USD MILLION) 133
TABLE 115 BRAZIL: MICROSCOPY MARKET SIZE, BY PRODUCT, 2014-2021 (USD MILLION) 133
TABLE 116 BRAZIL: OPTICAL MICROSCOPES MARKET SIZE, BY TYPE,
2014-2021 (USD MILLION) 134
TABLE 117 BRAZIL: ELECTRON MICROSCOPES MARKET SIZE, BY TYPE,
2014-2021 (USD MILLION) 134
TABLE 118 BRAZIL: SPM MARKET SIZE, BY TYPE, 2014-2021 (USD MILLION) 135
TABLE 119 BRAZIL: MICROSCOPY MARKET SIZE, BY APPLICATION, 2014-2021 (USD MILLION) 135
TABLE 120 BRAZIL: MICROSCOPY MARKET SIZE, BY END USER, 2014-2021 (USD MILLION) 135
TABLE 121 MEXICO: MICROSCOPY MARKET SIZE, BY PRODUCT, 2014-2021 (USD MILLION) 136
TABLE 122 MEXICO: OPTICAL MICROSCOPES MARKET SIZE, BY TYPE,
2014-2021 (USD MILLION) 137
TABLE 123 MEXICO: ELECTRON MICROSCOPES MARKET SIZE, BY TYPE,
2014-2021 (USD MILLION) 137
12
MICROSCOPY MARKET – GLOBAL FORECAST TO 2021
© MarketsandMarkets
TABLE 124 MEXICO: SPM MARKET SIZE, BY TYPE, 2014-2021 (USD MILLION) 137
TABLE 125 MEXICO: MICROSCOPY MARKET SIZE, BY APPLICATION, 2014-2021 (USD MILLION) 138
TABLE 126 MEXICO: MICROSCOPY MARKET SIZE, BY END USER, 2014-2021 (USD MILLION) 138
TABLE 127 ARGENTINA: MICROSCOPY MARKET SIZE, BY PRODUCT,
2014-2021 (USD MILLION) 139
TABLE 128 ARGENTINA: OPTICAL MICROSCOPES MARKET SIZE, BY TYPE,
2014-2021 (USD MILLION) 139
TABLE 129 ARGENTINA: ELECTRON MICROSCOPES MARKET SIZE, BY TYPE,
2014-2021 (USD MILLION) 140
TABLE 130 ARGENTINA: SPM MARKET SIZE, BY TYPE, 2014-2021 (USD MILLION) 140
TABLE 131 ARGENTINA: MICROSCOPY MARKET SIZE, BY APPLICATION,
2014-2021 (USD MILLION) 141
TABLE 132 ARGENTINA: MICROSCOPY MARKET SIZE, BY END USER,
2014-2021 (USD MILLION) 142
TABLE 133 ROLA: MICROSCOPY MARKET SIZE, BY PRODUCT, 2014-2021 (USD MILLION) 142
TABLE 134 ROLA: OPTICAL MICROSCOPES MARKET SIZE, BY TYPE, 2014-2021 (USD MILLION) 143
TABLE 135 ROLA: ELECTRON MICROSCOPES MARKET SIZE, BY TYPE,
2014-2021 (USD MILLION) 143
TABLE 136 ROLA: SPM MARKET SIZE, BY TYPE, 2014-2021 (USD MILLION) 144
TABLE 137 ROLA: MICROSCOPY MARKET SIZE, BY APPLICATION, 2014-2021 (USD MILLION) 144
TABLE 138 ROLA: MICROSCOPY MARKET SIZE, BY END USER, 2014-2021 (USD MILLION) 144
TABLE 139 OPTICAL MICROSCOPES MARKET RANKING, BY KEY COMPANY, 2015 147
TABLE 140 ELECTRON MICROSCOPES MARKET RANKING, BY KEY COMPANY, 2015 148
TABLE 141 CONFOCAL MICROSCOPES MARKET RANKING, BY KEY COMPANY, 2015 148
TABLE 142 SPM MARKET SHARE, BY KEY COMPANY, 2015 149
TABLE 143 NEW PRODUCT LAUNCHES, 2013–2016 150
TABLE 144 AGREEMENTS, PARTNERSHIPS, AND COLLABORATIONS, 2013–2016 151
TABLE 145 ACQUISITIONS, 2013–2016 152
TABLE 146 EXPANSIONS, 2013-2016 153
13
MICROSCOPY MARKET – GLOBAL FORECAST TO 2021
© MarketsandMarkets
LIST OF FIGURES
FIGURE 1 RESEARCH DESIGN 23
FIGURE 2 MARKET SIZE ESTIMATION AND DATA TRIANGULATION 25
FIGURE 3 BREAKDOWN OF PRIMARY INTERVIEWS: BY COMPANY TYPE, DESIGNATION,
AND REGION 26
FIGURE 4 MARKET DATA TRIANGULATION METHODOLOGY 27
FIGURE 5 MICROSCOPY MARKET SNAPSHOT, 2016 VS. 2021 31
FIGURE 6 ELECTRON MICROSCOPES PRODUCT SEGMENT TO WITNESS THE FASTEST
GROWTH DURING THE FORECAST PERIOD 32
FIGURE 7 SEMICONDUCTORS TO ACCOUNT FOR THE LARGEST SHARE OF THE MICROSCOPY
APPLICATIONS MARKET IN 2016 33
FIGURE 8 ACADEMIC INSTITUTES WILL BEMAJOR END USERS OF THE MICROSCOPY MARKET 34
FIGURE 9 GEOGRAPHICAL SNAPSHOT: NORTH AMERICA DOMINATED THE MICROSCOPY
MARKET IN 2015 35
FIGURE 10 TECHNOLOGICAL ADVANCEMENTS AND FAVORABLE GOVERNMENT FUNDING ARE
IMPORTANT GROWTH DRIVERS 37
FIGURE 11 ELECTRON MICROSCOPES TO ACCOUNT FOR THE HIGHEST SHARE IN 2016 38
FIGURE 12 ASIA-PACIFIC TO GROW AT THE HIGHEST RATE DURING THE FORECAST PERIOD 39
FIGURE 13 SEMICONDUCTORS SEGMENT TO DOMINATE THE MICROSCOPY APPLICATIONS
MARKET IN 2016 39
FIGURE 14 ACADEMIC INSTITUTES FORM MAJOR END USERS OF THE MICROSCOPY MARKET 40
FIGURE 15 ASIA-PACIFIC MARKET SHOWCASES LUCRATIVE GROWTH OPPORTUNITIES 40
FIGURE 16 FAVORABLE GOVERNMENT AND CORPORATE FUNDING TO BOOST MARKET
GROWTH 42
FIGURE 17 ELECTRON MICROSCOPES SEGMENT TO ACCOUNT FOR THE LARGEST SHARE OF
THE MICROSCOPY MARKET, BY PRODUCT, IN 2016 48
FIGURE 18 SEM TO ACCOUNT FOR THE LARGEST SHARE OF THE ELECTRON MICROSCOPES
MARKET IN 2016 49
FIGURE 19 FLUORESCENCE MICROSCOPES TO DOMINATE THE OPTICAL MICROSCOPES
MARKET DURING THE FORECAST PERIOD 54
FIGURE 20 ASIA-PACIFIC TO WITNESS HIGHEST GROWTH IN THE OPTICAL MICROSCOPES
MARKET DURING THE FORECAST PERIOD 55
FIGURE 21 APAC TO WITNESS HIGHEST GROWTH IN THE CONFOCAL MICROSCOPES MARKET
DURING THE FORECAST PERIOD 62
FIGURE 22 STM SEGMENT TO DOMINATE THE SPM MARKET 66
FIGURE 23 BRAZIL TO ACCOUNT FOR THE LARGEST SHARE OF THE SPM MARKET IN THE ROW 68
FIGURE 24 SEMICONDUCTORS SEGMENT TO DOMINATE THE MICROSCOPY APPLICATION
MARKET DURING THE FORECAST PERIOD 73
FIGURE 25 ASIA-PACIFIC TO WITNESS THE HIGHEST GROWTH RATE DURING THE FORECAST
PERIOD 74
FIGURE 26 MICROSCOPY INSTRUMENTS IN LIFE SCIENCES 78
FIGURE 27 U.S. TO DOMINATE THE MICROSCOPY MARKET FOR LIFE SCIENCES IN 2016 79
FIGURE 28 GERMANY TO WITNESS THE HIGHEST GROWTH RATE IN THE EUROPEAN
MICROSCOPY MARKET FOR MATERIAL SCIENCES 83
FIGURE 29 BRAZIL TO ACCOUNT FOR THE LARGEST SHARE OF THE NANOTECHNOLOGY
APPLICATIONS MARKET IN ROW 87
14
MICROSCOPY MARKET – GLOBAL FORECAST TO 2021
© MarketsandMarkets
FIGURE 30 ACADEMIC INSTITUTES TO DOMINATE THE MICROSCOPY MARKET IN 2016 90
FIGURE 31 GROWTH IN NUMBER OF RESEARCH ACTIVITIES TO AID MARKET GROWTH FOR
ACADEMIC INSTITUTES (2010–2014) 91
FIGURE 32 ASIA-PACIFIC OFFERS LUCRATIVE GROWTH OPPORTUNITIES DURING THE
FORECAST PERIOD 92
FIGURE 33 NORTH AMERICA TO LEAD THE MICROSCOPY MARKET FOR INDUSTRIES DURING
THE FORECAST PERIOD 95
FIGURE 34 NORTH AMERICA IS EXPECTED TO DOMINATE THE MICROSCOPY MARKET FOR
OTHER END USERS 98
FIGURE 35 GEOGRAPHIC SNAPSHOT: ASIA-PACIFIC TO GROW AT THE FASTEST RATE DURING
THE FORECAST PERIOD 102
FIGURE 36 ASIA-PACIFIC OFFERS SIGNIFICANT GROWTH OPPORTUNITIES FOR ALL MICROCOPY
PRODUCT CATEGORIES DURING THE FORECAST PERIOD 103
FIGURE 37 NORTH AMERICA: MICROSCOPY MARKET SNAPSHOT, 2016 105
FIGURE 38 SEMICONDUCTORS APPLICATION SEGMENT TO DOMINATE THE U.S. MICROSCOPY
MARKET DURING THE FORECAST PERIOD 109
FIGURE 39 ACADEMIC INSTITUTES END-USER SEGMENT TO ACCOUNT FOR THE LARGEST
SHARE OF THE CANADIAN MICROSCOPY MARKET IN 2016 112
FIGURE 40 EUROPE: MICROSCOPY MARKET SNAPSHOT, 2016 114
FIGURE 41 ELECTRON MICROSCOPY TO GROW AT THE HIGHEST RATE IN THE EUROPEAN
MICROSCOPY MARKET DURING THE FORECAST PERIOD 115
FIGURE 42 SEMICONDUCTORS APPLICATION SEGMENT TO ACCOUNT FOR THE LARGEST
SHARE OF THE EUROPEAN MICROSCOPY MARKET IN 2016 119
FIGURE 43 ELECTRON MICROSCOPES PRODUCT SEGMENT TO GROW AT THE HIGHEST RATE
IN THE U.K. MICROSCOPY MARKET 120
FIGURE 44 ACADEMIC INSTITUTES END-USER SEGMENT TO ACCOUNT FOR THE HIGHEST
SHARE IN THE FRENCH MICROSCOPY MARKET IN 2016 123
FIGURE 45 NANOTECHNOLOGY TO WITNESS FASTEST GROWTH IN THE ROE MICROSCOPY
MARKET DURING FORECAST PERIOD 124
FIGURE 46 ASIA-PACIFIC: MICROSCOPY MARKET SNAPSHOT, 2016 127
FIGURE 47 ACADEMIC INSTITUTES END-USER SEGMENT TO WITNESS THE HIGHEST GROWTH
RATE IN THE ROW MICROSCOPY MARKET DURING THE FORECAST PERIOD 132
FIGURE 48 STM TO ACCOUNT FOR THE LARGEST SHARE OF THE SPM MARKET
IN BRAZIL IN 2016 134
FIGURE 49 ELECTRON MICROSCOPES PRODUCT SEGMENT TO ACCOUNT FOR THE LARGEST
SHARE OF THE MEXICAN MICROSCOPY MARKET IN 2016 136
FIGURE 50 NANOTECHNOLOGY APPLICATION SEGMENT TO OFFER LUCRATIVE GROWTH
OPPORTUNITIES IN ARGENTINA DURING THE FORECAST PERIOD 141
FIGURE 51 STM TO ACCOUNT FOR THE HIGHEST SHARE IN THE SPM MARKET
IN ROLA IN 2016 143
FIGURE 52 COMPANIES MAINLY PURSUED THE STRATEGY OF NEW PRODUCT LAUNCHES
FROM 2013 TO JULY 2016 146
FIGURE 53 GEOGRAPHIC REVENUE MIX OF THE TOP FIVE MARKET COMPANIES IN 2015 154
FIGURE 54 BRUKER CORPORATION: COMPANY SNAPSHOT 155
FIGURE 55 DANAHER CORPORATION: COMPANY SNAPSHOT 159
FIGURE 56 CARL ZEISS AG: COMPANY SNAPSHOT 164
FIGURE 57 NIKON CORPORATION: COMPANY SNAPSHOT 169
FIGURE 58 FEI CO.: COMPANY SNAPSHOT 173
FIGURE 59 OLYMPUS CORPORATION: COMPANY SNAPSHOT 177
15
MICROSCOPY MARKET – GLOBAL FORECAST TO 2021
© MarketsandMarkets
FIGURE 60 OXFORD INSTRUMENTS: COMPANY SNAPSHOT 180
FIGURE 61 JEOL LTD.: COMPANY SNAPSHOT 184
FIGURE 62 HITACHI HIGH-TECHNOLOGIES CORPORATION: COMPANY SNAPSHOT 187
16
MICROSCOPY MARKET – GLOBAL FORECAST TO 2021
© MarketsandMarkets
LIST OF ABBREVIATIONS
ABBREVIATIONS FULL FORM
AFM Atomic Force Microscopy
AMIIF Asociación Mexicana De Industrias De Investigación Farmacéutica
APAC Asia-Pacific
ARRA American Recovery & Reinvestment Act
BRAIN Brain Research Through Advancing Innovative Neurotechnologies
BrainMIC Berkeley Brain Microscopy Innovation Center
BSI Bruker Scientific Instruments
BSM Belgian Society for Microscopy
CAHT Controlled Atmosphere High Temperature
CARS Coherent Anti-Strokes Raman Scattering Microscopy
CCD Charge-coupled Device
CdSe Cadmium Selenide
CFE Cold Field Emission
CFI Canada Foundation for Innovation
CIHR Canadian Institutes of Health Research
CMOS Complementary Metal-Oxide Semiconductor
CNTs Carbon Nanotubes
COSM Combined Otolaryngology Spring Meetings
CRADA Cooperative Research And Development Agreement
CROs Contract Research Organizations
DME Danish Micro Engineering
DOE Department of Energy
DS Digital Sight
EBAC Electron Beam Absorbed Current
EC European Commission
EC cell Electrochemistry Cell
EDX Enable Atomic-Level Dispersive X-Ray
EM Electron Microscope
EMC European Microscopy Congress
ENT Ear, Nose, and Throat
ERC European Research Council
ER-C Ernst Ruska-Centre
ESM Electrochemical Strain Microscopy
ETEM Environmental Transmission Electron Microscope
EVO Evolution hd 2D Medical Video Recorder
FE-SEM Field Emission Scanning Electron Microscope
17
MICROSCOPY MARKET – GLOBAL FORECAST TO 2021
© MarketsandMarkets
ABBREVIATIONS FULL FORM
FIB Focused Ion Beam
FISH Fluorescence In Situ Hybridization
FLIM Fluorescence Lifetime Imaging Microscopy
FLIP Fluorescence Loss In Photobleaching
FM Fluorescence Microscopy
FONDECYT National Fund For Scientific and Technological Development
FOUP Front-opening Universal Pod
FP7 European Commission’s Seventh Framework Programme
FRAP Fluorescence Recovery After Photo-Bleaching
FRET Fluorescence Resonance Energy Transfer
GDP Gross Domestic Product
GFIS Gas Field Ion Source
GSD Ground State Depletion
HBP Human Brain Project
ICT Information and Communication Technology
IR Infrared
KAUST King Abdulla University of Science and Technology
LAS AF Leica Application Suite Advanced Fluorescence
LAS X Leica Application Suite X
LSM Laser Scanning Microscopes
MAPS Modular Automated Processing System
MCT Ministry of Science and Technology
MEMS Microelectromechanical Systems
MMM Multiphoton Multi-Point Scanning Microscopy
MP Multi photon
MPGE Mewborne School of Petroleum and Geological Engineering
mSPIM Multidirectional Selective Plane Illumination Microscopy
NAB Nanoparticle-albumin Bound
NASFA Navigation System for Failure Analysis
NCI National Cancer Institute
NGI National Graphene Institute
NIH National Institutes of Health
NIHN National Institute of Health And Nutrition
NINT National Institute of Nanotechnology
NLO Non-linear Optics
NMR Nuclear Magnetic Resonance
NNI National Nanotechnology Initiative
NRC National Research Council
18
MICROSCOPY MARKET – GLOBAL FORECAST TO 2021
© MarketsandMarkets
ABBREVIATIONS FULL FORM
NSERC Natural Sciences and Engineering Research Council of Canada
NSOM Near-field Scanning Optical Microscopy
NSRCs Nanoscale Science Research Centers
NTS Nanotechnology Systems Pty. Ltd.
OAD Open Application Development
OEMs Original Equipment Manufacturers
OHSU Oregon Health & Science University
OPO Optical Parametric Oscillator
ORNL Oak Ridge National Laboratory
OTD Office of Technological Development
PALM Photo-activated Localization Microscopy
PCB Printed Circuit Board
PFIB Plasma Focused Ion Beam
PFS Perfect Focus System
PPACA The Patient Protection and Affordable Care Act
QC Quality Control
RESOFLT Reversible Saturable Optical Fluorescence Transitions
RoE Rest of Europe
RoLA Rest of Latin America
RoW Rest of the World
RT Revenue Tree
SAI Small Angle Illumination
SBFSEM Serial Block Face Sem
SDDs Silicon-drift X-Ray Detectors
SEM Scanning Electron Microscopy
SFC Swept Field Confocal
SII Seiko Instruments, Inc.
SIM Structured Illumination Microscopy
SMEs Subject Matter Experts
SMEs Small and Medium-Sized Enterprises
sMIM Scanning Microwave Impedance Microscopy
SML Single-molecule Localization
SRC Spectra Research Corporation
SSIM Saturated Structured Illumination Microscopy
STED Stimulated Emission Depletion Microscopy
STM Scanning Tunneling Microscopy
STORM Stochastic Optical Reconstruction Microscopy
TEM Transmission Electron Microscopy
19
MICROSCOPY MARKET – GLOBAL FORECAST TO 2021
© MarketsandMarkets
ABBREVIATIONS FULL FORM
TERS Tip-enhanced Raman Spectroscopy
TIRF Total Internal Reflection Fluorescence Microscopy
U.K. United Kingdom
U.S. United States of America
UCSF University of California in San Francisco
UEM Ultrafast Electron Microscope
UHV Ultra-high Vacuum
VFM2 Variable Field Module2
VP Variable Pressure
VS Volumescope
VSG Visualization Sciences Group
XRD X-ray Diffraction
XRM X-ray Microscopy
ZnS Zinc Sulfide
20
MICROSCOPY MARKET – GLOBAL FORECAST TO 2021
© MarketsandMarkets
1 INTRODUCTION
1.1 OBJECTIVES OF THE STUDY
 To define, describe, and forecast the global microscopy market on the basis of product,
application, end user, and region
 To provide detailed information regarding major factors influencing growth of the market
(drivers, restraints, opportunities, industry-specific challenges, and winning imperatives)
 To analyze micromarkets1 with respect to individual growth trends, future prospects, and
contributions to the overall market
 To analyze opportunities in the market for stakeholders and to provide details of the
competitive landscape for the market leaders
 To forecast the size (by value) of market segments with respect to four main regions (along with
countries)—North America, Europe, Asia-Pacific, and Rest of the World
 To profile key companies and comprehensively analyze their market shares and core
competencies2
 To track and analyze competitive developments such as mergers and acquisitions, new product
developments, agreements and partnerships, and research and development activities in the
microscopy market
1.2 MARKET DEFINITION
Microscopes are analytical devices used to view enlarged/magnified images of small objects. The process
of investigation of small (or microscopic) objects with the help of microscopes is known as microscopy.
1. Micro markets are defined as further segments and sub segments of the global microscopy market included in the report.
2. Core competencies of companies are captured in terms of their key developments, SWOT analyses, and the key strategies adopted by them to
sustain their positions in the market.
21
MICROSCOPY MARKET – GLOBAL FORECAST TO 2021
© MarketsandMarkets
1.3 MARKET SCOPE
1.3.1 MARKETS COVERED
1.3.2 YEARS CONSIDERED FOR THE STUDY
Note: For market estimates, the calendar year has been considered, whereas, for company profiles, the fiscal year has been
considered.
BY END USER
• Academic Institutes
• Industries
(Pharmaceutical and
Biotechnology,
Semiconductor, Natural
Resources, and Material
Science)
• Other End Users
(Government Research
Institutions and Private
Laboratories
BY REGION
• North America
 U.S.
 Canada
• Europe
 Germany
 U.K.
 France
 Rest of Europe (RoE)
• Asia-Pacific (APAC)
• Rest of the World (RoW)
 Brazil
 Mexico
 Argentina
 Rest of Latin America
(RoLA)
BY APPLICATION
• Semiconductors
• Life Sciences
• Material Sciences
• Nanotechnology
BY PRODUCT
• Optical Microscopes
 Fluorescence Microscopes
 Super-resolution
Microscopes
• Electron Microscopes
 Transmission Electron
Microscopes
 ScanningElectron
Microscopes
• Confocal Microscopes
 Multi-photon Confocal
Microscopes
 SpinningDisk Confocal
Microscopes
• Scanning Probe
Microscopes
 ScanningTunneling
Microscopes
 Atomic Force Microscopes
 Near-field ScanningOptical
Microscopes
GLOBAL MICROSCOPY MARKET
2014
HISTORICAL YEAR
2015
BASE YEAR
2021-p
PROJECTED YEAR
2016-e–2021-p
FORECAST PERIOD
2016-e
ESTIMATED YEAR
22
MICROSCOPY MARKET – GLOBAL FORECAST TO 2021
© MarketsandMarkets
1.4 CURRENCY
The currency used in this report is USD, with market size indicated in terms of USD million.
 For companies reporting their revenue in USD, the revenue numbers have been taken from
their respective annual reports/SEC filings
 For companies reporting their revenue in other currencies, the average annual currency
conversion rates have been used for a particular year to convert the value to USD
1.5 LIMITATIONS
 The market study does not cover the market in terms of volume
 This study does not cover the accessories and services markets for microscopy
 The market size for super-resolution microscopes and fluorescence microscopes are not
covered, due to limited availability of data
1.6 STAKEHOLDERS
 Academic institutes
 Pharmaceutical and biotechnology industries
 Semiconductor industries
 Research institutes
 Laboratories
 Medical device suppliers
 Market research and consulting firms
23
MICROSCOPY MARKET – GLOBAL FORECAST TO 2021
© MarketsandMarkets
2 RESEARCH METHODOLOGY
This research study involved the use of extensive secondary sources, directories, and databases such as
Hoovers, Bloomberg Businessweek, Factiva, and OneSource, to identify and collect information useful for
this technical, market-oriented, and commercial study of the global microscopy market. The primary
sources are mainly several industry experts from core and related industries and preferred suppliers,
manufacturers, distributors, service providers, reimbursement providers, technology developers, doctors,
physiotherapists, alliances, standards and certification organizations from companies and organizations
related to all segments of this industry’s value chain. In-depth interviews have been conducted with various
primary respondents, which include key industry participants, subject matter experts (SMEs), C-level
executives of important market companies, and industry consultants, to obtain and verify critical
qualitative and quantitative information as well as to assess future prospects.
FIGURE 1 RESEARCH DESIGN
MARKET DRIVERS:
• Technological
advancements
• Favorable government
funding
MARKET RESTRAINTS:
• High cost of advanced
microscopes
• Implementation of
excise tax by the U.S.
government
MARKET OPPORTUNITIES:
• Emerging markets
• New application areas
• Integration of
microscopy with
spectroscopy
MARKET CHALLENGES:
• Sample preparation
• Requirement of high degree of technical expertise
HISTORICAL DATA
FOR THE
MICROSCOPY
MARKET
INFLUENCING
FACTORS
(Market Trends and
Dynamics)
HISTORICAL DATA OF THE
MARKET
MARKET SIZE & FORECAST:
• By Product
• By Application
• By End User
• By Region
ARRIVE AT THE MARKET
SIZE, SHARE, AND CAGR
FOR THE MICROSCOPY
MARKET
COMPETITIVE LANDSCAPE
FUNDING SCENARIO
GEOGRAPHIC USAGE PATTERNS
REGULATORY LANDSCAPE
IMPACT ANALYSIS OF
MARKET TRENDS
FORECAST
NEW PRODUCT LAUNCHES:
More than 90 new product
launches between January
2013 to July 2016
24
MICROSCOPY MARKET – GLOBAL FORECAST TO 2021
© MarketsandMarkets
In the secondary research process, various secondary sources have been referred to identify and collect
information for this study. Secondary sources include annual reports, press releases, and investor
presentations of companies, white papers, medical journals, certified publications, articles from recognized
authors, gold standard and silver standard websites, disease-specific organizations, directories, and
databases.
Secondary research has been mainly used to obtain key information about the industry’s supply chain, its
monetary chain, the total pool of key companies, market classification and segmentation according to
industry trends to the bottom-most level, geographical markets, and key developments from both market-
and technology-oriented perspectives.
In the primary research process, various primary sources from both supply and demand sides have been
interviewed to obtain qualitative and quantitative information for this report. The primary sources from the
supply side include industry experts such as CEOs, vice presidents, marketing directors, technology and
innovation directors, and related key executives from various leading companies and organizations
operating in the microscopy market. The primary sources from the demand side include scientists,
pathologists, doctors, and purchase managers of research institutes, government and private laboratories,
and academic institutes.
After the complete market engineering (which includes calculations for market statistics, market
breakdown, market size estimations, market forecasting, and data triangulation) extensive primary
research has been conducted to gather information and verify and validate the critical numbers arrived at.
Primary research has been also conducted to identify segmentation types; industry trends; key companies;
the competitive landscape; key market dynamics such as drivers, restraints, opportunities, challenges,
burning issues, winning imperatives, industry trends, and key player strategies; and conduct the PEST
analysis of the market.
In the complete market engineering process, both top-down and bottom-up approaches have been
extensively used, along with several data triangulation methods to perform market estimation and market
forecasting for the overall market segments and sub segments listed in this report. Extensive qualitative
and quantitative analysis has been performed on the complete market engineering process to list key
information/insights throughout the report.
25
MICROSCOPY MARKET – GLOBAL FORECAST TO 2021
© MarketsandMarkets
2.1 MARKET SIZE ESTIMATION
Both top-down and bottom-up approaches have been used to estimate and validate the size of the global
microscopy market and other dependent sub markets.
The research methodology used to estimate the market size includes the following details:
 Regional geographical markets have been determined through secondary research and added
up to estimate the global market value. All percentage shares, splits, and breakdowns have
been determined using secondary sources and verified through primary sources. This entire
procedure includes the study of annual and financial reports of top market companies and
extensive interviews for obtaining key insights from industry leaders such as CEOs, VPs,
directors, and marketing executives
 All possible parameters that affect the markets covered in this research study have been
accounted for, viewed in extensive detail, verified through primary research, and analyzed to
derive the final quantitative and qualitative data. This data is consolidated, combined with
detailed inputs and analysis from MarketsandMarkets to be presented in this report
FIGURE 2 MARKET SIZE ESTIMATION AND DATA TRIANGULATION
Note: *Other end users include government research institutes and private laboratories
As depicted in the chart, the global microscopy market has been triangulated using both bottom-up and
top-down approaches. The global microscopy market has been determined from both primary interviews
and secondary sources. By using the bottom-up and top-down approaches, the size of the global
microscopy market has been determined by summing up the shares of various geographical regions,
products, applications, and end users.
GLOBAL MICROSCOPY MARKET
Top-down Approach
Secondary SourcesPrimary Sources
APPLICATION
Life Sciences
Semiconductors
Nanotechnology
Material Sciences
END USER
Academic Institutes
Industries
Others*
REGION
Europe
North America
Asia-Pacific
PRODUCT
Confocal Microscopes
Optical Microscopes
Bottom-up Approach
Scanning Probe
Microscopes
Electron Microscopes
RoW
26
MICROSCOPY MARKET – GLOBAL FORECAST TO 2021
© MarketsandMarkets
FIGURE 3 BREAKDOWN OF PRIMARY INTERVIEWS: BY COMPANY TYPE, DESIGNATION,
AND REGION
Note: *Others include sales managers, marketing managers, and product managers
Note: The C-level includes Chief Financial Officers, Chief Executive Officers, Chief Information Officers, and Chief Operating Officers
*The tiers of companies are defined on the basis of their total revenue. As of 2013: Tier 1 = >USD 5 billion, Tier 2 = USD 500 million
to USD 5 billion, and Tier 3 = < USD 500 million
NUMBER OF PRIMARIES: BY COMPANY TYPE
NUMBER OF PRIMARIES: BY DESIGNATION NUMBER OF PRIMARIES: BY REGION
NUMBER OF PRIMARIES: BY TYPE
80%
20%
Supply-side Demand-side
22%
45%
22%
11%
Tier 1 Companies Tier 2 Companies
Tier 3 Companies Consultants
10%
20%
70%
C-Level Director-Level Others*
50%
10%
30%
10%
North America Europe
Asia-Pacific RoW
27
MICROSCOPY MARKET – GLOBAL FORECAST TO 2021
© MarketsandMarkets
2.2 MARKET BREAKDOWN AND DATA TRIANGULATION
After arriving at the overall market size from the market size estimation process explained above, the total
market has been split into several segments and sub segments. In order to complete the overall market
engineering process and arrive at the exact statistics for all segments and sub segments, the data
triangulation and market breakdown procedure has been employed wherever applicable. Data has been
triangulated by studying various factors and trends from both the demand and supply sides. Along with
this, the market has been validated using both top-down and bottom-up approaches.
FIGURE 4 MARKET DATA TRIANGULATION METHODOLOGY
SECONDARYSOURCESPRIMARY SOURCES
• Microscopy Society of America
• The European Microscopy Society
• Canadian Cytometry and
Microscopy Association
• Chinese Electron Microcopy
Society
• Australian Microscopy and
Microanalysis Society
Annual Reports, Presentations,
Websites and Press Release
of top players, News Articles,
Journals, and Paid Databases
INTERVIEWS WITH:
• Physicians
• Microscopy technicians and
technologists
• Purchase managers in
healthcare provider
organizations
DEMANDSIDE
INTERVIEWS WITH:
• CEOs
• Vice presidents
• Marketing directors
• Technology and innovation
directors and related key
executives from various key
companies and
organizations operating in
the market
SUPPLYSIDE
INFORMATIONSOURCED
Key Players Competitive Landscape
Drivers and Restraints
Opportunities/
Challenges
Forecasting
Market Size (2016) and
Market Share (2015)
Analysis
Regional Analysis
MnM KNOW* stands for MarketsandMarkets’ 'Knowledge Asset Management' framework. In this context, it stands for existing
market research knowledge repository of over 5,000 granular markets, our flagship competitive intelligence and market
research platform "RT", subject matter experts, and independent consultants. MnM KNOW acts as an independent source
that helps us validate information gathered from primary and secondary sources .
MnM KNOW*
PRIMARY
SOURCE
SECONDARY
SOURCE
DATA
TRIANGULATION
28
MICROSCOPY MARKET – GLOBAL FORECAST TO 2021
© MarketsandMarkets
2.2.1 KEY DATA FROM SECONDARY SOURCES
2.2.2 KEY DATA FROM PRIMARY SOURCES
*Note: Other end users include government research institutes and private laboratories
PARAMETERS SOURCES
MARKET SIZE
• Company Financials
• Magazines
• Journals
• Press Releases
• Paid Databases
• MarketsandMarkets Data Repository
REVENUE
OF COMPANIES
• Annual Reports
• Company Websites
• Public Databases
• MarketsandMarkets Data Repository
QUALITATIVE INFORMATION
(Market Dynamics, Trends)
• Company Websites
• Annual Reports
• Press Releases
• MarketsandMarkets Data Repository
DATAPARAMETERSTYPE
 North America: 35%–37%
 Europe: 28%–30%
 Asia-Pacific: 23%–25%
 RoW: 9%–11%
According to primary interviews, the
following are the percentage splits
used for the regional analysis
GEOGRAPHIC
SPLIT
 Optical Microscopes: 36%–38%
 Electron Microscopes: 38%–40%
 Confocal Microscopes: 8%–10%
 Scanning Probe Microscopes: 14%–16%
According to primary interviews, the
following percentage splits have
been used for product analysis
PRODUCT
ANALYSIS
 Academic Institutes: 51%--53%
 Industries: 29%--31%
 Other End Users*: 16%--18%
According to primary interviews, the
following are the percentage splits
used for the end-user analysis
END USER
ANALYSIS
29
MICROSCOPY MARKET – GLOBAL FORECAST TO 2021
© MarketsandMarkets
2.2.2.1 Key industry insights
Consultant,
Microscopy,U.S.
EMEA Head ,
LeadingMicroscopySupplier
President,
LeadingMicroscopyCompany,U.K.
Sr. VicePresident, MicroscopyBusiness
LeadingMicroscopyCompany,Europe
The average growth for the
global microscopy market
will be between 7%–8%.“ “
CEO, LeadingProvider of
MicroscopyProducts, U.S.
The U.S. dominates the
microscopy market, while the Asia-
Pacific is expected to register the
highest growth from
2016 to 2021.
“ “ Emerging markets such
as China, India, Brazil, and Middle
East offer new avenues for the growth
of the microscopy market.
“ “
Super-resolution microscopy
is an upcoming trend in
this market.
“ “ Nanotechnology is the
fastest-growing application segment in
the microscopy market.“ “
30
MICROSCOPY MARKET – GLOBAL FORECAST TO 2021
© MarketsandMarkets
2.3 ASSUMPTIONS
Note: Market values have been rounded off to the second decimal place. Due to this, there may be a slight difference in the actual
total and the total mentioned in table.
IMPACTSASSUMPTIONSPARAMETERS
Stability in exchange rates will stabilize the prices of
microscopes during imports and exports.
It is assumed that dollar fluctuations
will not affect the forecast to a
significant extent.
Exchange Rates
This will lead to increasing growth opportunities for
market players in the emerging Asia-Pacific and Latin
American nations.
Current government R&D spending
patterns are assumed to be
persistent in major countries across
the four regions during the forecast
period.
Government
R&D Spending
Patterns
The revenues of companies are of high importance for
estimating the size of the parent market and its
subsegments.
Revenues of private companies
acquired from paid databases were
assumed to be in-line with actual
company financials.
Company
Financials
31
MICROSCOPY MARKET – GLOBAL FORECAST TO 2021
© MarketsandMarkets
3 EXECUTIVE SUMMARY
Microscopes are analytical and scientific instruments used to view enlarged/magnified images of small
objects. The process of investigation of small (or microscopic) objects with the help of microscopes is
known as microscopy.
The global microscopy market is technology driven, with a high degree of fragmentation and competition
due to increasing research and innovation in the fields of life sciences and nanotechnology. The global
microscopy market is expected to reach USD 6,726.5 million in 2021 from USD 4,685.4 million in 2016, at
a CAGR of 7.5% from 2016 to 2021.
Factors such as favorable government and private funding and rising focus on nanotechnology are driving
growth of the microscopy market. In addition, technological advancements such as the introduction of
digitalized microscopes and super-resolution techniques are supporting market growth. However, factors
such as the high cost of advanced microscopes, implementation of excise tax by the U.S. government, and
high custom duty charged on medical devices are restraining growth of this market.
FIGURE 5 MICROSCOPY MARKET SNAPSHOT, 2016 VS. 2021
Source: Annual Reports, Press Releases, SEC Filings, Investor Presentations, Microscopy Society of America, Canadian Cytometry and
Microscopy Association, Chinese Electron Microcopy Society, Australian Microscopy and Microanalysis Society, Journal of
Microscopy, Journal of Advanced Microscopy Research, Expert Interviews, and MarketsandMarkets Analysis
In this report, the global microscopy market is broadly segmented based on products, applications, and
end users. On the basis of products, the microscopy market is segmented into four broad categories—
optical microscopes, confocal microscopes, electron microscopes, and scanning probe microscopes (SPM).
The optical microscopes segment is further divided into fluorescence microscopes (FM) and super-
resolution microscopes. The confocal microscopes segment is sub segmented into multi-photon and
confocal disk spinning microscopes. The electron microscopes segment is further categorized into
transmission electron and SEM, while the SPM segment is further divided into STM, atomic force
microscopes (AFM), and near-field scanning optical microscopes (NSOM). The electron microscopy
segment is expected to account for the largest share of the microscopy products market in 2016. This
large share can be attributed to growing demand for electron microscopes in semiconductors and
electronics.
USD 4,685.4
Million
USD 6,726.5
Million
-
1,000.0
2,000.0
3,000.0
4,000.0
5,000.0
6,000.0
7,000.0
8,000.0
2016 2021
MarketSize(USDMillion)
32
MICROSCOPY MARKET – GLOBAL FORECAST TO 2021
© MarketsandMarkets
3.1 CURRENT SCENARIO
The microscopy market is currently witnessing continuous technological advancement and product
development. The global microscopy market is expected to reach USD 6,726.5 million in 2021 from USD
4,685.4 million in 2016, at a CAGR of 7.5% from 2016 to 2021.
The key companies in this market include Nikon Corporation (Japan), Bruker Corporation (U.S.), Danaher
Corporation (U.S.), Carl Zeiss AG (Germany), and FEI Co. (U.S.).
3.2 FUTURE OUTLOOK
The overall microscopy market is expected to grow at a rate of 7.5% from 2016 to 2021. The integration of
microscopes with spectroscopy, coupled with the use of super-resolution microscopes in the field of
ophthalmology and brain mapping, offers lucrative growth opportunities for market participants.
Furthermore, market growth will also be supported by rising development of advanced technologies, such
as customized microscopes and the launch of compatible and user-friendly software applications.
FIGURE 6 ELECTRON MICROSCOPES PRODUCT SEGMENT TO WITNESS THE FASTEST
GROWTH DURING THE FORECAST PERIOD
Source: Annual Reports, Press Releases, SEC Filings, Investor Presentations, Microscopy Society of America, Canadian Cytometry and
Microscopy Association, Chinese Electron Microcopy Society, Australian Microscopy and Microanalysis Society, Journal of
Microscopy, Journal of Advanced Microscopy Research, Expert Interviews, and MarketsandMarkets Analysis
On the basis of products, the microscopy market is broadly classified into electron microscopes, optical
microscopes, SPM, and confocal microscopes. In 2016, electron microscopes are expected to be the
largest product segment of the microscopy market, due to their high resolution and magnification power.
Electron microscopes are also expected to grow at the highest rate in the market due to their wide
applications in semiconductors and electronics.
Electron Microscopes Optical Microscopes
Scanning Probe
Microscopes
Confocal Microscopes
2016 1,842.3 1,769.7 638.7 434.8
2021 3,049.8 2,252.0 826.7 598.0
CAGR 10.6% 4.9% 5.3% 6.6%
0
500
1,000
1,500
2,000
2,500
3,000
3,500
MarketSize(USDMillion)
33
MICROSCOPY MARKET – GLOBAL FORECAST TO 2021
© MarketsandMarkets
FIGURE 7 SEMICONDUCTORS TO ACCOUNT FOR THE LARGEST SHARE OF THE MICROSCOPY
APPLICATIONS MARKET IN 2016
Source: Annual Reports, Press Releases, SEC Filings, Investor Presentations, Microscopy Society of America, Canadian Cytometry and
Microscopy Association, Chinese Electron Microcopy Society, Australian Microscopy and Microanalysis Society, Journal of
Microscopy, Journal of Advanced Microscopy Research, Expert Interviews, and MarketsandMarkets Analysis
On the basis of application, the microscopy market is broadly classified into semiconductors, life sciences,
material sciences, and nanotechnology. In 2016, semiconductors are expected to form the major
application area of the microscopy market due to increasing use of advanced microscopes such as
electron and SPM in research and development, routine inspection, and failure analysis. However,
nanotechnology is the fastest-growing application segment for the microscopy market, owing to its wide
array of applications and easy availability of funding.
Semiconductors Life Sciences Material Sciences Nanotechnology
2016 1,644.2 1,604.8 894.9 541.5
2021 2,371.3 2,353.1 1,121.0 881.2
CAGR 7.6% 8.0% 4.6% 10.2%
0
500
1,000
1,500
2,000
2,500
MarketSize(USDMillion)
34
MICROSCOPY MARKET – GLOBAL FORECAST TO 2021
© MarketsandMarkets
FIGURE 8 ACADEMIC INSTITUTES WILL BEMAJOR END USERS OF THE MICROSCOPY
MARKET
*Note: Others include government research institutes and private laboratories
Source: Annual Reports, Press Releases, SEC Filings, Investor Presentations, Microscopy Society of America, Canadian Cytometry and
Microscopy Association, Chinese Electron Microcopy Society, Australian Microscopy and Microanalysis Society, Journal of
Microscopy, Journal of Advanced Microscopy Research, Expert Interviews, and MarketsandMarkets Analysis
Based on end users, the microscopy market is categorized into academic institutes, industries, and other
end users, which include government research institutes and private laboratories. In 2016, the academic
institutes segment is expected to be the fastest-growing end-user segment of the microscopy market,
followed by industries. High growth rate of this segment is attributed to the availability of government and
private funding to academic institutes, among other factors.
Academic Institutes Industries Others*
2016 2,443.9 1,418.7 822.8
2021 3,758.1 1,958.8 1,009.7
CAGR 9.0% 6.7% 4.2%
0
500
1,000
1,500
2,000
2,500
3,000
3,500
4,000
MarketSize(USDMillion)
35
MICROSCOPY MARKET – GLOBAL FORECAST TO 2021
© MarketsandMarkets
FIGURE 9 GEOGRAPHICAL SNAPSHOT: NORTH AMERICA DOMINATED THE MICROSCOPY
MARKET IN 2015
Source: Annual Reports, Press Releases, SEC Filings, Investor Presentations, Microscopy Society of America, Canadian Cytometry and
Microscopy Association, Chinese Electron Microcopy Society, Australian Microscopy and Microanalysis Society, Journal of
Microscopy, Journal of Advanced Microscopy Research, Expert Interviews, and MarketsandMarkets Analysis
North America (comprising the U.S. and Canada) accounted for the largest share of 36.5% of the global
microscopy market in 2015. Factors such as favorable funding scenario, rising focus on nanotechnology,
and technological advancements are driving growth of this region. However, the implementation of excise
tax by the U.S. government and a dearth of skilled labor are major factors likely to restrain growth of this
market during the forecast period.
Compared to mature markets, the Asia-Pacific region is expected to grow at the highest rate from 2016 to
2021. Growth in this region is propelled by factors such as improving research and development
infrastructure, rising focus on the region by market companies, and increasing government initiatives.
New product launches (82.03%), followed by agreements, collaborations, and partnerships (10.94%),was
the major growth strategy adopted by key market companies in the market. Key industry companies in the
global microscopy market are Bruker Corporation (U.S.), Carl Zeiss AG (Germany), FEI Co. (U.S.), Leica
Microsystems (Germany), Nikon (Japan), and Olympus Corporation (Japan).
10.4%
6.9%
REST OF THE WORLD
29.5%
7.4%
EUROPE
ASIA-PACIFIC
23.5%
9.8%
36.5%
6.0%
NORTH AMERICA
MarketShare (2015)
CAGR (2016-2021)
36
MICROSCOPY MARKET – GLOBAL FORECAST TO 2021
© MarketsandMarkets
3.3 CONCLUSION
Majority of the leading companies in the microscopy market are focusing on product development and
product enhancement. They are also focusing on expanding their distribution networks by pursuing
inorganic growth strategies such as partnerships and collaborations. This enables them to cater to
increasing demand of consumers and provide easy-to-operate and efficient microscopy products. Besides
these, acquisition will prove to be an effective growth strategy for companies focusing on increasing their
shares in the global microscopy market during the forecast period.
37
MICROSCOPY MARKET – GLOBAL FORECAST TO 2021
© MarketsandMarkets
4 PREMIUM INSIGHTS
4.1 MICROSCOPY MARKET SNAPSHOT, 2016 VS 2021
FIGURE 10 TECHNOLOGICAL ADVANCEMENTS AND FAVORABLE GOVERNMENT FUNDING ARE
IMPORTANT GROWTH DRIVERS
Source: Annual Reports, Press Releases, SEC Filings, Investor Presentations, Microscopy Society of America, Canadian Cytometry and
Microscopy Association, Chinese Electron Microcopy Society, Australian Microscopy and Microanalysis Society, Journal of
Microscopy, Journal of Advanced Microscopy Research, Expert Interviews, and MarketsandMarkets Analysis
USD
4,685.4
Million
USD
6,726.5
Million
 The global microscopy market is projected to
reach USD 6,726.5 million by 2021, at a CAGR
of 7.5% from 2016 to 2021
 Market growth is attributed to the rising focus on
nanotechnology; favorable government and
corporate funding; and technological
advancements such as high-throughput
techniques, super-resolution, and digitalization
in microscopy
 Emerging economies such as India, China,
Middle East, and Brazil offers significant market
growth opportunities
2016 2021
38
MICROSCOPY MARKET – GLOBAL FORECAST TO 2021
© MarketsandMarkets
4.2 MICROSCOPY MARKET, BY PRODUCT
FIGURE 11 ELECTRON MICROSCOPES TO ACCOUNT FOR THE HIGHEST SHARE IN 2016
Source: Annual Reports, Press Releases, SEC Filings, Investor Presentations, Microscopy Society of America, Canadian Cytometry and
Microscopy Association, Chinese Electron Microcopy Society, Australian Microscopy and Microanalysis Society, Journal of
Microscopy, Journal of Advanced Microscopy Research, Expert Interviews, and MarketsandMarkets Analysis
EUROPE
NORTH AMERICA
REST OF THE WORLD
13.6% 37.8% 39.3% 36.1% 29.5% 24.1%
OPTICAL MICROSCOPES
ELECTRON MICROSCOPES
MICROSCOPY MARKET SHARE,
BY PRODUCT (2016)
MICROSCOPY MARKET SHARE,
BY REGION (2016)
SCANNING PROBE
MICROSCOPES
CONFOCAL MICROSCOPES
ASIA-PACIFIC
9.3% 10.4%
39
MICROSCOPY MARKET – GLOBAL FORECAST TO 2021
© MarketsandMarkets
4.3 MICROSCOPY MARKET, BY REGION
FIGURE 12 ASIA-PACIFIC TO GROW AT THE HIGHEST RATE DURING THE FORECAST PERIOD
Source: Annual Reports, Press Releases, SEC Filings, Investor Presentations, Microscopy Society of America, Canadian Cytometry and
Microscopy Association, Chinese Electron Microcopy Society, Australian Microscopy and Microanalysis Society, Journal of
Microscopy, Journal of Advanced Microscopy Research, Expert Interviews, and MarketsandMarkets Analysis
4.4 MICROSCOPY MARKET, BY APPLICATION
FIGURE 13 SEMICONDUCTORS SEGMENT TO DOMINATE THE MICROSCOPY APPLICATIONS
MARKET IN 2016
Source: Annual Reports, Press Releases, SEC Filings, Investor Presentations, Microscopy Society of America, Canadian Cytometry and
Microscopy Association, Chinese Electron Microcopy Society, Australian Microscopy and Microanalysis Society, Journal of
Microscopy, Journal of Advanced Microscopy Research, Expert Interviews, and MarketsandMarkets Analysis
7.4%
6.9%
Rest of the
World
Europe
>7% CAGR (High Growth)
17.7%
6%-7% CAGR ( Medium Growth)
9.8% Asia-Pacific
6.0% North America
Semiconductors Life Sciences Material Sciences Nanotechnology
2016 1,644.2 1,604.8 894.9 541.5
2021 2,371.3 2,353.1 1,121.0 881.2
CAGR 7.6% 8.0% 4.6% 10.2%
0
500
1,000
1,500
2,000
2,500
MarketSize(USDMillion)
40
MICROSCOPY MARKET – GLOBAL FORECAST TO 2021
© MarketsandMarkets
4.5 MICROSCOPY MARKET, BY END USER
FIGURE 14 ACADEMIC INSTITUTES FORM MAJOR END USERS OF THE MICROSCOPY MARKET
*Other end users include government research institutes and private laboratories.
Source: Annual Reports, Press Releases, SEC Filings, Investor Presentations, Microscopy Society of America, Canadian Cytometry and
Microscopy Association, Chinese Electron Microcopy Society, Australian Microscopy and Microanalysis Society, Journal of
Microscopy, Journal of Advanced Microscopy Research, Expert Interviews, and MarketsandMarkets Analysis
4.6 LIFE CYCLE ANALYSIS, BY REGION
FIGURE 15 ASIA-PACIFIC MARKET SHOWCASES LUCRATIVE GROWTH OPPORTUNITIES
Source: Annual Reports, Press Releases, SEC Filings, Investor Presentations, Microscopy Society of America, Canadian Cytometry and
Microscopy Association, Chinese Electron Microcopy Society, Australian Microscopy and Microanalysis Society, Journal of
Microscopy, Journal of Advanced Microscopy Research, Expert Interviews, and MarketsandMarkets Analysis
Academic Institutes Industries Other End Users*
2016 2,443.9 1,418.7 822.8
2021 3,758.1 1,958.8 1,009.7
CAGR 9.0% 6.7% 4.2%
0
500
1,000
1,500
2,000
2,500
3,000
3,500
4,000
MarketSize(USDMillion)GROWTH
PHASE
INTRODUCTION GROWTH MATURITY DECLINE
RoW
Asia-Pacific
North America
Europe
41
MICROSCOPY MARKET – GLOBAL FORECAST TO 2021
© MarketsandMarkets
5 MARKET OVERVIEW
KEY FINDINGS
 Growing focus on nanotechnology, favorable government and corporate funding to support
research activities, and technological advancements such as digitization of microscopes and
super-resolution techniques are key factors driving growth of the global microscopy market
 The high growth potential in emerging markets such as China, India, the Middle East, and Brazil,
along with novel application areas, unfolds huge growth opportunities for companies in the
microscopy market
 High cost of advanced microscopes, implementation of excise tax by the U.S. government, and
heavy custom duty charged on medical devices are key restraints to market growth
 Time-consuming sample preparation and requirement of a high degree of technical expertise
are key challenges to growth in this market
42
MICROSCOPY MARKET – GLOBAL FORECAST TO 2021
© MarketsandMarkets
5.1 INTRODUCTION
The global microscopy market is valued at USD 4,685.4 million in 2016 and is expected to reach USD
6,726.5 million by 2021, at a CAGR of 7.5% from 2016 to 2021. Microscopes are an integral part of
scientific research, and therefore, remain one of the most widely-used instruments in life science,
semiconductor, nanotechnology, and material science research. Market growth is expected to be driven by
growing inclination toward nanotechnology, favorable funding to support research activities, and
technological advancements.
5.2 MARKET DYNAMICS
The global microscopy market exhibits lucrative growth potential with a CAGR of 7.5% during the forecast
period. Growth of this market will be propelled by favorable funding and technology advancements such as
digitization of microscopes and super-resolution techniques. High growth potential in emerging markets
such as China, India, the Middle East, and Brazil, and novel application areas such as quantum dot,
unfolds huge growth opportunities for companies in the microscopy market. However, heavy custom duty
charged on medical devices, along with high costs of advanced microscopes, will hinder growth of this
market to some extent.
FIGURE 16 FAVORABLE GOVERNMENT AND CORPORATE FUNDING TO BOOST MARKET
GROWTH
Source: Secondary Literature, Expert Interviews, and MarketsandMarkets Analysis
• Rising focus on nanotechnology
• Favorable government and corporate funding for R&D
• Technological advancements
• High costs of advanced microscopes
• Implementation of excise tax by the U.S. government
• Heavy custom duty on medical devices
• Emerging markets
• Novel application areas
• Integration of microscopy with spectroscopy
• Time-consuming sample preparation process
• Requirement of high degree of technical expertise
DRIVERS
RESTRAINTS
OPPORTUNITIES
CHALLENGES
D
R
O
C
43
MICROSCOPY MARKET – GLOBAL FORECAST TO 2021
© MarketsandMarkets
5.2.1 DRIVERS
5.2.1.1 Rising focus on nanotechnology
Nanotechnology is a multidisciplinary field that covers a vast and diverse array of applications. Investments
in nanotechnology are rising owing to increased demand for advanced miniaturized systems and
applications in various fields such as pharmaceuticals, biotechnology, chemical manufacturing, aerospace,
electronics, and textiles.
Nanomedicine is the application of nanotechnology in medicine and human healthcare. It focuses on the
development of devices and chemical entities that can interact with the body at subcellular scales to
achieve maximal therapeutic efficacy with minimal side effects. Nanotechnology is the fastest-growing
application of microscopy. Currently, more than 250 small and established biotechnology and
pharmaceutical companies are involved in nanomedicine research. In January 2005, the FDA approved
Abraxane® (from Abraxis Bioscience, Inc. (U.S.)), a nanoparticle-albumin bound (nab) drug-delivery
platform. This new class of nanotherapeutics is used for the treatment of metastatic breast cancer.
The major applications of nanotechnology in the semiconductor industry include miniature transistor chips,
quantum dot, optoelectronics, and carbon nanotubes (CNTs). Similarly, growing interest in nanocrystalline
solids is an evolving trend in the material science sector.
Also, the global focus on nanotechnology is rising due to the availability of funding for research and
development in this segment. Since 2000, governments around the world have invested over USD 65
billion in nanotechnology research (source: cientifica). The U.S. government leads nanotechnology research
and development funding. It has proposed a budget of USD 1.5 billion in the National Nanotechnology
Initiative (NNI) funding for 2016. The rising focus on nanotechnology will thus boost the microscopy market
growth during the forecast period.
5.2.1.2 Favorable government and corporate funding for research and
development
Increasing government and corporate funding is expected to drive the microscopy market. Globally, around
USD 1.6 trillion are estimated to be invested in research and development in 2014, with the U.S., China,
Japan, and Europe together accounting for nearly 78% (Source: Battelle).
In April 2013, the Brain Research through Advancing Innovative Neurotechnologies (BRAIN) Initiative was
launched by the U.S. government to assist neurological research. The initiative is projected to cost over
USD 300 million per year for a period of ten years. Similarly, in 2013, the European Union initiated the
Human Brain Project (HBP), a 10-year research project that will develop information and communication
technology (ICT) platforms in six areas including neuroinformatics, brain simulation, high-performance
computing, medical informatics, neuromorphic computing, and neurorobotics. In addition, the government
of Germany granted USD 36 million to boost universities and other research institutions in June 2009.
Favorable government funding to support research is expected to propel growth of the microscopy market
in the near future.
44
MICROSCOPY MARKET – GLOBAL FORECAST TO 2021
© MarketsandMarkets
5.2.1.3 Technological advancements
Technological advancements serve to reduce product and test costs. Advancements in microscopy
techniques such as digitization, live-cell imaging, super resolution, and high-throughput methods are
generating interest among academic institutes, research laboratories, and pharmaceutical and
biotechnology companies. Miniaturization of devices allows easy installation of these devices in small
laboratories, thereby overcoming space constraints. Furthermore, most end users are interested in
instruments that offer better reproducibility of results, higher ease of operation, wider application profiles,
and higher throughput. This has prompted a high degree of research into microscopes. Over 90 new
products have been launched in this market between 2013 and 2016. Some key product launches are
listed below.
 In May 2016, Carl Zeiss introduced ZEISS LSM 880 with Airyscan detector for confocal laser
scanning microscopes. This upgrade enables improved signal-to-noise ratio, a four-fold increase
in imaging speed, and 1.5x resolution improvement.
 In May 2016, FEI introduced Apreo, a scanning electron microscope (SEM). The product utilizes
the proprietary compound final lens design that allows improvement in resolution and
backscatter detection at the lowest beam current.
Developments in labeling technologies have enabled real-time 3D imaging of living cells, which is of great
use in cytology studies. For instance, advances in confocal and multiphoton microscopy have enabled the
development of genetically-coded fluorescent proteins and enhanced imaging. Such technologies are
driving growth of the microscopy market in life sciences. Companies such as Olympus and Nikon have
implemented novel fluorescent technologies such as fluorescence recovery after photobleaching (FRAP)
and fluorescence loss in photobleaching (FLIP) in their products.
Digitization of microscopes is a key trend in the market with conventional microscopes increasingly being
replaced by integrated digital image analysis systems. Digital imaging offers enhanced image resolution
with greater precision, leading to lesser distorted images and allowing better viewing of samples. Emerging
advanced software tools for imaging/analysis as well as transfer of images across local-area and wide-area
network in microscopy are fueling market growth. Nikon’s Coolscape digital microscope allows better
illumination, digital image capture, and local area/wide area communication capabilities.
5.2.2 RESTRAINTS
5.2.2.1 High cost of advanced microscopes
Owing to technological advancements, there has been a paradigm shift in the usage pattern of
microscopes. Optical microscopes are gradually losing their market to high-end microscopes such as
electron microscopes and SPM due to features including higher resolution and magnification power that
advanced microscopes offer. However, these microscopes cost between USD 250,000 and USD 2 million,
which is a major factor limiting their adoption. In addition to this, recurrent expenses in the form of
maintenance of these microscopes may result in an annual operational cost of an electron microscope of
up to USD 100,000. This high cost has resulted in dependence of users on government and private
research funding. Thus, high costs of advanced microscopes are expected to restraint growth of the
microscopy market during the forecast period.
45
MICROSCOPY MARKET – GLOBAL FORECAST TO 2021
© MarketsandMarkets
5.2.2.2 Implementation of excise tax by the U.S. government
Under the Patient Protection and Affordable Care Act (PPACA), the U.S. government imposed an excise tax
of 2.3% on Class I, II, and III medical devices, from January 2013. This tax is applicable to medical devices
manufactured or imported in the U.S. Due to this, the market for some automated medical devices
including medical robots, defibrillators, and medical imaging equipment (such as microscopes) will be
affected in the U.S. This tax will result in lower profits for manufacturers as well as lower reimbursement
from payers for procedures in which these devices are used. This may hinder growth of the U.S. market. As
the U.S. accounts for a major share of the global microscopy market, this is expected to affect the market
on a global level.
5.2.2.3 Heavy custom duty on medical devices
Customs duty is a type of indirect tax levied on goods imported into as well as on goods exported from a
country. For instance, in India, although the government provides an exemption of custom duty to
academic institutes, manufacturers and suppliers of microscopy instruments and accessories are
mandated to pay a heavy custom duty of nearly 28%. This increases the cost of the product manifold.
Similarly, growth of the microscopy market in Brazil is also restricted by huge custom duty charges.
5.2.3 OPPORTUNITIES
5.2.3.1 Emerging markets
China, India, Brazil, and the Middle East are emerging markets for microscopy; markets in these
geographies are in the growth stage. These markets lack proper standards and government regulations,
thus offering huge potential for providers unable to meet U.S. standards.
China is a high potential market for microscopy due to easy availability of funding to support research,
presence of skilled workforce, and availability of early stage capital to ensure effective technology transfer.
Hence, it is estimated that China will soon surpass the U.S. in nanotechnology spending.
India, Brazil, and the Middle East are the new revenue pockets for the market participants due to growing
research and development initiatives and academic excellence. Also, easy availability of funding is a key
driving factor. For instance, in 2010, the King Abdulla University of Science and Technology (KAUST) in
Saudi Arabia announced a research grant of USD 10 million to support research in nanotechnology.
5.2.3.2 New application areas such as quantum dots and optogenetics
Quantum dots are nanocrystalline semiconductor material composed of a cadmium selenide (CdSe) core
surrounded by a zinc sulfide (ZnS) shell, capable of emitting fluorescence. They are increasingly becoming
popular as cellular probes for optical and electron microscopy as they provide better sensitivity and a
1,000 times brighter and higher resolution 3D imaging as compared to conventional fluorophore
technology. Currently, modular systems from leading companies such as Nikon, Olympus, and Carl Zeiss
support this technology.
Optogenetics is a neuromodulation technique that uses light as a stimulus to control and monitor the
activities of individual neurons in a living tissue. A recent application of optogenetics in combination with
microscopy is in research on layers of cultivated excitable cells to understand the general biology of action
potential generation, axonal signal transmission, and synaptic activities. In October 2011, the National
Institutes of Health (NIH) allocated a research grant of USD 12.5 million to the University of Pennsylvania
to support medical research in optogenetics, microscopy, and fluorescent probes for tumor detection.
46
MICROSCOPY MARKET – GLOBAL FORECAST TO 2021
© MarketsandMarkets
5.2.3.3 Integration of microscopy with spectroscopy
The integration of microscopy with spectroscopy presents wide opportunities to research communities as it
can be used for a variety of applications; for instance, it can be used to analyze nanowires in
nanotechnology, investigations of local inhomogeneity in material sciences, and cellular imaging and
tracking experiments in biological research.
In late 2013, researchers in the U.S. developed a new imaging technique by combining the spatial
resolution of scanning tunneling microscopy (STM) with vibrational information obtained from infrared (IR)
spectroscopy. This technique can simultaneously image and obtain the IR spectrum of molecules adhered
to a surface. Detection and identification of molecules on a surface and understanding their interaction
with each other and the surface is important for altering surface properties and creating new
nanostructures. Some commonly used combinations include atomic force microscopy (AFM) with Raman
spectroscopy, and scanning electron microscopy (SEM) with Raman spectroscopy.
5.2.4 CHALLENGES
5.2.4.1 Sample preparation
Tedious sample preparation is a major drawback associated with electron microscopes. Sample
preparation for electron microscopes usually consists of specimen killing, fixation, dehydration, drying,
mounting, and coating. The samples for both SEM and transmission electron microscopes undergo
complex preparation steps to withstand the hostile environment (temperature of up to 150°C and high
vacuum) inside the microscope. The preparation process kills the tissue/cell and can also cause changes
in the sample’s appearance. Further, extensive work is required to produce a sample thin enough to be
electron transparent. Thus, time-consuming sample preparation for high-end microscopes is a key
challenge.
5.2.4.2 Requirement of a high degree of technical expertise
Highly skilled personnel are required to handle advanced microscopes such as electron and SPM. The
complexity of the instrumentation affects their significant adoption, thus restraining market growth. Thus,
the dearth of skilled labor and complexity of the instrumentation may challenge growth of this market.
47
MICROSCOPY MARKET – GLOBAL FORECAST TO 2021
© MarketsandMarkets
6 MICROSCOPY MARKET, BY PRODUCT
KEY FINDINGS
 The electron microscopes segment accounted for the largest share of 39.3% of the market in
2016
 The low cost and user-friendliness of electron microscopes are key factors responsible for the
large share of this segment
 The optical microscopes segment accounted for the second-largest share of 37.8% of the
microscopy market in 2016
 The SPM segment accounted for 13.6% share of the microscopy market in 2016
 The confocal microscopes segment accounted for 9.3% share of the microscopy market in
2016
48
MICROSCOPY MARKET – GLOBAL FORECAST TO 2021
© MarketsandMarkets
6.1 INTRODUCTION
The microscopy market, by product, is segmented into optical microscopes, confocal microscopes, electron
microscopes, and SPM. The electron microscopes segment is expected to account for the largest share of
39.3% of the microscopy market in 2016. This segment is also expected to grow at the highest CAGR of
10.6% in the products market, over the forecast period.
FIGURE 17 ELECTRON MICROSCOPES SEGMENT TO ACCOUNT FOR THE LARGEST SHARE OF
THE MICROSCOPY MARKET, BY PRODUCT, IN 2016
Source: Annual Reports, Press Releases, SEC Filings, Investor Presentations, Microscopy Society of America, Canadian Cytometry and
Microscopy Association, Chinese Electron Microcopy Society, Australian Microscopy and Microanalysis Society, Journal of
Microscopy, Journal of Advanced Microscopy Research, Expert Interviews, and MarketsandMarkets Analysis
TABLE 1 GLOBAL MICROSCOPY MARKET SIZE, BY PRODUCT, 2014–2021 (USD MILLION)
Product 2014 2015 2016 2021
CAGR
(2016–2021)
Optical Microscopes 1,606.0 1,684.6 1,769.7 2,252.0 4.9%
Electron Microscopes 1,508.4 1,665.8 1,842.3 3,049.8 10.6%
SPM 573.3 604.5 638.7 826.7 5.3%
Confocal Microscopes 378.1 403.6 434.8 598.0 6.6%
Total 4,065.8 4,358.5 4,685.4 6,726.5 7.5%
Source: Annual Reports, Press Releases, SEC Filings, Investor Presentations, Microscopy Society of America, Canadian Cytometry and
Microscopy Association, Chinese Electron Microcopy Society, Australian Microscopy and Microanalysis Society, Journal of
Microscopy, Journal of Advanced Microscopy Research, Expert Interviews, and MarketsandMarkets Analysis
The electron microscopes segment is expected to register the highest CAGR of 10.6% from 2016 to 2021.
This high growth of this segment can be attributed to growing demand for electron microscopes in various
industries such as semiconductors and electronics.
Electron Microscopes Optical Microscopes
Scanning Probe
Microscopes
Confocal Microscopes
2016 1,842.3 1,769.7 638.7 434.8
2021 3,049.8 2,252.0 826.7 598.0
CAGR 10.6% 4.9% 5.3% 6.6%
0
500
1,000
1,500
2,000
2,500
3,000
3,500
MarketSize(USDMillion)
49
MICROSCOPY MARKET – GLOBAL FORECAST TO 2021
© MarketsandMarkets
6.2 ELECTRON MICROSCOPES
Electron microscopes use a beam of charged particles (electrons) and electromagnetic or electrostatic
lenses to view small objects. Electron microscopes have very high magnification power, of nearly
1,000,000x. Due to their high magnification ratio, electron microscopes have vital applications in
nanotechnology research. Growing research and development activities and the easy availability of funds
are expected to drive growth of the electron microscopes market. However, the high cost of electron
microscopes is a key factor restraining growth of this market.
The major companies operating in the electron microscopes market include FEI Co. (U.S.), Hitachi High
Technologies (Japan), and JEOL Ltd. (Japan).
FIGURE 18 SEM TO ACCOUNT FOR THE LARGEST SHARE OF THE ELECTRON MICROSCOPES
MARKET IN 2016
Source: Annual Reports, Press Releases, SEC Filings, Investor Presentations, Microscopy Society of America, Canadian Cytometry and
Microscopy Association, Chinese Electron Microcopy Society, Australian Microscopy and Microanalysis Society, Journal of
Microscopy, Journal of Advanced Microscopy Research, Expert Interviews, and MarketsandMarkets Analysis
TABLE 2 ELECTRON MICROSCOPES MARKET SIZE, BY TYPE, 2014-2021 (USD MILLION)
Type 2014 2015 2016 2021
CAGR
(2016–2021)
SEM 1,178.1 1,302.7 1,442.5 2,403.2 10.7%
Transmission Electron
Microscopes 330.3 363.1 399.8 646.6 10.1%
Total 1,508.4 1,665.8 1,842.3 3,049.8 10.6%
Source: Annual Reports, Press Releases, SEC Filings, Investor Presentations, Microscopy Society of America, Canadian Cytometry and
Microscopy Association, Chinese Electron Microcopy Society, Australian Microscopy and Microanalysis Society, Journal of
Microscopy, Journal of Advanced Microscopy Research, Expert Interviews, and MarketsandMarkets Analysis
In 2016, the SEM segment is expected to account for the largest share of 78.3% of the global electron
microscopes market. This segment is projected to reach USD 2,403.2 million by 2021 from USD 1,442.5
million in 2016, at a CAGR of 10.7% during the forecast period.
Scanning Electron Microscopes Transmission Electron Microscopes
2016 1,442.5 399.8
2021 2,403.2 646.6
CAGR 10.7% 10.1%
0
500
1,000
1,500
2,000
2,500
3,000
MarketSize(USDMillion)
50
MICROSCOPY MARKET – GLOBAL FORECAST TO 2021
© MarketsandMarkets
TABLE 3 ELECTRON MICROSCOPES MARKET SIZE, BY REGION, 2014-2021 (USD MILLION)
Region 2014 2015 2016 2021
CAGR
(2016–2021)
North America 558.1 608.4 664.1 1,027.0 9.1%
Europe 445.0 491.3 542.9 896.5 10.6%
Asia-Pacific 346.9 392.1 443.8 817.8 13.0%
RoW 158.4 174.1 191.4 308.5 10.0%
Total 1,508.4 1,665.8 1,842.3 3,049.8 10.6%
Source: Annual Reports, Press Releases, SEC Filings, Investor Presentations, Microscopy Society of America, Canadian Cytometry and
Microscopy Association, Chinese Electron Microcopy Society, Australian Microscopy and Microanalysis Society, Journal of
Microscopy, Journal of Advanced Microscopy Research, Expert Interviews, and MarketsandMarkets Analysis
North America is expected to account for the largest share of the global electron microscopes market in
2016. This segment is projected to reach USD 1,027.0 million by 2021 from USD 664.1 million in 2016, at
a CAGR of 9.1% from 2016 to 2021.
TABLE 4 NORTH AMERICA: ELECTRON MICROSCOPES MARKET SIZE, BY COUNTRY,
2014–2021 (USD MILLION)
Country 2014 2015 2016 2021
CAGR
(2016–2021)
U.S. 449.3 490.1 535.4 831.0 9.2%
Canada 108.8 118.3 128.7 195.9 8.8%
Total 558.1 608.4 664.1 1,027.0 9.1%
Source: Annual Reports, Press Releases, SEC Filings, Investor Presentations, Microscopy Society of America, Canadian Cytometry and
Microscopy Association, Chinese Electron Microcopy Society, Australian Microscopy and Microanalysis Society, Journal of
Microscopy, Journal of Advanced Microscopy Research, Expert Interviews, and MarketsandMarkets Analysis
The U.S. is expected to account for the largest share of the North American electron microscopes market in
2016. This segment is projected to reach USD 831.0 million by 2021 from USD 535.4 million in 2016, at a
CAGR of 9.2% from 2016 to 2021.
51
MICROSCOPY MARKET – GLOBAL FORECAST TO 2021
© MarketsandMarkets
TABLE 5 EUROPE: ELECTRON MICROSCOPES MARKET SIZE, BY COUNTRY/REGION,
2014–2021 (USD MILLION)
Country/Region 2014 2015 2016 2021
CAGR
(2016–2021)
Germany 118.0 134.0 152.0 285.2 13.4%
U.K. 64.7 72.7 81.8 147.6 12.5%
France 45.5 50.6 56.4 97.1 11.5%
RoE 216.9 234.0 252.7 366.6 7.7%
Total 445.0 491.3 542.9 896.5 10.6%
Source: Annual Reports, Press Releases, SEC Filings, Investor Presentations, Microscopy Society of America, Canadian Cytometry and
Microscopy Association, Chinese Electron Microcopy Society, Australian Microscopy and Microanalysis Society, Journal of
Microscopy, Journal of Advanced Microscopy Research, Expert Interviews, and MarketsandMarkets Analysis
Germany is expected to account for the largest share of the Europe electron microscopes market in 2016.
This segment is projected to reach USD 285.2 million by 2021 from USD 152.0 million in 2016, at a CAGR
of 13.4% from 2016 to 2021.
TABLE 6 ROW: ELECTRON MICROSCOPES MARKET SIZE, BY COUNTRY/REGION,
2014–2021 (USD MILLION)
Country/Region 2014 2015 2016 2021
CAGR
(2016–2021)
Brazil 66.2 73.0 80.5 131.7 10.3%
Mexico 39.9 43.3 46.9 70.3 8.4%
Argentina 15.0 16.7 18.6 31.4 11.1%
RoLA 37.2 41.1 45.4 75.1 10.6%
Total 158.4 174.1 191.4 308.5 10.0%
Source: Annual Reports, Press Releases, SEC Filings, Investor Presentations, Microscopy Society of America, Canadian Cytometry and
Microscopy Association, Chinese Electron Microcopy Society, Australian Microscopy and Microanalysis Society, Journal of
Microscopy, Journal of Advanced Microscopy Research, Expert Interviews, and MarketsandMarkets Analysis
Brazil is expected to account for the largest share of the RoW electron microscopes market in 2016. This
segment is projected to reach USD 131.7 million by 2021 from USD 80.5 million in 2016, at a CAGR of
10.3% from 2016 to 2021.
52
MICROSCOPY MARKET – GLOBAL FORECAST TO 2021
© MarketsandMarkets
6.2.1 TRANSMISSION ELECTRON MICROSCOPES (TEM)
Transmission electron microscopy uses high-voltage electron beams to create an image of the specimen.
TEMs are widely used in material science studies across the semiconductors and metallurgy industry. They
are also used in the life science industries to study the underlying fundamental cell biological processes as
well as the pathological and physiological pathways, and to perform pharmaceutical quality control tests for
new medications. The high cost of acquisition, maintenance requirements, and time-consuming sample
preparation process hinder growth of this market.
The major drawbacks of the TEM technique include extensive sample preparation, hostile environment for
the sample, and a small field of view.
TABLE 7 TRANSMISSION ELECTRON MICROSCOPES MARKET SIZE, BY REGION,
2014-2021 (USD MILLION)
Region 2014 2015 2016 2021
CAGR
(2016–2021)
North America 122.2 132.6 144.1 217.7 8.6%
Europe 97.5 107.1 117.8 190.1 10.0%
Asia-Pacific 76.0 85.5 96.3 173.4 12.5%
RoW 34.7 37.9 41.5 65.4 9.5%
Total 330.3 363.1 399.8 646.6 10.1%
Source: Annual Reports, Press Releases, SEC Filings, Investor Presentations, Microscopy Society of America, Canadian Cytometry and
Microscopy Association, Chinese Electron Microcopy Society, Australian Microscopy and Microanalysis Society, Journal of
Microscopy, Journal of Advanced Microscopy Research, Expert Interviews, and MarketsandMarkets Analysis
North America is expected to account for the largest share of the transmission electron microscopes
market in 2016. This segment is projected to reach USD 217.7 million by 2021 from USD 144.1 million in
2016, at a CAGR of 8.6% from 2016 to 2021.
TABLE 8 ROW: TRANSMISSION ELECTRON MICROSCOPES MARKET SIZE, BY COUNTRY/REGION,
2014–2021 (USD MILLION)
Country/Region 2014 2015 2016 2021
CAGR
(2016–2021)
Brazil 14.5 15.9 17.5 27.9 9.8%
Mexico 8.7 9.4 10.2 14.9 7.9%
Argentina 3.3 3.6 4.0 6.7 10.6%
RoLA 8.2 9.0 9.9 15.9 10.1%
Total 34.7 37.9 41.5 65.4 9.5%
Source: Annual Reports, Press Releases, SEC Filings, Investor Presentations, Microscopy Society of America, Canadian Cytometry and
Microscopy Association, Chinese Electron Microcopy Society, Australian Microscopy and Microanalysis Society, Journal of
Microscopy, Journal of Advanced Microscopy Research, Expert Interviews, and MarketsandMarkets Analysis
Brazil is expected to account for the largest share of the RoW transmission electron microscopes market in
2016. This segment is projected to reach USD 27.9 million by 2021 from USD 17.5 million in 2016, at a
CAGR of 9.8% from 2016 to 2021.
53
MICROSCOPY MARKET – GLOBAL FORECAST TO 2021
© MarketsandMarkets
6.2.2 SCANNING ELECTRON MICROSCOPES (SEM)
A Scanning Electron Microscope (SEM) produces images of an object by scanning it with a focused beam of
electrons. SEMs are primarily used for qualitative analysis of size, shape, morphology, porosity, size
distribution, and consistency of sample. These characteristics have vital applications in the life sciences
sector for the analysis and quality control of powdered dosage forms for assessment of crystalline
structure, dissolution behavior, and bioavailability of drug molecules. Technological advancements in the
SEM market focus on the development of advanced microscopy systems with specialized sample-handling
capabilities to enable the analysis of living cells through non-destructive microscopy.
The market for SEM instruments is expected to be driven by increasing demand for customized solutions
and integrated systems to satisfy the specific needs of research organizations, which are major end users
of the microscopy market.
TABLE 9 SEM MARKET SIZE, BY REGION, 2014-2021 (USD MILLION)
Region 2014 2015 2016 2021
CAGR
(2016–2021)
North America 435.9 475.7 520.0 809.2 9.2%
Europe 347.5 384.2 425.1 706.5 10.7%
Asia-Pacific 271.0 306.7 347.5 644.4 13.1%
RoW 123.7 136.1 149.9 243.1 10.2%
Total 1,178.1 1,302.7 1,442.5 2,403.2 10.7%
Source: Annual Reports, Press Releases, SEC Filings, Investor Presentations, Microscopy Society of America, Canadian Cytometry and
Microscopy Association, Chinese Electron Microcopy Society, Australian Microscopy and Microanalysis Society, Journal of
Microscopy, Journal of Advanced Microscopy Research, Expert Interviews, and MarketsandMarkets Analysis
North America is expected to account for the largest share of the SEM market in 2016. This segment is
projected to reach USD 809.2 million by 2021 from USD 520.0 million in 2016, at a CAGR of 9.2% from
2016 to 2021.
TABLE 10 ROW: SEM MARKET SIZE, BY COUNTRY/REGION, 2014-2021 (USD MILLION)
Country/Region 2014 2015 2016 2021
CAGR
(2016–2021)
Brazil 51.7 57.1 63.0 103.7 10.5%
Mexico 31.2 33.8 36.7 55.4 8.6%
Argentina 11.8 13.1 14.5 24.8 11.3%
RoLA 29.1 32.2 35.6 59.2 10.7%
Total 123.7 136.1 149.9 243.1 10.2%
Source: Annual Reports, Press Releases, SEC Filings, Investor Presentations, Microscopy Society of America, Canadian Cytometry and
Microscopy Association, Chinese Electron Microcopy Society, Australian Microscopy and Microanalysis Society, Journal of
Microscopy, Journal of Advanced Microscopy Research, Expert Interviews, and MarketsandMarkets Analysis
Brazil is expected to account for the largest share of the RoW SEM market in 2016. This segment is
projected to reach USD 103.7 million by 2021 from USD 63.0 million in 2016, at a CAGR of 10.5% from
2016 to 2021.
54
MICROSCOPY MARKET – GLOBAL FORECAST TO 2021
© MarketsandMarkets
6.3 OPTICAL MICROSCOPES
Optical microscopes, also called light microscopes, use visible light along with a system of lenses to
provide enlarged images of small samples such as cells, molecules, and microorganisms. The
magnification power of these microscopes is up to 1,000x. Continuous improvements in electronics and
technology, including the incorporation of a digital camera that enhances image quality, have further
improved the magnifying power of optical microscopes.
Optical microscopes are less expensive as compared to advanced microscopes, and thus hold the highest
share in the overall market. Due to the presence of a large number of companies, pricing is used as a tool
to maintain product differentiation in the optical microscopes market. Their low cost, ease of use, and low
maintenance costs are major drivers for this segment. These microscopes make direct imaging possible
without any sample pre-treatment. They are also used in real-color imaging. Optical microscopes are widely
used in academic institutions and in small-scale research institutes and pathology laboratories. Low
resolution is the major drawback of optical microscopes.
Optical microscopes find application in medical diagnosis (histopathology), microelectronics, nanophysics,
biotechnology, pharmaceutical research, mineralogy, and microbiology.
Carl Zeiss (Germany), Leica Microsystems (Germany), Nikon (Japan), and Olympus Corporation (Japan) are
some major companies operating in this market.
FIGURE 19 FLUORESCENCE MICROSCOPES TO DOMINATE THE OPTICAL MICROSCOPES
MARKET DURING THE FORECAST PERIOD
Source: Annual Reports, Press Releases, SEC Filings, Investor Presentations, Microscopy Society of America, Canadian Cytometry and
Microscopy Association, Chinese Electron Microcopy Society, Australian Microscopy and Microanalysis Society, Journal of
Microscopy, Journal of Advanced Microscopy Research, Expert Interviews, and MarketsandMarkets Analysis
Fluorescence Microscopes Super-resolution Microscopes
2016 1,262.3 507.4
2021 1,413.2 838.9
CAGR 2.3% 10.6%
0
200
400
600
800
1,000
1,200
1,400
1,600
MarketSize(USDMillion)
55
MICROSCOPY MARKET – GLOBAL FORECAST TO 2021
© MarketsandMarkets
TABLE 11 OPTICAL MICROSCOPES MARKET SIZE, BY TYPE, 2014-2021 (USD MILLION)
Type 2014 2015 2016 2021
CAGR
(2016–2021)
Fluorescence Microscopes 1,196.5 1,227.2 1,262.3 1,413.2 2.3%
Super-resolution Microscopes 409.5 457.4 507.4 838.9 10.6%
Total 1,606.0 1,684.6 1,769.7 2,252.0 4.9%
Source: Annual Reports, Press Releases, SEC Filings, Investor Presentations, Microscopy Society of America, Canadian Cytometry and
Microscopy Association, Chinese Electron Microcopy Society, Australian Microscopy and Microanalysis Society, Journal of
Microscopy, Journal of Advanced Microscopy Research, Expert Interviews, and MarketsandMarkets Analysis
In 2016, the fluorescence microscopes segment is expected to account for the larger share of 71.3% of
the global optical microscopes market. This segment is projected to reach USD 1,413.2 million by 2021
from USD 1,262.3 million in 2016, at a CAGR of 2.3% during the forecast period.
FIGURE 20 ASIA-PACIFIC TO WITNESS HIGHEST GROWTH IN THE OPTICAL MICROSCOPES
MARKET DURING THE FORECAST PERIOD
Source: Annual Reports, Press Releases, SEC Filings, Investor Presentations, Microscopy Society of America, Canadian Cytometry and
Microscopy Association, Chinese Electron Microcopy Society, Australian Microscopy and Microanalysis Society, Journal of
Microscopy, Journal of Advanced Microscopy Research, Expert Interviews, and MarketsandMarkets Analysis
North America Europe Asia-Pacific RoW
2016 638.0 521.5 426.3 183.9
2021 758.3 662.0 603.8 227.8
CAGR 3.5% 4.9% 7.2% 4.4%
0
100
200
300
400
500
600
700
800
MarketSize(USDMillion)
56
MICROSCOPY MARKET – GLOBAL FORECAST TO 2021
© MarketsandMarkets
TABLE 12 OPTICAL MICROSCOPES MARKET SIZE, BY REGION, 2014-2021 (USD MILLION)
Region 2014 2015 2016 2021
CAGR
(2016–2021)
North America 594.2 615.2 638.0 758.3 3.5%
Europe 473.8 496.8 521.5 662.0 4.9%
Asia-Pacific 369.4 396.5 426.3 603.8 7.2%
RoW 168.6 176.0 183.9 227.8 4.4%
Total 1,606.0 1,684.6 1,769.7 2,252.0 4.9%
Source: Annual Reports, Press Releases, SEC Filings, Investor Presentations, Microscopy Society of America, Canadian Cytometry and
Microscopy Association, Chinese Electron Microcopy Society, Australian Microscopy and Microanalysis Society, Journal of
Microscopy, Journal of Advanced Microscopy Research, Expert Interviews, and MarketsandMarkets Analysis
North America is expected to account for the largest share of the global optical microscopes market in
2016. This regional segment is projected to reach USD 758.3 million by 2021 from USD 638.0 million in
2016, at a CAGR of 3.5% from 2016 to 2021.
TABLE 13 NORTH AMERICA: OPTICAL MICROSCOPES MARKET SIZE, BY COUNTRY,
2014–2021 (USD MILLION)
Country 2014 2015 2016 2021
CAGR
(2016–2021)
U.S. 478.3 495.6 514.3 613.7 3.6%
Canada 115.9 119.6 123.6 144.7 3.2%
Total 594.2 615.2 638.0 758.3 3.5%
Source: Annual Reports, Press Releases, SEC Filings, Investor Presentations, Microscopy Society of America, Canadian Cytometry and
Microscopy Association, Chinese Electron Microcopy Society, Australian Microscopy and Microanalysis Society, Journal of
Microscopy, Journal of Advanced Microscopy Research, Expert Interviews, and MarketsandMarkets Analysis
The U.S. is expected to account for the larger share of the North American optical microscopes market in
2016. This segment is projected to reach USD 613.7 million by 2021 from USD 514.3 million in 2016, at a
CAGR of 3.6% from 2016 to 2021.
57
MICROSCOPY MARKET – GLOBAL FORECAST TO 2021
© MarketsandMarkets
TABLE 14 EUROPE: OPTICAL MICROSCOPES MARKET SIZE, BY COUNTRY/REGION,
2014–2021 (USD MILLION)
Country/Region 2014 2015 2016 2021
CAGR
(2016–2021)
Germany 125.6 135.5 146.0 210.6 7.6%
U.K. 68.8 73.5 78.6 109.0 6.8%
France 48.4 51.1 54.1 71.7 5.8%
RoE 230.9 236.6 242.8 270.7 2.2%
Total 473.8 496.8 521.5 662.0 4.9%
Source: Annual Reports, Press Releases, SEC Filings, Investor Presentations, Microscopy Society of America, Canadian Cytometry and
Microscopy Association, Chinese Electron Microcopy Society, Australian Microscopy and Microanalysis Society, Journal of
Microscopy, Journal of Advanced Microscopy Research, Expert Interviews, and MarketsandMarkets Analysis
Germany is expected to account for the largest share of the European optical microscopes market in 2016.
This regional segment is projected to reach USD 210.6 million by 2021 from USD 146.0 million in 2016, at
the highest CAGR of 7.6% from 2016 to 2021.
TABLE 15 ROW: OPTICAL MICROSCOPES MARKET SIZE, BY COUNTRY/REGION,
2014–2021 (USD MILLION)
Country/Region 2014 2015 2016 2021
CAGR
(2016–2021)
Brazil 70.5 73.8 77.3 97.2 4.7%
Mexico 42.5 43.7 45.1 51.9 2.9%
Argentina 16.0 16.9 17.8 23.2 5.4%
RoLA 39.6 41.6 43.7 55.5 4.9%
Total 168.6 176.0 183.9 227.8 4.4%
Source: Annual Reports, Press Releases, SEC Filings, Investor Presentations, Microscopy Society of America, Canadian Cytometry and
Microscopy Association, Chinese Electron Microcopy Society, Australian Microscopy and Microanalysis Society, Journal of
Microscopy, Journal of Advanced Microscopy Research, Expert Interviews, and MarketsandMarkets Analysis
Brazil is expected to account for the largest share of the RoW optical microscopes market in 2016. The
country is projected to reach USD 97.2 million by 2021 from USD 77.3 million in 2016, at a CAGR of 4.7%
from 2016 to 2021.
58
MICROSCOPY MARKET – GLOBAL FORECAST TO 2021
© MarketsandMarkets
6.3.1 FLUORESCENCE MICROSCOPES
Fluorescence microscopes are a type of optical microscopes that utilize fluorophore molecules for imaging.
Applications of this product segment are rapidly expanding in medical and biological research owing to
significant advances in technology that have enabled single- and multicolor-fluorescence microscopy.
Fluorescence microscopy also has immense applications in life sciences, such as nerve specimen analysis,
DNA & chromosomal studies, and routine diagnosis of infections such as Herpes Zoster or Chlamydia. It is
also used in research related to nanostructures and cancer cells. Advances in fluorescent microscopy such
as total internal reflection fluorescence microscopes (TIRF), fluorescence recovery after photobleaching
(FRAP), and fluorescence-lifetime imaging microscopy (FLIM), are used as upgradation tools by market
participants for their existing line of microscopes. However, tedious sample preparation and
photobleaching processes are the major limitations of fluorescence microscopy.
TABLE 16 FLUORESCENCE MICROSCOPES MARKET SIZE, BY REGION, 2014–2021 (USD MILLION)
Region 2014 2015 2016 2021
CAGR
(2016–2021)
North America 442.7 448.2 455.1 475.9 0.9%
Europe 353.0 361.9 372.0 415.4 2.2%
Asia-Pacific 275.2 288.9 304.1 378.9 4.5%
RoW 125.6 128.2 131.2 143.0 1.7%
Total 1,196.5 1,227.2 1,262.3 1,413.2 2.3%
Source: Annual Reports, Press Releases, SEC Filings, Investor Presentations, Microscopy Society of America, Canadian Cytometry and
Microscopy Association, Chinese Electron Microcopy Society, Australian Microscopy and Microanalysis Society, Journal of
Microscopy, Journal of Advanced Microscopy Research, Expert Interviews, and MarketsandMarkets Analysis
North America is expected to account for the largest share of the fluorescence microscopes market in
2016. This region is projected to reach USD 475.9 million by 2021 from USD 455.1 million in 2016, at a
CAGR of 0.9% from 2016 to 2021.
TABLE 17 ROW: FLUORESCENCE MICROSCOPES MARKET SIZE, BY COUNTRY/REGION,
2014–2021 (USD MILLION)
Country/Region 2014 2015 2016 2021
CAGR
(2016–2021)
Brazil 52.5 53.8 55.2 61.0 2.0%
Mexico 31.7 31.9 32.1 32.6 0.3%
Argentina 11.9 12.3 12.7 14.6 2.7%
RoLA 29.5 30.3 31.1 34.8 2.3%
Total 125.6 128.2 131.2 143.0 1.7%
Source: Annual Reports, Press Releases, SEC Filings, Investor Presentations, Microscopy Society of America, Canadian Cytometry and
Microscopy Association, Chinese Electron Microcopy Society, Australian Microscopy and Microanalysis Society, Journal of
Microscopy, Journal of Advanced Microscopy Research, Expert Interviews, and MarketsandMarkets Analysis
Brazil is expected to account for the largest share of the RoW fluorescence microscopes market in 2016.
This segment is projected to reach USD 61.0 million by 2021 from USD 55.2 million in 2016, at a CAGR of
2.0% from 2016 to 2021.
59
MICROSCOPY MARKET – GLOBAL FORECAST TO 2021
© MarketsandMarkets
6.3.1.1 Total Internal Reflection Fluorescence Microscopy (TIRF)
TIRF is used to observe very thin regions of specimens or observe single-molecule fluorescence at surfaces
and interfaces. This technique has immense applications in cell/molecular biology and neurology, as it an
effective way to view single-molecule interactions. The technique offers high sensitivity and high contrast
visualization of single molecules. Ongoing technology advancements, such as genetically-encoded
flurophore molecules, are driving the use of TIRF.
6.3.1.2 Fluorescence Resonance Energy Transfer (FRET)
FRET is a distance-dependent technique used to visualize interaction between molecules within several
nanometers. It provides accurate locations and analysis on intercellular/intermolecular interactions owing
to improved resolution. Factors such as advancements in pulsed lasers, innovative computer imaging
technologies, discovery of new classes of fluorescent materials, and flurophore labeling techniques are
driving the use of FRET. For example, the advent of fluorescent indicators has allowed the measurement of
calcium in cell organelles. FRET is used to study cellular/molecular interactions, calcium metabolism,
enzyme activity, DNA/RNA conformation, and gene expression.
6.3.1.3 Fluorescence Recovery After Photo -Bleaching (FRAP)
FRAP is a fluorescence microscopy technique that facilitates improved visualization of real-time mobility of
molecules. The technique offers high-speed image acquisition that enables the study of protein binding,
mobility of membrane receptors, and cell membrane diffusion. Recent technical advances driving the use
of FRAP include the development of photo-switchable molecules.
6.3.1.4 Fluorescence Lifetime Imaging Microscopy (FLIM)
FLIM is an imaging technique based on differences in the exponential decay rate of fluorescence from a
fluorescent sample. With this technique, it is possible to obtain information on molecules inside a living
cell. The technique is particularly useful if a sample has several thick layers. The technology has huge
applications in fluorescence in situ hybridization and cancer studies to detect the presence of tumors in
cells. It is used as an imaging technique in confocal microscopy.
6.3.2 SUPER-RESOLUTION MICROSCOPES
This type of optical microscopes capture images with higher resolution than the diffraction limit of light.
There are two types of super-resolution microscopy—deterministic and stochastic. Super-resolution
microscopy is widely used across various domains, including cell biology, molecular biology, electronics and
semiconductors, and material research.
Technological advancements, growing focus on nanotechnology, and rising demand for picture archiving
and higher resolution are the major factors expected to drive growth of super-resolution microscopes in the
near future. This segment is estimated to grow at a CAGR of 10.6% from 2016 to 2021.
The major companies in the super-resolution microscopes market include Carl Zeiss (Germany), Nikon
(Japan), and Leica Microsystems (Germany).
60
MICROSCOPY MARKET – GLOBAL FORECAST TO 2021
© MarketsandMarkets
6.3.2.1 Stochastic Optical Reconstruction Microscopy (STORM)
STORM works on the principle of stochastic switching of a single-molecule fluorescence signal to capture
an image. STORM is a noninvasive, easy-to-use technique that provides high image depth. Furthermore, it
does not require the use of high-intensity laser techniques as they increase the complexity of the
procedure and can also damage the sample. STORM is a useful technique for high-resolution live cell
imaging with the possibility of endogenous labeling.
This technology was first adapted by Nikon in 2009. The product, N-STORM, was developed with
technology licensed from Harvard University, U.S. The resolution provided by N-STORM is ten times higher
than conventional optical microscopes. Moreover, N-STORM offers both 2D images and high-resolution
florescence 3D images of specimens.
6.3.2.2 Structured Illumination Microscopy (SIM)
In structured illumination microscopy (SIM), the sample is illuminated with a grid pattern of light, which
increases resolution. This technology was first adapted by Nikon in 2009 by signing an agreement with the
University of California’s San Francisco Office of Technology Management for Structural Illumination
Microscopy. The product was named N-SIM. It can provide resolution of up to 85 nm in multiple colors. In
addition, it can continuously capture super-resolution images at temporal resolutions of 0.6 sec/frame,
enabling the study of dynamic interactions in living cells. The technology can capture 2D images at high
speed with incredible contrast. TIRF with SIM facilitates greater understanding of molecular interactions at
the cellular level. Companies such as Carl Zeiss and Applied Precision are using this technology with their
products to increase their applications in the life sciences segment. Carl Zeiss has also developed a
product named OptiGrid using SIM technology.
6.3.2.3 Stimulated Emission Depletion Microscopy (STED)
STED was developed by Stefan W. Hell and Jan Wichmann in 1994. Leica Microsystems holds the patent
for STED, and its STED microscope module, the Leica TCS SP8 STED 3X, integrates the super-resolution
techniques of STED with a confocal microscope, providing spatial resolution of 50-70 nm. This system is
ideal for multi-user imaging facilities and is used in neuroscience and cell biology research.
6.3.2.4 Coherent Anti-Strokes Raman Scattering Microscopy (CARS)
CARS allows the imaging of living cells with intrinsic chemical contrast. It is a dye-free method. The crucial
advantage of this method is that the sample remains almost unaffected. It does not require labeling but
uses the spectroscopic properties of various chemical species found in organic material.
This technology was developed at the Harvard University. Leica Microsystems signed an agreement with
the Harvard University’s Office of Technological Development (OTD) to develop CARS microscopy as an
extension of confocal microscopes.
6.3.2.5 Photo-Activated Localization Microscopy (PALM)
PALM is a type of single-molecule super-resolution microscopy widely used to study dynamic events and
the fine structural details of cellular architecture such as the intracytoplasmic transport of vesicles,
cytoskeletal structures, mechanisms of tissue remodeling, and the migration of cancer cells in a diseased
organism. The discovery of novel labeling probes and growing demand for image acquisition and live cell
imaging are driving the use of PALM techniques. Carl Zeiss licensed PALM technology in 2007.
6.3.2.6 Reversible Saturable Optical Fluorescence Transitions (RESOLFT)
RESOLFT microscopy is an optical microscope with a very high resolution limit. Leica Microsystems has
licensed general RESOLFT technologies.
61
MICROSCOPY MARKET – GLOBAL FORECAST TO 2021
© MarketsandMarkets
TABLE 18 SUPER-RESOLUTION MICROSCOPES MARKET SIZE, BY REGION,
2014–2021 (USD MILLION)
Region 2014 2015 2016 2021
CAGR
(2016–2021)
North America 151.5 167.0 182.9 282.5 9.1%
Europe 120.8 134.9 149.5 246.6 10.5%
Asia-Pacific 94.2 107.7 122.2 224.9 13.0%
RoW 43.0 47.8 52.7 84.9 10.0%
Total 409.5 457.4 507.4 838.9 10.6%
Source: Annual Reports, Press Releases, SEC Filings, Investor Presentations, Microscopy Society of America, Canadian Cytometry and
Microscopy Association, Chinese Electron Microcopy Society, Australian Microscopy and Microanalysis Society, Journal of
Microscopy, Journal of Advanced Microscopy Research, Expert Interviews, and MarketsandMarkets Analysis
North America is expected to account for the largest share of the super-resolution microscopes market in
2016. This segment is projected to reach USD 282.5 million by 2021 from USD 182.9 million in 2016, at a
CAGR of 9.1% from 2016 to 2021.
TABLE 19 ROW: SUPER-RESOLUTION MICROSCOPES MARKET SIZE, BY COUNTRY/REGION,
2014–2021 (USD MILLION)
Country/Region 2014 2015 2016 2021
CAGR
(2016–2021)
Brazil 18.0 20.0 22.2 36.2 10.3%
Mexico 10.8 11.9 12.9 19.3 8.4%
Argentina 4.1 4.6 5.1 8.6 11.1%
RoLA 10.1 11.3 12.5 20.7 10.6%
Total 43.0 47.8 52.7 84.9 10.0%
Source: Annual Reports, Press Releases, SEC Filings, Investor Presentations, Microscopy Society of America, Canadian Cytometry and
Microscopy Association, Chinese Electron Microcopy Society, Australian Microscopy and Microanalysis Society, Journal of
Microscopy, Journal of Advanced Microscopy Research, Expert Interviews, and MarketsandMarkets Analysis
Brazil is expected to account for the largest share of the RoW super-resolution microscopes market in
2016. The country is projected to reach USD 36.2 million by 2021 from USD 22.2 million in 2016, at a
CAGR of 10.3% from 2016 to 2021.
62
MICROSCOPY MARKET – GLOBAL FORECAST TO 2021
© MarketsandMarkets
6.4 CONFOCAL MICROSCOPES
Confocal microscopes work on the principle of point-by-point illumination of samples and rejection of out-
of-focus light. In order to avoid noisy pictures, one needs to ensure illumination of the sample for longer
durations with a high-intensity light source so that there are enough photons collected from the sample.
Modern confocal microscopy methods use laser lights instead of zirconium arc lamps. Since these
microscopes illuminate the specimen axially, there is no optical aberration, and a high-resolution 3D image
is created. The technology also facilitates in-depth selectivity or optical sectioning of objects in the
specimen, that is, focus on an image at a selected depth.
Research and development facilities across large universities and specialized research laboratories form
the major end users for these microscopes. Increasing demand for technologically-advanced devices is a
major driver of innovation in this market. However, confocal microscopes are high priced—between USD
100,000 and USD 600,000—which restraints market growth. The high price has resulted in the
dependence of universities and research institutions on federal funds for purchasing these devices.
The primary application area for confocal microscopy is cell biology, but life science is another area of
significance. Efforts are also being made to explore the applications of confocal microscopes in material
sciences.
FIGURE 21 APAC TO WITNESS HIGHEST GROWTH IN THE CONFOCAL MICROSCOPES MARKET
DURING THE FORECAST PERIOD
Source: Annual Reports, Press Releases, SEC Filings, Investor Presentations, Microscopy Society of America, Canadian Cytometry and
Microscopy Association, Chinese Electron Microcopy Society, Australian Microscopy and Microanalysis Society, Journal of
Microscopy, Journal of Advanced Microscopy Research, Expert Interviews, and MarketsandMarkets Analysis
North America Europe Asia-Pacific RoW
2016 156.7 128.1 104.7 45.2
2021 201.4 175.8 160.3 60.5
CAGR 5.1% 6.5% 8.8% 6.0%
0
50
100
150
200
250
MarketSize(USDMillion)
63
MICROSCOPY MARKET – GLOBAL FORECAST TO 2021
© MarketsandMarkets
TABLE 20 CONFOCAL MICROSCOPES MARKET SIZE, BY REGION, 2014-2021 (USD MILLION)
Region 2014 2015 2016 2021
CAGR
(2016–2021)
North America 139.9 147.4 156.7 201.4 5.1%
Europe 111.5 119.0 128.1 175.8 6.5%
Asia-Pacific 87.0 95.0 104.7 160.3 8.9%
RoW 39.7 42.2 45.2 60.5 6.0%
Total 378.1 403.6 434.8 598.0 6.6%
Source: Annual Reports, Press Releases, SEC Filings, Investor Presentations, Microscopy Society of America, Canadian Cytometry and
Microscopy Association, Chinese Electron Microcopy Society, Australian Microscopy and Microanalysis Society, Journal of
Microscopy, Journal of Advanced Microscopy Research, Expert Interviews, and MarketsandMarkets Analysis
North America is expected to account for the largest share of the global confocal microscopes market in
2014. This regional segment is projected to reach USD 201.4 million by 2021 from USD 156.7 million in
2016, at a CAGR of 5.1% from 2016 to 2021.
TABLE 21 NORTH AMERICA: CONFOCAL MICROSCOPES MARKET SIZE, BY COUNTRY,
2014–2021 (USD MILLION)
Country 2014 2015 2016 2021
CAGR
(2016–2021)
U.S. 112.6 118.7 126.4 162.9 5.2%
Canada 27.3 28.7 30.4 38.4 4.8%
Total 139.9 147.4 156.7 201.4 5.1%
Source: Annual Reports, Press Releases, SEC Filings, Investor Presentations, Microscopy Society of America, Canadian Cytometry and
Microscopy Association, Chinese Electron Microcopy Society, Australian Microscopy and Microanalysis Society, Journal of
Microscopy, Journal of Advanced Microscopy Research, Expert Interviews, and MarketsandMarkets Analysis
The U.S. is expected to account for the larger share of the North American confocal microscopes market in
2016. This country segment is projected to reach USD 162.9 million by 2021 from USD 126.4 million in
2016, at a higher CAGR of 5.2% from 2016 to 2021.
64
MICROSCOPY MARKET – GLOBAL FORECAST TO 2021
© MarketsandMarkets
TABLE 22 EUROPE: CONFOCAL MICROSCOPES MARKET SIZE, BY COUNTRY/REGION,
2014–2021 (USD MILLION)
Country/Region 2014 2015 2016 2021
CAGR
(2016–2021)
Germany 29.6 32.5 35.9 55.9 9.3%
U.K. 16.2 17.6 19.3 28.9 8.4%
France 11.4 12.2 13.3 19.0 7.4%
RoE 54.4 56.7 59.6 71.9 3.8%
Total 111.5 119.0 128.1 175.8 6.5%
Source: Annual Reports, Press Releases, SEC Filings, Investor Presentations, Microscopy Society of America, Canadian Cytometry and
Microscopy Association, Chinese Electron Microcopy Society, Australian Microscopy and Microanalysis Society, Journal of
Microscopy, Journal of Advanced Microscopy Research, Expert Interviews, and MarketsandMarkets Analysis
Germany is expected to account for the largest share of the European confocal microscopes market in
2016. This country segment is projected to reach USD 55.9 million by 2021 from USD 35.9 million in
2016, at the highest CAGR of 9.3% from 2016 to 2021.
TABLE 23 ROW: CONFOCAL MICROSCOPES MARKET SIZE, BY COUNTRY/REGION,
2014–2021 (USD MILLION)
Country/Region 2014 2015 2016 2021
CAGR
(2016–2021)
Brazil 16.6 17.7 19.0 25.8 6.3%
Mexico 10.0 10.5 11.1 13.8 4.5%
Argentina 3.8 4.0 4.4 6.2 7.1%
RoLA 9.3 10.0 10.7 14.7 6.6%
Total 39.7 42.2 45.2 60.5 6.0%
Source: Annual Reports, Press Releases, SEC Filings, Investor Presentations, Microscopy Society of America, Canadian Cytometry and
Microscopy Association, Chinese Electron Microcopy Society, Australian Microscopy and Microanalysis Society, Journal of
Microscopy, Journal of Advanced Microscopy Research, Expert Interviews, and MarketsandMarkets Analysis
Brazil is expected to account for the largest share of the RoW confocal microscopes market in 2016. This
country segment is projected to reach USD 25.8 million by 2021 from USD 19.0 million in 2016, at a CAGR
of 6.3% from 2016 to 2021.
6.4.1 MULTI-PHOTON CONFOCAL MICROSCOPES
A multiphoton confocal microscope uses laser beams to focus light at a particular point within the sample.
With the assistance of motorized mirrors, the laser beam is shifted across the sample, which allows the
creation of broader focal planes to form a 3D image. As opposed to single-photon microscopy, this method
uses lower energy photons, which enables the imaging of live samples with minimum destruction. Owing to
these characteristics, multiphoton microscopes have found wider applications in life sciences research.
Academic research institutions and pharmaceutical and biotechnology companies form a major end-user
segment for multi-photon confocal microscopy instruments. Due to the specialized licensing for these
instruments, Carl Zeiss and Leica Microsystems are the only two companies that produce end-to-end
multiphoton microscopy instruments. Carl Zeiss, which entered this market with the acquisition of Bio-Rad
in 2004, holds the greater share of the market.
65
MICROSCOPY MARKET – GLOBAL FORECAST TO 2021
© MarketsandMarkets
6.4.2 SPINNING DISK CONFOCAL MICROSCOPES
The market for confocal laser scanning microscopy has been severely restrained by the low speed of image
creation and the limitations of single-beam scanning movements. These limitations were overcome by the
incorporation of a spinning disk (or Nipkow’s disk) in a confocal laser scanning microscope. Spinning disk
confocal microscopes work on the principle of multiphoton multi-point scanning microscopy (MMM). This
enables high-speed in vivo and in vitro imaging and quantitative analysis of live specimens. This type of
microscopy is also called tandem scanning microscopy.
During the course of development, several manufacturers developed multiple pinhole choices and more
than one slit size, as opposed to the earlier method of using a single pinhole size. This has improved
resolution of the images. Nikon was the pioneer in this technology, and came up with its product Swept
Field Confocal (SFC) in 2004, which has four different pinhole choices and two slit sizes. Carl Zeiss (Cell
Observer SD), Leica (SD 6000), Olympus (Spinning Disk Confocal), and Nikon (Swept Field Confocal) are
other major companies in the spinning disk confocal microscopes market. Other than these, Andor
Technology has a significant market share with three products in this market— the Revolution 488
microscopy system, Revolution DSD, and Revolution XD microscopy system.
6.5 SCANNING PROBE MICROSCOPES (SPM)
Scanning probe microscopy is an advanced method that uses physical probes to scan the specimen and
produce an image. The image resolution is independent of the diffraction characteristic of light, depending
instead on the size of the probe that can be reduced to the range of picometers, which helps improve
image quality. As an additional feature, the scanning probe can be used to modify samples and create
small structures of specimens. However, the small-sized image produced, slow rate of image acquisition,
and inability to determine the required shape of the probe are some major limitations of this technique.
The market for SPM is segmented into scanning tunneling microscopy, atomic force microscopy, and near-
field scanning microscopy. The overall market for SPM instruments is driven by high growth in the AFM
segment. These instruments are low priced as compared to electron microscopes but have similar
application areas. Thus, the higher uptake of SPM by mid-sized and large universities and research
organizations is expected to drive the market for SPM during the forecast period.
Bruker Optics (U.S.), Agilent Technologies (U.S.), Asylum Research (U.S.), NT-MDT (Russia), Nanosurf
(Switzerland), and JEOL Ltd. (Japan) are some major companies in this market.
66
MICROSCOPY MARKET – GLOBAL FORECAST TO 2021
© MarketsandMarkets
FIGURE 22 STM SEGMENT TO DOMINATE THE SPM MARKET
Source: Annual Reports, Press Releases, SEC Filings, Investor Presentations, Microscopy Society of America, Canadian Cytometry and
Microscopy Association, Chinese Electron Microcopy Society, Australian Microscopy and Microanalysis Society, Journal of
Microscopy, Journal of Advanced Microscopy Research, Expert Interviews, and MarketsandMarkets Analysis
TABLE 24 SPM MARKET SIZE, BY TYPE, 2014-2021 (USD MILLION)
Type 2014 2015 2016 2021
CAGR
(2016–2021)
STM 394.8 416.2 439.8 568.8 5.3%
AFM 150.7 158.9 167.9 217.7 5.3%
Near-field Scanning Microscopes 27.8 29.4 30.9 40.2 5.4%
Total 573.3 604.5 638.7 826.7 5.3%
Source: Annual Reports, Press Releases, SEC Filings, Investor Presentations, Microscopy Society of America, Canadian Cytometry and
Microscopy Association, Chinese Electron Microcopy Society, Australian Microscopy and Microanalysis Society, Journal of
Microscopy, Journal of Advanced Microscopy Research, Expert Interviews, and MarketsandMarkets Analysis
In 2016, the STM segment is expected to account for a 68.9% share of the global SPM market. This
segment is projected to reach USD 568.8 million by 2021 from USD 439.8 million in 2016, at a CAGR of
5.3% during the forecast period.
Scanning Tunneling
Microscopes
Atomic Force Microscopes
Near-field Scanning
Microcsopes
2016 439.8 167.9 30.9
2021 568.8 217.7 40.2
CAGR 5.2% 5.3% 5.3%
0
100
200
300
400
500
600
MarketSize(USDMillion)
67
MICROSCOPY MARKET – GLOBAL FORECAST TO 2021
© MarketsandMarkets
TABLE 25 SPM MARKET SIZE, BY REGION, 2014-2021 (USD MILLION)
Region 2014 2015 2016 2021
CAGR
(2016–2021)
North America 212.1 220.8 230.2 278.4 3.9%
Europe 169.1 178.3 188.2 243.0 5.2%
Asia-Pacific 131.9 142.3 153.9 221.7 7.6%
RoW 60.2 63.2 66.4 83.6 4.7%
Total 573.3 604.5 638.7 826.7 5.3%
Source: Annual Reports, Press Releases, SEC Filings, Investor Presentations, Microscopy Society of America, Canadian Cytometry and
Microscopy Association, Chinese Electron Microcopy Society, Australian Microscopy and Microanalysis Society, Journal of
Microscopy, Journal of Advanced Microscopy Research, Expert Interviews, and MarketsandMarkets Analysis
North America is expected to account for the largest share of the global SPM market in 2016. This regional
segment is projected to reach USD 278.4 million by 2019 from USD 230.2 million in 2016, at a CAGR of
3.9% from 2016 to 2021.
TABLE 26 NORTH AMERICA: SPM MARKET SIZE, BY COUNTRY, 2014–2021 (USD MILLION)
Country 2014 2015 2016 2021
CAGR
(2016–2021)
U.S. 170.8 177.9 185.6 225.3 3.9%
Canada 41.4 42.9 44.6 53.1 3.5%
Total 212.1 220.8 230.2 278.4 3.9%
Source: Annual Reports, Press Releases, SEC Filings, Investor Presentations, Microscopy Society of America, Canadian Cytometry and
Microscopy Association, Chinese Electron Microcopy Society, Australian Microscopy and Microanalysis Society, Journal of
Microscopy, Journal of Advanced Microscopy Research, Expert Interviews, and MarketsandMarkets Analysis
The U.S. is expected to account for the larger share of the North American SPM market in 2016. This
country segment is projected to reach USD 225.3 million by 2021 from USD 185.6 million in 2016, at a
CAGR of 3.9% during the forecast period.
TABLE 27 EUROPE: SPM MARKET SIZE, BY COUNTRY/REGION, 2014–2021 (USD MILLION)
Country/Region 2014 2015 2016 2021
CAGR
(2016–2021)
Germany 44.8 48.6 52.7 77.3 8.0%
U.K. 24.6 26.4 28.4 40.0 7.1%
France 17.3 18.3 19.5 26.3 6.1%
RoE 82.4 84.9 87.6 99.4 2.6%
Total 169.1 178.3 188.2 243.0 5.2%
Source: Annual Reports, Press Releases, SEC Filings, Investor Presentations, Microscopy Society of America, Canadian Cytometry and
Microscopy Association, Chinese Electron Microcopy Society, Australian Microscopy and Microanalysis Society, Journal of
Microscopy, Journal of Advanced Microscopy Research, Expert Interviews, and MarketsandMarkets Analysis
Germany is expected to account for the largest share of the European SPM market in 2016. This country
segment is projected to reach USD 77.3 million by 2021 from USD 52.7 million in 2016, at the highest
CAGR of 8.0% from 2016 to 2021.
68
MICROSCOPY MARKET – GLOBAL FORECAST TO 2021
© MarketsandMarkets
FIGURE 23 BRAZIL TO ACCOUNT FOR THE LARGEST SHARE OF THE SPM MARKET IN THE ROW
Source: Annual Reports, Press Releases, SEC Filings, Investor Presentations, Microscopy Society of America, Canadian Cytometry and
Microscopy Association, Chinese Electron Microcopy Society, Australian Microscopy and Microanalysis Society, Journal of
Microscopy, Journal of Advanced Microscopy Research, Expert Interviews, and MarketsandMarkets Analysis
TABLE 28 ROW: SPM MARKET SIZE, BY COUNTRY/REGION, 2014–2021 (USD MILLION)
Country/Region 2014 2015 2016 2021
CAGR
(2016–2021)
Brazil 25.2 26.5 27.9 35.7 5.0%
Mexico 15.2 15.7 16.3 19.1 3.2%
Argentina 5.7 6.1 6.4 8.5 5.8%
RoLA 14.1 14.9 15.8 20.4 5.3%
Total 60.2 63.2 66.4 83.6 4.7%
Source: Annual Reports, Press Releases, SEC Filings, Investor Presentations, Microscopy Society of America, Canadian Cytometry and
Microscopy Association, Chinese Electron Microcopy Society, Australian Microscopy and Microanalysis Society, Journal of
Microscopy, Journal of Advanced Microscopy Research, Expert Interviews, and MarketsandMarkets Analysis
Brazil is expected to account for the largest share of the RoW SPM market in 2016. This country segment
is projected to reach USD 35.7 million by 2021 from USD 27.9 million in 2016, at a CAGR of 5.0% from
2016 to 2021.
Brazil Mexico Argentina RoLA
2016 27.9 16.3 6.4 15.8
2021 35.7 19.1 8.5 20.4
CAGR 5.0% 3.2% 5.7% 5.2%
0
5
10
15
20
25
30
35
40
MarketSize(USDMillion)
69
MICROSCOPY MARKET – GLOBAL FORECAST TO 2021
© MarketsandMarkets
6.5.1 SCANNING TUNNELING MICROSCOPES (STM)
Scanning tunneling microscopes are earlier versions of SPM. These microscopes work on the principle of
quantum tunneling—that is, the application of a tunneling current at the probe’s tip; the tip’s position scans
the surface of the sample and creates an image on the monitor. The requirement of stable and clean
surfaces, sharp tips, and extreme vibration control mechanisms are some of the major limitations of this
type of microscopy. These limitations have been overcome through the development of AFM.
Being a high-level surface scanning technology, STM has a wide range of applications across industries
and research for topological studies. Applications in the life sciences segment include studies related to
atom interactions, plasma membranes, and cell structures.
TABLE 29 STM MARKET SIZE, BY REGION, 2014-2021 (USD MILLION)
Region 2014 2015 2016 2021
CAGR
(2016–2021)
North America 146.1 152.0 158.5 191.5 3.9%
Europe 116.5 122.7 129.6 167.2 5.2%
Asia-Pacific 90.8 98.0 105.9 152.5 7.6%
RoW 41.5 43.5 45.7 57.5 4.7%
Total 394.8 416.2 439.8 568.8 5.3%
Source: Annual Reports, Press Releases, SEC Filings, Investor Presentations, Microscopy Society of America, Canadian Cytometry and
Microscopy Association, Chinese Electron Microcopy Society, Australian Microscopy and Microanalysis Society, Journal of
Microscopy, Journal of Advanced Microscopy Research, Expert Interviews, and MarketsandMarkets Analysis
North America is expected to account for the largest share of the STM market in 2016. This regional
segment is projected to reach USD 191.5 million by 2021 from USD 158.5 million in 2016, at a CAGR of
3.9% from 2016 to 2021.
TABLE 30 ROW: STM MARKET SIZE, BY COUNTRY/REGION, 2014–2021 (USD MILLION)
Country/Region 2014 2015 2016 2021
CAGR
(2016–2021)
Brazil 17.3 18.2 19.2 24.6 5.0%
Mexico 10.4 10.8 11.2 13.1 3.2%
Argentina 3.9 4.2 4.4 5.9 5.8%
RoLA 9.7 10.3 10.8 14.0 5.3%
Total 41.5 43.5 45.7 57.5 4.7%
Source: Annual Reports, Press Releases, SEC Filings, Investor Presentations, Microscopy Society of America, Canadian Cytometry and
Microscopy Association, Chinese Electron Microcopy Society, Australian Microscopy and Microanalysis Society, Journal of
Microscopy, Journal of Advanced Microscopy Research, Expert Interviews, and MarketsandMarkets Analysis
Brazil is expected to account for the largest share of the RoW STM market in 2016. This country segment
is projected to reach USD 24.6 million by 2021 from USD 19.2 million in 2016, at a CAGR of 5.0% from
2016 to 2021.
70
MICROSCOPY MARKET – GLOBAL FORECAST TO 2021
© MarketsandMarkets
6.5.2 ATOMIC FORCE MICROSCOPES (AFM)
AFMs are high-resolution SPM with resolution power of up to the order of nanometers. Unlike scanning
tunneling microscopes (STM), AFM create 3D images of specimens. The image resolution and quality of
AFM instruments are comparable to electron microscopes. This is the primary reason for the wider uptake
of AFMs as an alternative to the high-cost electron microscopes. AFM instruments have a wide range of
applications across various industries such as semiconductors, polymers, metallurgy, ceramics,
nanotechnology, biomedical, and life sciences.
The market for AFM is expected to be driven by the overall growth of the nanotechnology and biotechnology
sectors. The easy availability of research funds is expected to be the primary growth driver for this market
segment. However, the higher replacement cost of cantilevers—the probes used for scanning—and the
inability to scan steep walls of specimens are some limitations of AFM.
The current trend in the AFM segment is the incorporation of a wide range of accessories in microscopes to
achieve digitization of images and to improve resolution.
TABLE 31 AFM MARKET SIZE, BY REGION, 2014-2021 (USD MILLION)
Region 2014 2015 2016 2021
CAGR
(2016–2021)
North America 55.7 58.0 60.5 73.3 3.9%
Europe 44.4 46.9 49.5 64.0 5.3%
Asia-Pacific 34.7 37.4 40.5 58.4 7.6%
RoW 15.8 16.6 17.4 22.0 4.8%
Total 150.7 158.9 167.9 217.7 5.3%
Source: Annual Reports, Press Releases, SEC Filings, Investor Presentations, Microscopy Society of America, Canadian Cytometry and
Microscopy Association, Chinese Electron Microcopy Society, Australian Microscopy and Microanalysis Society, Journal of
Microscopy, Journal of Advanced Microscopy Research, Expert Interviews, and MarketsandMarkets Analysis
North America is expected to account for the largest share of the AFM market in 2016. This regional
segment is projected to reach USD 73.3 million by 2021 from USD 60.5 million in 2016, at a CAGR of 3.9%
from 2016 to 2021.
TABLE 32 ROW: AFM MARKET SIZE, BY COUNTRY/REGION, 2014–2021 (USD MILLION)
Country/Region 2014 2015 2016 2021
CAGR
(2016–2021)
Brazil 6.6 7.0 7.3 9.4 5.1%
Mexico 4.0 4.1 4.3 5.0 3.3%
Argentina 1.5 1.6 1.7 2.2 5.8%
RoLA 3.7 3.9 4.1 5.4 5.3%
Total 15.8 16.6 17.4 22.0 4.8%
Source: Annual Reports, Press Releases, SEC Filings, Investor Presentations, Microscopy Society of America, Canadian Cytometry and
Microscopy Association, Chinese Electron Microcopy Society, Australian Microscopy and Microanalysis Society, Journal of
Microscopy, Journal of Advanced Microscopy Research, Expert Interviews, and MarketsandMarkets Analysis
Brazil is expected to account for the largest share of the RoW AFM market in 2016. This country segment
is projected to reach USD 9.4 million by 2021 from USD 7.3 million in 2016, at a CAGR of 5.1% from 2016
to 2021.
71
MICROSCOPY MARKET – GLOBAL FORECAST TO 2021
© MarketsandMarkets
6.5.3 NEAR-FIELD SCANNING OPTICAL MICROSCOPES (NSOM)
NSOM utilizes the properties of evanescent waves for nanostructure analysis. Due to this feature, when
combined with fluorescence technique, biologically active molecules near or on the surface can be studied
using near-field scanning microscopy. NSOM is high-resolution optical microscopy with a wide range of
applications in the life sciences sector, including studies related to DNA sequencing, molecular
organizations in monolayers, formation of protrusions in the cell membrane, and investigation of blood
cells. Due to overlapping application areas, the increasing use of AFM and STM in the life sciences sector
is the biggest threat to the NSOM market.
Some of the major companies in this market include Agilent Technologies (U.S.), Asylum Research (U.S.),
JEOL Ltd. (Japan), and KLA-Tencor (U.S.)
TABLE 33 NSOM MARKET SIZE, BY REGION, 2014-2021 (USD MILLION)
Region 2014 2015 2016 2021
CAGR
(2016–2021)
North America 10.3 10.7 11.1 13.5 4.0%
Europe 8.2 8.7 9.1 11.8 5.3%
Asia-Pacific 6.4 6.9 7.4 10.8 7.7%
RoW 2.9 3.1 3.2 4.1 4.8%
Total 27.8 29.4 30.9 40.2 5.4%
Source: Annual Reports, Press Releases, SEC Filings, Investor Presentations, Microscopy Society of America, Canadian Cytometry and
Microscopy Association, Chinese Electron Microcopy Society, Australian Microscopy and Microanalysis Society, Journal of
Microscopy, Journal of Advanced Microscopy Research, Expert Interviews, and MarketsandMarkets Analysis
North America is expected to account for the largest share of the NSOM market in 2016. This regional
segment is projected to reach USD 13.5 million by 2021 from USD 11.1 million in 2016, at a CAGR of 4.0%
from 2016 to 2021.
TABLE 34 ROW: NSOM MARKET SIZE, BY COUNTRY/REGION, 2014–2021 (USD MILLION)
Country/Region 2014 2015 2016 2021
CAGR
(2016–2021)
Brazil 1.22 1.29 1.35 1.74 5.1%
Mexico 0.74 0.76 0.79 0.93 3.3%
Argentina 0.28 0.29 0.31 0.41 5.9%
RoLA 0.69 0.73 0.76 0.99 5.4%
Total 2.92 3.07 3.21 4.07 4.8%
Source: Annual Reports, Press Releases, SEC Filings, Investor Presentations, Microscopy Society of America, Canadian Cytometry and
Microscopy Association, Chinese Electron Microcopy Society, Australian Microscopy and Microanalysis Society, Journal of
Microscopy, Journal of Advanced Microscopy Research, Expert Interviews, and MarketsandMarkets Analysis
Brazil is expected to account for the largest share of the RoW NSOM market in 2016. This segment is
projected to reach USD 1.74 million by 2021 from USD 1.35 million in 2016, at a CAGR of 5.1% from 2016
to 2021.
72
MICROSCOPY MARKET – GLOBAL FORECAST TO 2021
© MarketsandMarkets
7 MICROSCOPY MARKET, BY APPLICATION
KEY FINDINGS
 In 2016, the semiconductors segment is expected to account for the largest share of 35.1% of
the global microscopy applications market and is expected to grow at a CAGR of 7.6% from
2016 to 2021
 Increasing demand for advanced microscopes and growing focus on the development of
nanoelectronics, miniature transistor chips, and optoelectronics are major drivers for growth of
the semiconductors segment
 In 2016, the life sciences segment is expected to account for the second-largest share of
34.3% of the global microscopy applications market. This segment is estimated to grow at a
CAGR of 8.0% from 2016 to 2021
 Implementation of favorable government initiatives (like the BRAIN initiative) and increasing
application of microscopes in various life science domains such as oncology, cell biology,
neurosciences, protein analysis, and optogenetics are major factors driving growth of the life
sciences segment
 Nanotechnology is the fastest-growing application segment in the microscopy market and is
expected to grow at a CAGR of 10.2% from 2016 to 2021
73
MICROSCOPY MARKET – GLOBAL FORECAST TO 2021
© MarketsandMarkets
7.1 INTRODUCTION
Ongoing technological advancements have widened the application areas of microscopes, and, in recent
years, microscopes are increasingly being used in cancer studies, cell biology, molecular biology, protein
analysis, neurosciences, textile engineering, material sciences, nanomedicines, optogenetics, failure
analysis, and process development. Based on applications, in this research report, the global microscopy
market has been categorized into four application segments—semiconductors, life sciences, material
sciences, and nanotechnology. In 2016, the semiconductors segment is expected to account for the
largest share of 35.1% of the global microscopy market, followed by the life sciences segment with a share
of 34.3%.
FIGURE 24 SEMICONDUCTORS SEGMENT TO DOMINATE THE MICROSCOPY APPLICATION
MARKET DURING THE FORECAST PERIOD
Source: Annual Reports, Press Releases, SEC Filings, Investor Presentations, Microscopy Society of America, Canadian Cytometry and
Microscopy Association, Chinese Electron Microcopy Society, Australian Microscopy and Microanalysis Society, Journal of
Microscopy, Journal of Advanced Microscopy Research, Expert Interviews, and MarketsandMarkets Analysis
TABLE 35 GLOBAL MICROSCOPY MARKET SIZE, BY APPLICATION, 2014–2021 (USD MILLION)
Application 2014 2015 2016 2021
CAGR
(2016–2021)
Semiconductors 1,423.0 1,529.0 1,644.2 2,371.3 7.6%
Life Sciences 1,382.4 1,488.0 1,604.8 2,353.1 8.0%
Material Sciences 813.2 849.7 894.9 1,121.0 4.6%
Nanotechnology 447.2 491.9 541.5 881.2 10.2%
Total 4,065.8 4,358.5 4,685.4 6,726.5 7.5%
Source: Annual Reports, Press Releases, SEC Filings, Investor Presentations, Microscopy Society of America, Canadian Cytometry and
Microscopy Association, Chinese Electron Microcopy Society, Australian Microscopy and Microanalysis Society, Journal of
Microscopy, Journal of Advanced Microscopy Research, Expert Interviews, and MarketsandMarkets Analysis
The semiconductors segment is expected to account for the largest share of the global microscopy
applications market in 2016. This segment is projected to reach USD 2,371.3 million by 2021 from USD
1,644.2 million in 2016, at a CAGR of 7.6% during the forecast period.
Semiconductors Life Sciences Material Sciences Nanotechnology
2016 1,644.2 1,604.8 894.9 541.5
2021 2,371.3 2,353.1 1,121.0 881.2
CAGR 7.6% 8.0% 4.6% 10.2%
0
500
1,000
1,500
2,000
2,500
MarketSize(USDMillion)
74
MICROSCOPY MARKET – GLOBAL FORECAST TO 2021
© MarketsandMarkets
7.2 SEMICONDUCTORS
The semiconductors segment is expected to account for the largest share (35.1%) of the global microscopy
applications market in 2016. Microscopy is used extensively in the semiconductors industry for research
and development, quality control (QC), monitoring, process development, and failure analysis.
Technological advancements in microscopy, such as Focused Ion Beam milling techniques and super-
resolution microscopy, are offering significant growth opportunities for this industry. The semiconductor
industry is the major end user of advanced microscopes such as transmission electron microscopes and
multi-photon confocal microscopes. The growing demand for miniature transistor chips, nanoelectronics,
quantum dots, and optoelectronics are major factors driving adoption of microscopes in the semiconductor
industry. The Eclipse LV150N, Eclipse LV150NL, and Eclipse L200N Series from Nikon are some examples
of microscopes for the semiconductor industry.
FIGURE 25 ASIA-PACIFIC TO WITNESS THE HIGHEST GROWTH RATE DURING THE FORECAST
PERIOD
Source: Annual Reports, Press Releases, SEC Filings, Investor Presentations, Microscopy Society of America, Canadian Cytometry and
Microscopy Association, Chinese Electron Microcopy Society, Australian Microscopy and Microanalysis Society, Journal of
Microscopy, Journal of Advanced Microscopy Research, Expert Interviews, and MarketsandMarkets Analysis
North America Europe Asia-Pacific RoW
2016 592.7 484.5 396.1 170.8
2021 798.5 697.1 635.8 239.9
CAGR 6.1% 7.5% 9.9% 7.0%
0
100
200
300
400
500
600
700
800
900
MarketSize(USDMillion)
75
MICROSCOPY MARKET – GLOBAL FORECAST TO 2021
© MarketsandMarkets
TABLE 36 MICROSCOPY MARKET SIZE FOR SEMICONDUCTORS, BY REGION,
2014–2021 (USD MILLION)
Region 2014 2015 2016 2021
CAGR
(2016–2021)
North America 526.5 558.4 592.7 798.5 6.1%
Europe 419.8 450.9 484.5 697.1 7.5%
Asia-Pacific 327.3 359.9 396.1 635.8 9.9%
RoW 149.4 159.8 170.8 239.9 7.0%
Total 1,423.0 1,529.0 1,644.2 2,371.3 7.6%
Source: Annual Reports, Press Releases, SEC Filings, Investor Presentations, Microscopy Society of America, Canadian Cytometry and
Microscopy Association, Chinese Electron Microcopy Society, Australian Microscopy and Microanalysis Society, Journal of
Microscopy, Journal of Advanced Microscopy Research, Expert Interviews, and MarketsandMarkets Analysis
In 2016, North America is expected to command the largest share of the microscopy market for
semiconductors. This segment is projected to reach USD 798.5 million by 2021 from USD 592.7 million in
2016, at a CAGR of 6.1% from 2016 to 2021.
TABLE 37 NORTH AMERICA: MICROSCOPY MARKET SIZE FOR SEMICONDUCTORS, BY COUNTRY,
2014–2021 (USD MILLION)
Country 2014 2015 2016 2021
CAGR
(2016–2021)
U.S. 423.8 449.8 477.9 646.1 6.2%
Canada 102.7 108.5 114.9 152.3 5.8%
Total 526.5 558.4 592.7 798.5 6.1%
Source: Annual Reports, Press Releases, SEC Filings, Investor Presentations, Microscopy Society of America, Canadian Cytometry and
Microscopy Association, Chinese Electron Microcopy Society, Australian Microscopy and Microanalysis Society, Journal of
Microscopy, Journal of Advanced Microscopy Research, Expert Interviews, and MarketsandMarkets Analysis
In 2016, the U.S. is expected to command the larger share of the North American microscopy market for
semiconductors. This segment is projected to reach USD 646.1 million by 2021 from USD 477.9 million in
2016, at a higher CAGR of 6.2% from 2016 to 2021.
76
MICROSCOPY MARKET – GLOBAL FORECAST TO 2021
© MarketsandMarkets
TABLE 38 EUROPE: MICROSCOPY MARKET SIZE FOR SEMICONDUCTORS, BY COUNTRY/REGION,
2014–2021 (USD MILLION)
Country/Region 2014 2015 2016 2021
CAGR
(2016–2021)
Germany 111.3 123.0 135.7 221.8 10.3%
U.K. 61.0 66.7 73.0 114.8 9.5%
France 42.9 46.4 50.3 75.5 8.5%
RoE 204.6 214.8 225.5 285.0 4.8%
Total 419.8 450.9 484.5 697.1 7.5%
Source: Annual Reports, Press Releases, SEC Filings, Investor Presentations, Microscopy Society of America, Canadian Cytometry and
Microscopy Association, Chinese Electron Microcopy Society, Australian Microscopy and Microanalysis Society, Journal of
Microscopy, Journal of Advanced Microscopy Research, Expert Interviews, and MarketsandMarkets Analysis
In 2016, Germany is expected to command the largest share of the European microscopy market for
semiconductors. This country segment is projected to reach USD 221.8 million by 2021 from USD 135.7
million in 2016, at the highest CAGR of 10.3% from 2016 to 2021.
TABLE 39 ROW: MICROSCOPY MARKET SIZE FOR SEMICONDUCTORS, BY COUNTRY/REGION,
2014–2021 (USD MILLION)
Country/Region 2014 2015 2016 2021
CAGR
(2016–2021)
Brazil 62.5 67.0 71.8 102.4 7.3%
Mexico 37.7 39.7 41.9 54.7 5.5%
Argentina 14.2 15.3 16.6 24.4 8.1%
RoLA 35.1 37.7 40.6 58.4 7.6%
Total 149.4 159.8 170.8 239.9 7.0%
Source: Annual Reports, Press Releases, SEC Filings, Investor Presentations, Microscopy Society of America, Canadian Cytometry and
Microscopy Association, Chinese Electron Microcopy Society, Australian Microscopy and Microanalysis Society, Journal of
Microscopy, Journal of Advanced Microscopy Research, Expert Interviews, and MarketsandMarkets Analysis
In 2016, Brazil is expected to command the largest share of the RoW microscopy market for
semiconductors. This country segment is projected to reach USD 102.4 million by 2021 from USD 71.8
million in 2016, at a CAGR of 7.3% from 2016 to 2021.
77
MICROSCOPY MARKET – GLOBAL FORECAST TO 2021
© MarketsandMarkets
TABLE 40 MICROSCOPY MARKET SIZE FOR SEMICONDUCTORS, BY PRODUCT,
2014–2021 (USD MILLION)
Product 2014 2015 2016 2021
CAGR
(2016– 2021)
Optical Microscopes 513.0 529.8 538.8 675.3 4.6%
Electron Microscopes 577.0 645.5 728.7 1,193.7 10.4%
Confocal Microscopes 132.3 141.6 152.6 210.8 6.7%
SPM 200.6 212.1 224.1 291.4 5.4%
Total 1,423.0 1,529.0 1,644.2 2,371.3 7.6%
Source: Annual Reports, Press Releases, SEC Filings, Investor Presentations, Microscopy Society of America, Canadian Cytometry and
Microscopy Association, Chinese Electron Microcopy Society, Australian Microscopy and Microanalysis Society, Journal of
Microscopy, Journal of Advanced Microscopy Research, Expert Interviews, and MarketsandMarkets Analysis
In 2016, the electron microscopes segment is expected to command the largest share of the microscopy
market for semiconductors. This country segment is projected to reach USD 1,193.7 million by 2021 from
USD 728.7 million in 2016, at the highest CAGR of 10.4% from 2016 to 2021.
78
MICROSCOPY MARKET – GLOBAL FORECAST TO 2021
© MarketsandMarkets
7.3 LIFE SCIENCES
The life sciences segment is expected to account for the second-largest share of 34.3% of the global
microscopy applications market in 2016. Microscopes are widely used in various life sciences applications,
such as cancer studies, protein analysis, cellular biology studies, stem cell research, neurosciences, and
optogenetics. Growing research and development activities and availability of funding in life sciences are
the key factors driving growth of this application segment.
FIGURE 26 MICROSCOPY INSTRUMENTS IN LIFE SCIENCES
Source: Annual Reports, Press Releases, SEC Filings, Investor Presentations, Expert Interviews, and MarketsandMarkets Analysis
Advanced microscopes, such as AFM and electron microscopes, are used in quality control processes
(such as particle size analysis and shelf life studies) in the pharmaceutical industry. Globally, the
availability of government funding to support life science research activities is one of the major factors
fueling growth of this application segment. For instance, in April 2013, the Brain Research through
Advancing Innovative Neurotechnologies (BRAIN) Initiative, with a projected annual cost of over USD 300
million for a period of ten years, was launched by the U.S. government.
1 meter 100 mm 10 mm 1 mm 100 µm 10 µm 1 µm 100nm 10nm 1nm 10-1nm
200 µm
Electron Microscopes and Scanning Probe Microscopes
Optical microscopes
Un-aided human eye
Cells Bacteria Viruses Macromolecules
200 nm
79
MICROSCOPY MARKET – GLOBAL FORECAST TO 2021
© MarketsandMarkets
TABLE 41 MICROSCOPY MARKET SIZE FOR LIFE SCIENCES, BY REGION, 2014–2021 (USD MILLION)
Region 2014 2015 2016 2021
CAGR
(2016– 2021)
North America 511.5 543.4 578.5 792.4 6.5%
Europe 407.8 438.8 472.9 691.7 7.9%
Asia-Pacific 317.9 350.3 386.6 630.9 10.3%
RoW 145.1 155.5 166.7 238.1 7.4%
Total 1,382.4 1,488.0 1,604.8 2,353.1 8.0%
Source: Annual Reports, Press Releases, SEC Filings, Investor Presentations, Microscopy Society of America, Canadian Cytometry and
Microscopy Association, Chinese Electron Microcopy Society, Australian Microscopy and Microanalysis Society, Journal of
Microscopy, Journal of Advanced Microscopy Research, Expert Interviews, and MarketsandMarkets Analysis
In 2016, North America is expected to command the largest share of the microscopy market for life
sciences. This regional segment is projected to reach USD 792.4 million by 2021 from USD 578.5 million
in 2016, at a CAGR of 6.5% from 2016 to 2021.
FIGURE 27 U.S. TO DOMINATE THE MICROSCOPY MARKET FOR LIFE SCIENCES IN 2016
Source: Annual Reports, Press Releases, SEC Filings, Investor Presentations, Microscopy Society of America, Canadian Cytometry and
Microscopy Association, Chinese Electron Microcopy Society, Australian Microscopy and Microanalysis Society, Journal of
Microscopy, Journal of Advanced Microscopy Research, Expert Interviews, and MarketsandMarkets Analysis
U.S. Canada
2016 466.4 112.1
2021 641.2 151.2
CAGR 6.6% 6.2%
0
100
200
300
400
500
600
700
MarketSize(USDMillion)
80
MICROSCOPY MARKET – GLOBAL FORECAST TO 2021
© MarketsandMarkets
TABLE 42 NORTH AMERICA: MICROSCOPY MARKET SIZE FOR LIFE SCIENCES, BY COUNTRY,
2014–2021 (USD MILLION)
Country 2014 2015 2016 2021
CAGR
(2016– 2021)
U.S. 411.7 437.8 466.4 641.2 6.6%
Canada 99.7 105.6 112.1 151.2 6.2%
Total 511.5 543.4 578.5 792.3 6.5%
Source: Annual Reports, Press Releases, SEC Filings, Investor Presentations, Microscopy Society of America, Canadian Cytometry and
Microscopy Association, Chinese Electron Microcopy Society, Australian Microscopy and Microanalysis Society, Journal of
Microscopy, Journal of Advanced Microscopy Research, Expert Interviews, and MarketsandMarkets Analysis
In 2016, the U.S. is expected to command the larger share of the North American microscopy market for
life sciences. This country segment is projected to reach USD 641.2 million by 2021 from USD 466.4
million in 2016, at a CAGR of 6.6% from 2016 to 2021.
TABLE 43 EUROPE: MICROSCOPY MARKET SIZE FOR LIFE SCIENCES, BY COUNTRY/REGION,
2014–2021 (USD MILLION)
Country/Region 2014 2015 2016 2021
CAGR
(2016– 2021)
Germany 108.1 119.7 132.4 220.0 10.7%
U.K. 59.3 64.9 71.3 113.9 9.8%
France 41.7 45.2 49.1 74.9 8.8%
RoE 198.8 209.0 220.1 282.8 5.1%
Total 407.8 438.8 472.9 691.7 7.9%
Source: Annual Reports, Press Releases, SEC Filings, Investor Presentations, Microscopy Society of America, Canadian Cytometry and
Microscopy Association, Chinese Electron Microcopy Society, Australian Microscopy and Microanalysis Society, Journal of
Microscopy, Journal of Advanced Microscopy Research, Expert Interviews, and MarketsandMarkets Analysis
In 2016, Germany is expected to command the largest share of the European microscopy market for life
sciences. This country segment is projected to reach USD 220.0 million by 2021 from USD 132.4 million in
2016, at the highest CAGR of 10.7% from 2016 to 2021.
81
MICROSCOPY MARKET – GLOBAL FORECAST TO 2021
© MarketsandMarkets
TABLE 44 ROW: MICROSCOPY MARKET SIZE FOR LIFE SCIENCES, BY COUNTRY,
2014–2021 (USD MILLION)
Country/Region 2014 2015 2016 2021
CAGR
(2016– 2021)
Brazil 60.7 65.2 70.1 101.6 7.7%
Mexico 36.6 38.6 40.9 54.3 5.8%
Argentina 13.8 14.9 16.2 24.3 8.5%
RoLA 34.1 36.7 39.6 58.0 7.9%
Total 145.1 155.5 166.7 238.1 7.4%
Source: Annual Reports, Press Releases, SEC Filings, Investor Presentations, Microscopy Society of America, Canadian Cytometry and
Microscopy Association, Chinese Electron Microcopy Society, Australian Microscopy and Microanalysis Society, Journal of
Microscopy, Journal of Advanced Microscopy Research, Expert Interviews, and MarketsandMarkets Analysis
In 2016, Brazil is expected to command the largest share of the RoW microscopy market for life sciences.
This segment is projected to reach USD 101.6 million by 2021 from USD 70.1 million in 2016, at a CAGR
of 7.7% from 2016 to 2021.
TABLE 45 MICROSCOPY MARKET SIZE FOR LIFE SCIENCES, BY PRODUCT,
2014–2021 (USD MILLION)
Product 2014 2015 2016 2021
CAGR
(2016– 2021)
Optical Microscopes 546.0 590.0 654.3 920.1 7.1%
Electron Microscopes 512.9 553.8 582.9 938.6 10.0%
Confocal Microscopes 128.6 137.8 148.9 205.9 6.7%
SPM 194.9 206.4 218.7 288.5 5.7%
Total 1,382.4 1,488.0 1,604.8 2,353.1 8.0%
Source: Annual Reports, Press Releases, SEC Filings, Investor Presentations, Microscopy Society of America, Canadian Cytometry and
Microscopy Association, Chinese Electron Microcopy Society, Australian Microscopy and Microanalysis Society, Journal of
Microscopy, Journal of Advanced Microscopy Research, Expert Interviews, and MarketsandMarkets Analysis
In 2016, the electron microscopes segment is expected to command the largest share of the microscopy
market for life sciences. This segment is projected to reach USD 938.6 million by 2021 from USD 582.9
million in 2016, at the highest CAGR of 10.0% from 2016 to 2021.
82
MICROSCOPY MARKET – GLOBAL FORECAST TO 2021
© MarketsandMarkets
7.4 MATERIAL SCIENCES
The material sciences segment is expected to account for a share of 19.1% of the global microscopy
applications market in 2016. Material science deals with the discovery and study of properties of
materials; in this field, microscopes are used for structural and chemical analysis of materials such as
polymers, metal alloys, ceramics, and biomaterials. The use of customized microscopy solutions to meet
end-user needs; development of digital microscope cameras with image sensors, such as charge-coupled
device (CCD) and complementary metal-oxide semiconductor (CMOS); and availability of novel image
acquisition software are driving the microscopy market for material science applications. In addition,
growing focus on designing novel materials such as fullerene, graphene, carbon nanotubes, quantum dots,
silicone, superalloys, and synthetic diamonds is expected to offer significant growth opportunities for this
application segment in the coming years.
TABLE 46 MICROSCOPY MARKET SIZE FOR MATERIAL SCIENCES, BY REGION,
2014–2021 (USD MILLION)
Region 2014 2015 2016 2021
CAGR
(2016– 2021)
North America 300.9 310.3 322.6 377.5 3.2%
Europe 239.9 250.6 263.7 329.5 4.6%
Asia-Pacific 187.0 200.0 215.6 300.6 6.9%
RoW 85.4 88.8 93.0 113.4 4.1%
Total 813.2 849.7 894.9 1,121.0 4.6%
Source: Annual Reports, Press Releases, SEC Filings, Investor Presentations, Microscopy Society of America, Canadian Cytometry and
Microscopy Association, Chinese Electron Microcopy Society, Australian Microscopy and Microanalysis Society, Journal of
Microscopy, Journal of Advanced Microscopy Research, Expert Interviews, and MarketsandMarkets Analysis
In 2016, North America is expected to command the largest share of the microscopy market for material
sciences. This regional segment is projected to reach USD 377.5 million by 2021 from USD 322.6 million
in 2016, at a CAGR of 3.2% from 2016 to 2021.
TABLE 47 NORTH AMERICA: MICROSCOPY MARKET SIZE FOR MATERIAL SCIENCES, BY COUNTRY,
2014–2021 (USD MILLION)
Country 2014 2015 2016 2021
CAGR
(2016– 2021)
U.S. 242.2 250.0 260.1 305.4 3.3%
Canada 58.7 60.3 62.5 72.0 2.9%
Total 300.9 310.3 322.6 377.5 3.2%
Source: Annual Reports, Press Releases, SEC Filings, Investor Presentations, Microscopy Society of America, Canadian Cytometry and
Microscopy Association, Chinese Electron Microcopy Society, Australian Microscopy and Microanalysis Society, Journal of
Microscopy, Journal of Advanced Microscopy Research, Expert Interviews, and MarketsandMarkets Analysis
In 2016, the U.S. is expected to command the larger share of the North American microscopy market for
material sciences. This segment is projected to reach USD 305.4 million by 2021 from USD 260.1 million
in 2016, at a CAGR of 3.3% from 2016 to 2021.
83
MICROSCOPY MARKET – GLOBAL FORECAST TO 2021
© MarketsandMarkets
FIGURE 28 GERMANY TO WITNESS THE HIGHEST GROWTH RATE IN THE EUROPEAN
MICROSCOPY MARKET FOR MATERIAL SCIENCES
Source: Annual Reports, Press Releases, SEC Filings, Investor Presentations, Microscopy Society of America, Canadian Cytometry and
Microscopy Association, Chinese Electron Microcopy Society, Australian Microscopy and Microanalysis Society, Journal of
Microscopy, Journal of Advanced Microscopy Research, Expert Interviews, and MarketsandMarkets Analysis
TABLE 48 EUROPE: MICROSCOPY MARKET SIZE FOR MATERIAL SCIENCES, BY COUNTRY/REGION,
2014–2021 (USD MILLION)
Country/Region 2014 2015 2016 2021
CAGR
(2016– 2021)
Germany 63.6 68.4 73.9 104.8 7.3%
U.K. 34.9 37.1 39.7 54.3 6.4%
France 24.5 25.8 27.4 35.7 5.5%
RoE 116.9 119.4 122.8 134.7 1.9%
Total 239.9 250.6 263.7 329.5 4.6%
Source: Annual Reports, Press Releases, SEC Filings, Investor Presentations, Microscopy Society of America, Canadian Cytometry and
Microscopy Association, Chinese Electron Microcopy Society, Australian Microscopy and Microanalysis Society, Journal of
Microscopy, Journal of Advanced Microscopy Research, Expert Interviews, and MarketsandMarkets Analysis
In 2016, Germany is expected to command the largest share of the European microscopy market for
material sciences. This country segment is projected to reach USD 104.8 million by 2021 from USD 73.9
million in 2016, at a CAGR of 7.3% from 2016 to 2021.
Germany U.K. France RoE
2016 73.9 39.7 27.4 122.8
2021 104.8 54.3 35.7 134.7
CAGR 7.3% 6.4% 5.5% 1.9%
0
20
40
60
80
100
120
140
160
MarketSize(USDMillion)
84
MICROSCOPY MARKET – GLOBAL FORECAST TO 2021
© MarketsandMarkets
TABLE 49 ROW: MICROSCOPY MARKET SIZE FOR MATERIAL SCIENCES, BY COUNTRY/REGION,
2014–2021 (USD MILLION)
Country/Region 2014 2015 2016 2021
CAGR
(2016–2021)
Brazil 35.7 37.2 39.1 48.4 4.4%
Mexico 21.5 22.1 22.8 25.8 2.5%
Argentina 8.1 8.5 9.0 11.6 5.1%
RoLA 20.1 21.0 22.1 27.6 4.6%
Total 85.4 88.8 93.0 113.4 4.1%
Source: Annual Reports, Press Releases, SEC Filings, Investor Presentations, Microscopy Society of America, Canadian Cytometry and
Microscopy Association, Chinese Electron Microcopy Society, Australian Microscopy and Microanalysis Society, Journal of
Microscopy, Journal of Advanced Microscopy Research, Expert Interviews, and MarketsandMarkets Analysis
In 2016, Brazil is expected to command the largest share of the RoW microscopy market for material
sciences. This country segment is projected to reach USD 48.4 million by 2021 from USD 39.1 million in
2016, at a CAGR of 4.4% from 2016 to 2021.
TABLE 50 MICROSCOPY MARKET SIZE FOR MATERIAL SCIENCES, BY PRODUCT,
2014–2021 (USD MILLION)
Product 2014 2015 2016 2021
CAGR
(2016–2021)
Optical Microscopes 321.2 328.4 338.0 375.3 2.1%
Electron Microscopes 301.7 324.8 351.9 508.3 7.6%
Confocal Microscopes 75.6 78.7 83.0 99.7 3.7%
SPM 114.7 117.9 122.0 137.8 2.5%
Total 813.2 849.7 894.9 1,121.0 4.6%
Source: Annual Reports, Press Releases, SEC Filings, Investor Presentations, Microscopy Society of America, Canadian Cytometry and
Microscopy Association, Chinese Electron Microcopy Society, Australian Microscopy and Microanalysis Society, Journal of
Microscopy, Journal of Advanced Microscopy Research, Expert Interviews, and MarketsandMarkets Analysis
In 2016, the electron microscopes segment is expected to command the largest share of the microscopy
market for material sciences. This segment is projected to reach USD 508.3 million by 2021 from USD
351.9 million in 2016, at the highest CAGR of 7.6% from 2016 to 2021.
85
MICROSCOPY MARKET – GLOBAL FORECAST TO 2021
© MarketsandMarkets
7.5 NANOTECHNOLOGY
The nanotechnology segment is expected to account for a share of 11.6% of the global microscopy
applications market in 2016. Microscopy is the most widely-used technology for imaging, analyzing, and
manipulating matter on a nanoscale. Increasing investment in nanotechnology, owing to ongoing
technological advancements, is the major driver for this segment.
Nanotechnology is the fastest-growing application segment in the microscopy market. High growth in this
segment can be attributed to the wide array of nanotechnology applications across various industries such
as electronics, information technology, food, chemical manufacturing, aerospace, textile, and
pharmaceuticals. Furthermore, various federal initiatives to promote nanotechnology research across the
globe are propelling growth of this segment. Since the year 2000, the field of nanotechnology has
witnessed cumulative investment of over USD 65 billion from governments of various countries; by 2015,
this figure is estimated to reach USD 0.25 trillion, including corporate and private-sector investment. The
U.S. government provides the highest funding for nanotechnology research and development, and for the
year 2014, it proposed a budget of USD 1.7 billion in NNI funding.
The European Commission’s Seventh Framework Programme (FP7) allocated funds of around USD 69.4
billion to boost nanoscience-related programs in the region from 2007 to 2013. In 2014, a new funding
initiative called Horizon 2020 was started for the next seven-year period (2014 to 2020). It is the largest
EU research and innovation program, with a funding of approximately USD 107.6 billion (EUR 80 billion), in
addition to private investment. Similarly, in 2007, the government of Russia founded the Russian
Corporation of Nanotechnologies (RUSNANO) to establish a nanotechnology industry in Russia by 2015.
TABLE 51 MICROSCOPY MARKET SIZE FOR NANOTECHNOLOGY, BY REGION,
2014–2021 (USD MILLION)
Region 2014 2015 2016 2021
CAGR
(2016–2021)
North America 165.5 179.6 195.2 296.7 8.7%
Europe 131.9 145.0 159.6 259.0 10.2%
Asia-Pacific 102.9 115.8 130.4 236.3 12.6%
RoW 47.0 51.4 56.3 89.1 9.6%
Total 447.2 491.9 541.5 881.2 10.2%
Source: Annual Reports, Press Releases, SEC Filings, Investor Presentations, Microscopy Society of America, Canadian Cytometry and
Microscopy Association, Chinese Electron Microcopy Society, Australian Microscopy and Microanalysis Society, Journal of
Microscopy, Journal of Advanced Microscopy Research, Expert Interviews, and MarketsandMarkets Analysis
In 2016, North America is expected to command the largest share of the microscopy market for
nanotechnology. This regional segment is projected to reach USD 296.7 million by 2021 from USD 195.2
million in 2016, at a CAGR of 8.7% from 2016 to 2021.
86
MICROSCOPY MARKET – GLOBAL FORECAST TO 2021
© MarketsandMarkets
TABLE 52 NORTH AMERICA: MICROSCOPY MARKET SIZE FOR NANOTECHNOLOGY, BY COUNTRY,
2014–2021 (USD MILLION)
Country 2014 2015 2016 2021
CAGR
(2016–2021)
U.S. 133.2 144.7 157.4 240.1 8.8%
Canada 32.3 34.9 37.8 56.6 8.4%
Total 165.5 179.6 195.2 296.7 8.7%
Source: Annual Reports, Press Releases, SEC Filings, Investor Presentations, Microscopy Society of America, Canadian Cytometry and
Microscopy Association, Chinese Electron Microcopy Society, Australian Microscopy and Microanalysis Society, Journal of
Microscopy, Journal of Advanced Microscopy Research, Expert Interviews, and MarketsandMarkets Analysis
In 2016, the U.S. is expected to command the larger share of the North American microscopy market for
nanotechnology. This country segment is projected to reach USD 240.1 million by 2021 from USD 157.4
million in 2016, at a higher CAGR of 8.8% from 2016 to 2021.
TABLE 53 EUROPE: MICROSCOPY MARKET SIZE FOR NANOTECHNOLOGY, BY COUNTRY/REGION,
2014–2021 (USD MILLION)
Country/Region 2014 2015 2016 2021
CAGR
(2016–2021)
Germany 35.0 39.6 44.7 82.4 13.0%
U.K. 19.2 21.5 24.0 42.7 12.1%
France 13.5 14.9 16.6 28.1 11.1%
RoE 64.3 69.1 74.3 105.9 7.4%
Total 131.9 145.0 159.6 259.0 10.2%
Source: Annual Reports, Press Releases, SEC Filings, Investor Presentations, Microscopy Society of America, Canadian Cytometry and
Microscopy Association, Chinese Electron Microcopy Society, Australian Microscopy and Microanalysis Society, Journal of
Microscopy, Journal of Advanced Microscopy Research, Expert Interviews, and MarketsandMarkets Analysis
In 2016, Germany is expected to command the largest share of the European microscopy market for
nanotechnology. This country segment is projected to reach USD 82.4 million by 2021 from USD 44.7
million in 2016, at the highest CAGR of 13.0% from 2016 to 2021.
87
MICROSCOPY MARKET – GLOBAL FORECAST TO 2021
© MarketsandMarkets
FIGURE 29 BRAZIL TO ACCOUNT FOR THE LARGEST SHARE OF THE NANOTECHNOLOGY
APPLICATIONS MARKET IN ROW
Source: Annual Reports, Press Releases, SEC Filings, Investor Presentations, Microscopy Society of America, Canadian Cytometry and
Microscopy Association, Chinese Electron Microcopy Society, Australian Microscopy and Microanalysis Society, Journal of
Microscopy, Journal of Advanced Microscopy Research, Expert Interviews, and MarketsandMarkets Analysis
TABLE 54 ROW: MICROSCOPY MARKET SIZE FOR NANOTECHNOLOGY, BY COUNTRY/REGION,
2014–2021 (USD MILLION)
Country/Region 2014 2015 2016 2021
CAGR
(2016–2021)
Brazil 19.6 21.6 23.7 38.0 10.0%
Mexico 11.8 12.8 13.8 20.3 8.1%
Argentina 4.5 4.9 5.5 9.1 10.7%
RoLA 11.0 12.1 13.4 21.7 10.2%
Total 47.0 51.4 56.3 89.1 9.6%
Source: Annual Reports, Press Releases, SEC Filings, Investor Presentations, Microscopy Society of America, Canadian Cytometry and
Microscopy Association, Chinese Electron Microcopy Society, Australian Microscopy and Microanalysis Society, Journal of
Microscopy, Journal of Advanced Microscopy Research, Expert Interviews, and MarketsandMarkets Analysis
In 2016, Brazil is expected to command the largest share of the RoW microscopy market for
nanotechnology. This country segment is projected to reach USD 38.0 million by 2021 from USD 23.7
million in 2016, at a CAGR of 10.0% from 2016 to 2021.
Brazil Mexico Argentina RoLA
2016 23.7 13.8 5.5 13.4
2021 38.0 20.3 9.1 21.7
CAGR 10.0% 8.1% 10.7% 10.2%
0
5
10
15
20
25
30
35
40
MarketSize(USDMillion)
88
MICROSCOPY MARKET – GLOBAL FORECAST TO 2021
© MarketsandMarkets
TABLE 55 MICROSCOPY MARKET SIZE FOR NANOTECHNOLOGY, BY PRODUCT,
2014–2021 (USD MILLION)
Product 2014 2015 2016 2021
CAGR
(2016–2021)
Optical Microscopes 176.7 190.1 204.5 295.0 7.6%
Electron Microscopes 165.9 188.0 212.9 399.5 13.4%
Confocal Microscopes 41.6 45.5 50.3 78.3 9.3%
SPM 63.1 68.2 73.8 108.3 8.0%
Total 447.2 491.9 541.5 881.2 10.2%
Source: Annual Reports, Press Releases, SEC Filings, Investor Presentations, Microscopy Society of America, Canadian Cytometry and
Microscopy Association, Chinese Electron Microcopy Society, Australian Microscopy and Microanalysis Society, Journal of
Microscopy, Journal of Advanced Microscopy Research, Expert Interviews, and MarketsandMarkets Analysis
In 2016, the electron microscopes segment is expected to command the largest share of the microscopy
market for nanotechnology. This segment is projected to reach USD 399.5 million by 2021 from USD
212.9 million in 2016, at a CAGR of 13.4% from 2016 to 2021.
89
MICROSCOPY MARKET – GLOBAL FORECAST TO 2021
© MarketsandMarkets
8 MICROSCOPY MARKET, BY END USER
KEY FINDINGS
 In 2016, the academic institutes segment is expected to account for the largest share of 52.2%
of the global microscopy end-users market and is estimated to grow at a CAGR of 9.0% from
2016 to 2021
 Worldwide increase in research expenditure, coupled with rise in research interest in cellular
biology, oncology, neuroscience, and upcoming techniques such as optogenetics will accelerate
growth of the academic institutes end-user segment
 The industries segment is expected to account for the second-largest share of 30.3% of the
global microscopy market in 2016
 Rising focus on nanotechnology and development of customized microscopes are key drivers
for growth of the industries end user segment
 The other end users segment accounted for a share of 17.6% of the global microscopy market
in 2016
90
MICROSCOPY MARKET – GLOBAL FORECAST TO 2021
© MarketsandMarkets
8.1 INTRODUCTION
Based on end users, the global microscopy market is segmented into academic institutes, industries, and
other end users (government research institutes and private laboratories). The academic institutes
segment is expected to dominate the market with a share of 52.2% in 2016. This large share can be
attributed to growing research and development activities in life science and nanotechnology disciplines.
Availability of government and corporate funding and technological innovations are other factors
contributing to the growth of this market.
FIGURE 30 ACADEMIC INSTITUTES TO DOMINATE THE MICROSCOPY MARKET IN 2016
*The other end users segment includes government research institutes and private laboratories.
Source: Annual Reports, Press Releases, SEC Filings, Investor Presentations, Microscopy society of America, Canadian Cytometry and
Microscopy Association, Chinese Electron Microcopy Society, Australian Microscopy and Microanalysis Society, Journal of
Microscopy, Journal of advanced Microscopy Research, Expert Interviews, and MarketsandMarkets Analysis
TABLE 56 MICROSCOPY MARKET SIZE, BY END USER, 2014–2021 (USD MILLION)
End User 2014 2015 2016 2021
CAGR
(2016–2021)
Academic Institutes 2,059.7 2,241.0 2,443.9 3,758.1 9.0%
Industries 1,249.8 1,330.3 1,418.7 1,958.8 6.7 %
Other End Users* 756.2 787.2 822.8 1,009.7 4.2%
Total 4,065.8 4,358.5 4,685.4 6,726.5 7.5%
*The other end users segment includes government research institutes and private laboratories.
Source: Annual Reports, Press Releases, SEC Filings, Investor Presentations, Microscopy society of America, Canadian Cytometry and
Microscopy Association, Chinese Electron Microcopy Society, Australian Microscopy and Microanalysis Society, Journal of
Microscopy, Journal of advanced Microscopy Research, Expert Interviews, and MarketsandMarkets Analysis
In 2016, the academic institutes segment is expected to account for the largest share of the microscopy
market. This end user segment is projected to reach USD 3,758.1 million by 2021 from USD 2,443.9
million in 2016, at the highest CAGR of 9.0% during the forecast period.
Academic Institutes Industries Other End Users*
2016 2,443.9 1,418.7 822.8
2021 3,758.1 1,958.8 1,009.7
CAGR 9.0% 6.7% 4.2%
0
500
1,000
1,500
2,000
2,500
3,000
3,500
4,000
MarketSize(USDMillion)
91
MICROSCOPY MARKET – GLOBAL FORECAST TO 2021
© MarketsandMarkets
8.2 ACADEMIC INSTITUTES
Academic institutes are the major end users of microscopes. This segment primarily includes public-funded
research carried out at universities and research centers. Academic research institutes are centers for
innovation as well as basic research. In academic research institutes, microscopy finds applications in
cancer studies, protein analysis, cellular biology studies, stem cell research, neuroscience, and
optogenetics. The number of research studies that utilized microscopy articles published on PubMed, a
repository of life science research articles, increased from 31,626 articles in 2010 to 36,139 articles in
2014. This is indicative of increasing demand of microscopes in academia.
FIGURE 31 GROWTH IN NUMBER OF RESEARCH ACTIVITIES TO AID MARKET GROWTH FOR
ACADEMIC INSTITUTES (2010–2014)
Source: PubMed
Growth in funding for life science research is a primary growth driver for this end-user segment. According
to the World Bank, the overall funding for research and development worldwide increased from USD 739
billion in 2003 to USD 1,214 billion in 2010, at a CAGR of 7.34% between the two years. The U.S.
accounted for the largest share of 37.27% of the global research and development expenditure in 2010.
Research and development expenditure in the U.S. stood at USD 436 billion in 2010, and increased at a
CAGR of 5.06% between 2003 and 2010. In China, research and development expenditure increased at
the highest CAGR of 27.93%, from USD 19 billion in 2003 to USD 135 billion in 2010. Rapid increase in
research expenditure worldwide, coupled with rise in research interest in cellular biology, oncology,
neuroscience, and upcoming techniques such as optogenetics, will accelerate growth of the academic
institutes end-user segment during the forecast period.
31,626
33,281
33,728
35,732
36,139
2010 2011 2012 2013 2014
No.ofResearchArticlesPublished
92
MICROSCOPY MARKET – GLOBAL FORECAST TO 2021
© MarketsandMarkets
Government funding to support research activities is also fueling growth in this end-user segment. In April
2013, the U.S. government launched the BRAIN Initiative with a projected cost of over USD 300 million per
year for a period of ten years. Under this initiative, academic institutes will be responsible for various
research efforts (for instance, the University of Pittsburg is creating a new university aimed at studying
normal and abnormal brain functions). Moreover, collaborative research efforts between university
research centers and microscopy manufacturing companies have fulfilled the need for capital investment
in academic institutions. For instance, in June 2015, Carl Zeiss entered into a partnership with UC Berkeley
as part of the Brain Microscopy Innovation Center (BrainMIC), Berkeley BRAIN Initiative. Under the
partnership, Carl Zeiss will offer the latest updates of high-performance microscopes and imaging
equipment and, in turn, UC Berkeley researchers will provide feedback on any new or special
neurotechnology needs to help Carl Zeiss produce future products for latest advances in neuroscience
research. Similarly, in October 2014, the University of California, and Carl Zeiss Microscopy entered into
collaboration (worth USD 12 million) to support the Berkeley Brain Microscopy Innovation Center
(BrainMIC) under the BRAIN initiative. Under this alliance, BrainMIC will develop microscopes for emerging
neurotechnologies.
In the European region, research activities at academic levels are greatly supporting innovation. The
European Commission (EC) supports research and development in science and technology through the
European Research Council (ERC). In 2014, the EC started a new funding initiative called Horizon 2020.
Horizon 2020 aims at transforming Europe into a dynamic and competitive knowledge-based economy in
the world. It is the largest EU research and innovation program with nearly USD 107.6 billion (EUR 80
billion) of funding in addition to private investment, available over seven years (2014 to 2020).
Emerging economies of China, India, Brazil, and the Middle East are also focusing on research activities for
growth. For instance, the King Abdulla University of Science and Technology (KAUST) in Saudi Arabia
announced a research grant of USD 10 million to support research in nanotechnology. In May 2014, Tel
Aviv University (Israel) and Tsinghua University (China) opened a joint research center named the XIN
Center. The new research center, which costs USD 300 million, will initially focus on nanotechnology and
life sciences to advance industrial innovation.
FIGURE 32 ASIA-PACIFIC OFFERS LUCRATIVE GROWTH OPPORTUNITIES DURING THE
FORECAST PERIOD
Source: Annual Reports, Press Releases, SEC Filings, Investor Presentations, Microscopy society of America, Canadian Cytometry and
Microscopy Association, Chinese Electron Microcopy Society, Australian Microscopy and Microanalysis Society, Journal of
Microscopy, Journal of advanced Microscopy Research, Expert Interviews, and MarketsandMarkets Analysis
North America Europe Asia-Pacific RoW
2016 881.0 720.2 588.7 253.9
2021 1,265.5 1,104.8 1,007.7 380.2
CAGR 7.5% 8.9% 11.3% 8.4%
0
200
400
600
800
1,000
1,200
1,400
MarketSize(USDMillion)
93
MICROSCOPY MARKET – GLOBAL FORECAST TO 2021
© MarketsandMarkets
TABLE 57 MICROSCOPY MARKET SIZE FOR ACADEMIC INSTITUTES, BY REGION,
2014–2021 (USD MILLION)
Region 2014 2015 2016 2021
CAGR
(2016–2021)
North America 762.1 818.4 881.0 1,265.5 7.5%
Europe 607.6 660.9 720.2 1,104.8 8.9%
Asia-Pacific 473.7 527.5 588.7 1,007.7 11.3%
RoW 216.3 234.2 253.9 380.2 8.4%
Total 2,059.7 2,241.0 2,443.9 3,758.1 9.0%
Source: Annual Reports, Press Releases, SEC Filings, Investor Presentations, Microscopy society of America, Canadian Cytometry and
Microscopy Association, Chinese Electron Microcopy Society, Australian Microscopy and Microanalysis Society, Journal of
Microscopy, Journal of advanced Microscopy Research, Expert Interviews, and MarketsandMarkets Analysis
In 2016, North America is expected to account for the largest share of the microscopy market for academic
institutes. This regional segment is projected to reach USD 1,265.5 million by 2021 from USD 881.0
million in 2016, at a CAGR of 7.5% from 2016 to 2021.
TABLE 58 NORTH AMERICA: MICROSCOPY MARKET SIZE FOR ACADEMIC INSTITUTES, BY COUNTRY,
2014–2021 (USD MILLION)
Country 2014 2015 2016 2021
CAGR
(2016–2021)
U.S. 613.5 659.3 710.3 1,024.0 7.6%
Canada 148.6 159.1 170.7 241.4 7.2%
Total 762.1 818.4 881.0 1,265.5 7.5%
Source: Annual Reports, Press Releases, SEC Filings, Investor Presentations, Microscopy society of America, Canadian Cytometry and
Microscopy Association, Chinese Electron Microcopy Society, Australian Microscopy and Microanalysis Society, Journal of
Microscopy, Journal of advanced Microscopy Research, Expert Interviews, and MarketsandMarkets Analysis
In 2016, the U.S. is expected to account for the larger share of the North American microscopy market for
academic institutes. This country segment is projected to reach USD 1,024.0 million by 2021 from USD
710.3 million in 2016, at a higher CAGR of 7.6% from 2016 to 2021.
94
MICROSCOPY MARKET – GLOBAL FORECAST TO 2021
© MarketsandMarkets
TABLE 59 EUROPE: MICROSCOPY MARKET SIZE FOR ACADEMIC INSTITUTES, BY COUNTRY/REGION,
2014–2021 (USD MILLION)
Country/Region 2014 2015 2016 2021
CAGR%
(2016–2021)
Germany 161.1 180.3 201.7 351.4 11.7%
U.K. 88.3 97.8 108.5 181.9 10.9%
France 62.1 68.0 74.8 119.7 9.9%
RoE 296.2 314.8 335.2 451.7 6.1%
Total 607.6 660.9 720.2 1,104.8 8.9%
Source: Annual Reports, Press Releases, SEC Filings, Investor Presentations, Microscopy society of America, Canadian Cytometry and
Microscopy Association, Chinese Electron Microcopy Society, Australian Microscopy and Microanalysis Society, Journal of
Microscopy, Journal of advanced Microscopy Research, Expert Interviews, and MarketsandMarkets Analysis
In 2016, Germany is expected to account for the largest share of the European microscopy market for
academic institutes. This country segment is projected to reach USD 351.4 million by 2021 from USD
201.7 million in 2016, at a CAGR of 11.7% from 2016 to 2021
TABLE 60 ROW: MICROSCOPY MARKET SIZE FOR ACADEMIC INSTITUTES, BY COUNTRY/REGION,
2014 –2021 (USD MILLION)
Country/Region 2014 2015 2016 2021
CAGR
(2016–2021)
Brazil 90.4 98.2 106.8 162.2 8.7%
Mexico 54.5 58.2 62.2 86.6 6.8%
Argentina 20.5 22.5 24.6 38.7 9.5%
RoLA 50.8 55.3 60.3 92.6 9.0%
Total 216.3 234.2 253.9 380.2 8.4%
Source: Annual Reports, Press Releases, SEC Filings, Investor Presentations, Microscopy society of America, Canadian Cytometry and
Microscopy Association, Chinese Electron Microcopy Society, Australian Microscopy and Microanalysis Society, Journal of
Microscopy, Journal of advanced Microscopy Research, Expert Interviews, and MarketsandMarkets Analysis
In 2016, Brazil is expected to account for the largest share of the RoW microscopy market for academic
institutes. This country segment is projected to reach USD 162.2 million by 2021 from USD 106.8 million
in 2016, at a CAGR of 8.7% from 2016 to 2021.
95
MICROSCOPY MARKET – GLOBAL FORECAST TO 2021
© MarketsandMarkets
8.3 INDUSTRIES
The industries end-user segment comprises biotechnology and pharmaceutical, semiconductor, textile,
mining, and natural resources (such as oil and gas) industries. The rising focus on nanotechnology is a
prime driver for biotechnology and pharmaceutical companies. In medicine, nanotechnology is majorly
used in drug delivery, diagnostics, regenerative medicine, in vivo imaging, and anti-microbial techniques.
Currently, more than 250 biotechnology and pharmaceutical companies are involved in nanomedicine
research for achieving maximum therapeutic efficacy with minimal side effects. Examples of FDA-approved
nanomedicines are Doxil (by Sequus Pharmaceuticals (U.S.) in 1995, drug is currently part of Johnson &
Johnson (U.S.)) and Abraxane (by Abraxis Biosciences (U.S.) in 2005; currently part of Celgene Corporation
(U.S.)). Also, in April 2013, BIND Therapeutics, a U.S.–based biopharmaceutical company, entered into a
global collaboration agreement with Pfizer Inc. (U.S.) to develop and commercialize programmable
nanoparticles called Accurins.
Key companies in the microscopy market are concentrating on developing customized microscope
modules and solutions to cater to the needs of various industries. In April 2016, Carl Zeiss launched ZEISS
LSM 880, a confocal laser scanning microscope for material science and failure analysis. In July 2014, Carl
Zeiss unveiled Mineralogic Mining, a mineral analysis solution for the mining industry. The new system
comprises a scanning electron microscope with energy dispersive spectrometers to provide automated
analysis, rapid reports, and high resolution maps. Similarly, Leica Microsystem (Germany) offers products
such as Leica Z16 APO, Leica DM2700, and Leica DMS1000 for the energy, mining, and natural resources
industry.
The semiconductor industry is a major end user of advanced microscopes such as transmission electron
microscope and multi-photon confocal microscope. Growing demand for miniature transistor chips and
optoelectronics are major factors driving the microscopes market in the semiconductor industry.
Microscopes are used for research and development, quality control, process development, and failure
analysis. Eclipses LV150N, Eclipse LV150NL, and Eclipse L200N Series are examples of microscopes from
Nikon for the semiconductor industry.
FIGURE 33 NORTH AMERICA TO LEAD THE MICROSCOPY MARKET FOR INDUSTRIES DURING
THE FORECAST PERIOD
Source: Annual Reports, Press Releases, SEC Filings, Investor Presentations, Microscopy society of America, Canadian Cytometry and
Microscopy Association, Chinese Electron Microcopy Society, Australian Microscopy and Microanalysis Society, Journal of
Microscopy, Journal of advanced Microscopy Research, Expert Interviews, and MarketsandMarkets Analysis
North America Europe Asia-Pacific RoW
2016 511.5 418.1 341.8 147.4
2021 659.6 575.8 525.2 198.2
CAGR 5.2% 6.6% 9.0% 6.1%
0
100
200
300
400
500
600
700
MarketSize(USDMillion)
96
MICROSCOPY MARKET – GLOBAL FORECAST TO 2021
© MarketsandMarkets
TABLE 61 MICROSCOPY MARKET SIZE FOR INDUSTRIES, BY REGION, 2014–2021 (USD MILLION)
Region 2014 2015 2016 2021
CAGR
(2016–2021)
North America 462.4 485.8 511.5 659.6 5.2%
Europe 368.7 392.3 418.1 575.8 6.6%
Asia-Pacific 287.5 313.2 341.8 525.2 9.0%
RoW 131.2 139.0 147.4 198.2 6.1%
Total 1,249.8 1,330.3 1,418.7 1,958.8 6.7%
Source: Annual Reports, Press Releases, SEC Filings, Investor Presentations, Microscopy society of America, Canadian Cytometry and
Microscopy Association, Chinese Electron Microcopy Society, Australian Microscopy and Microanalysis Society, Journal of
Microscopy, Journal of advanced Microscopy Research, Expert Interviews, and MarketsandMarkets Analysis
In 2016, North America is expected to account for the largest share of the microscopy market for
industries. This regional segment is projected to reach USD 659.6 million by 2021 from USD 511.5 million
in 2016, at a CAGR of 5.2% from 2016 to 2021.
TABLE 62 NORTH AMERICA: MICROSCOPY MARKET SIZE FOR INDUSTRIES, BY COUNTRY,
2014–2021 (USD MILLION)
Country 2014 2015 2016 2021
CAGR
(2016–2021)
U.S. 372.3 391.4 412.3 533.7 5.3%
Canada 90.2 94.4 99.1 125.8 4.9%
Total 462.4 485.8 511.5 659.6 5.2%
Source: Annual Reports, Press Releases, SEC Filings, Investor Presentations, Microscopy society of America, Canadian Cytometry and
Microscopy Association, Chinese Electron Microcopy Society, Australian Microscopy and Microanalysis Society, Journal of
Microscopy, Journal of advanced Microscopy Research, Expert Interviews, and MarketsandMarkets Analysis
In 2016, the U.S. is expected to account the larger share of the North American microscopy market for
industries. This country segment is projected to reach USD 533.7 million by 2021 from USD 412.3 million
in 2016, at a CAGR of 5.3% from 2016 to 2021.
97
MICROSCOPY MARKET – GLOBAL FORECAST TO 2021
© MarketsandMarkets
TABLE 63 EUROPE: MICROSCOPY MARKET SIZE FOR INDUSTRIES, BY COUNTRY/REGION,
2014–2021 (USD MILLION)
Country/Region 2014 2015 2016 2021
CAGR
(2016–2021)
Germany 97.7 107.0 117.1 183.2 9.4%
U.K. 53.6 58.1 63.0 94.8 8.5%
France 37.7 40.4 43.4 62.4 7.5%
RoE 179.7 186.9 194.6 235.4 3.9%
Total 368.7 392.3 418.1 575.8 6.6%
Source: Annual Reports, Press Releases, SEC Filings, Investor Presentations, Microscopy society of America, Canadian Cytometry and
Microscopy Association, Chinese Electron Microcopy Society, Australian Microscopy and Microanalysis Society, Journal of
Microscopy, Journal of advanced Microscopy Research, Expert Interviews, and MarketsandMarkets Analysis
In 2016, Germany is expected to account for the largest share of the European microscopy market for
industries. This country segment is projected to reach USD 183.2 million by 2021 from USD 117.1 million
in 2016, at the highest CAGR of 9.4% from 2016 to 2021.
TABLE 64 ROW: MICROSCOPY MARKET SIZE FOR INDUSTRIES, BY COUNTRY/REGION,
2014–2021 (USD MILLION)
Country/Region 2014 2015 2016 2021
CAGR%
(2016–2021)
Brazil 54.9 58.3 62.0 84.6 6.4%
Mexico 33.1 34.5 36.1 45.2 4.6%
Argentina 12.5 13.3 14.3 20.2 7.1%
RoLA 30.8 32.8 35.0 48.3 6.6%
Total 131.2 139.0 147.4 198.2 6.1%
Source: Annual Reports, Press Releases, SEC Filings, Investor Presentations, Microscopy society of America, Canadian Cytometry and
Microscopy Association, Chinese Electron Microcopy Society, Australian Microscopy and Microanalysis Society, Journal of
Microscopy, Journal of advanced Microscopy Research, Expert Interviews, and MarketsandMarkets Analysis
In 2016, Brazil is expected to account for the largest share of the RoW microscopy market for industries.
This country segment is projected to reach USD 84.6 million by 2021 from USD 62.0 million in 2016, at a
CAGR of 6.4% from 2016 to 2021.
98
MICROSCOPY MARKET – GLOBAL FORECAST TO 2021
© MarketsandMarkets
8.4 OTHER END USERS (GOVERNMENT RESEARCH INSTITUTIONS AND
PRIVATE LABORATORIES)
The other end users segment includes government research institutions and private laboratories.
Government research institutes such as National Institute of Health (NIH, U.S.), National Cancer Institute
(NCI, U.S.), National Institute of Health and Nutrition (NIHN, Japan), and Oak Ridge National Laboratory
(ORNL, U.S.) are some pioneer research institutes actively involved in a number of research and
development programs that augment demand of microscopes.
Private laboratories include contract research organizations (CROs) and diagnostic and pathology
laboratories. CROs act as outsourcing partners for pharmaceutical and biotechnology companies and
academic research institutes. The microscopy services portfolio of CROs include services such as routine
and non-routine microscopy, image testing, experimentation, research projects, and development studies.
Factors such as high capital investment, dearth of trained staff for research, and reluctance of companies
to invest in changing technologies have increased the need for outsourcing microscopy and imaging
services by pharmaceutical companies and other industries.
FIGURE 34 NORTH AMERICA IS EXPECTED TO DOMINATE THE MICROSCOPY MARKET FOR
OTHER END USERS
Source: Annual Reports, Press Releases, SEC Filings, Investor Presentations, Microscopy society of America, Canadian Cytometry and
Microscopy Association, Chinese Electron Microcopy Society, Australian Microscopy and Microanalysis Society, Journal of
Microscopy, Journal of advanced Microscopy Research, Expert Interviews, and MarketsandMarkets Analysis
North America Europe Asia-Pacific RoW
2016 296.6 242.5 198.2 85.5
2021 340.0 296.8 270.7 102.1
CAGR 2.8% 4.1% 6.4% 3.6%
0
50
100
150
200
250
300
350
400
MarketSize(USDMillion)
99
MICROSCOPY MARKET – GLOBAL FORECAST TO 2021
© MarketsandMarkets
TABLE 65 MICROSCOPY MARKET SIZE FOR OTHER END USERS, BY REGION,
2014–2021 (USD MILLION)
Region 2014 2015 2016 2021
CAGR
(2016–2021)
North America 279.8 287.5 296.6 340.0 2.8%
Europe 223.1 232.1 242.5 296.8 4.1%
Asia-Pacific 173.9 185.3 198.2 270.7 6.4%
RoW 79.4 82.3 85.5 102.1 3.6%
Total 756.2 787.2 822.8 1,009.7 4.2%
Source: Annual Reports, Press Releases, SEC Filings, Investor Presentations, Microscopy society of America, Canadian Cytometry and
Microscopy Association, Chinese Electron Microcopy Society, Australian Microscopy and Microanalysis Society, Journal of
Microscopy, Journal of advanced Microscopy Research, Expert Interviews, and MarketsandMarkets Analysis
In 2016, North America is expected to account for the largest share of the microscopy market for other end
users. This regional segment is projected to reach USD 340.0 million by 2021 from USD 296.6 million in
2016, at a CAGR of 2.8% from 2016 to 2021.
TABLE 66 NORTH AMERICA: MICROSCOPY MARKET SIZE FOR OTHER END USERS, BY COUNTRY,
2014 –2021 (USD MILLION)
Country 2014 2015 2016 2021
CAGR%
(2016–2021)
U.S. 225.2 231.6 239.1 275.1 2.8%
Canada 54.6 55.9 57.5 64.9 2.4%
Total 279.8 287.5 296.6 340.0 2.8%
Source: Annual Reports, Press Releases, SEC Filings, Investor Presentations, Microscopy society of America, Canadian Cytometry and
Microscopy Association, Chinese Electron Microcopy Society, Australian Microscopy and Microanalysis Society, Journal of
Microscopy, Journal of advanced Microscopy Research, Expert Interviews, and MarketsandMarkets Analysis
In 2016, the U.S. is expected to account for the larger share of the North American microscopy market for
other end users. This country segment is projected to reach USD 275.1 million by 2021 from USD 239.1
million in 2016, at a CAGR of 2.8% from 2016 to 2021.
100
MICROSCOPY MARKET – GLOBAL FORECAST TO 2021
© MarketsandMarkets
TABLE 67 EUROPE: MICROSCOPY MARKET SIZE FOR OTHER END USERS, BY COUNTRY/REGION,
2014 –2021 (USD MILLION)
Country/Region 2014 2015 2016 2021
CAGR
(2016–2021)
Germany 59.1 63.3 67.9 94.4 6.8%
U.K. 32.4 34.4 36.5 48.9 6.0%
France 22.8 23.9 25.2 32.2 5.0%
RoE 108.7 110.6 112.9 121.4 1.5%
Total 223.1 232.1 242.5 296.8 4.1%
Source: Annual Reports, Press Releases, SEC Filings, Investor Presentations, Microscopy society of America, Canadian Cytometry and
Microscopy Association, Chinese Electron Microcopy Society, Australian Microscopy and Microanalysis Society, Journal of
Microscopy, Journal of advanced Microscopy Research, Expert Interviews, and MarketsandMarkets Analysis
In 2016, Germany is expected to account for the largest share of the European microscopy market for
other end users. This regional segment is projected to reach USD 94.4 million by 2021 from USD 67.9
million in 2016, at the highest CAGR of 6.8% from 2016 to 2021.
TABLE 68 ROW: MICROSCOPY MARKET SIZE FOR OTHER END USERS, BY COUNTRY/REGION,
2014–2021 (USD MILLION)
Country/Region 2014 2015 2016 2021
CAGR
(2016–2021)
Brazil 33.2 34.5 35.9 43.6 3.9%
Mexico 20.0 20.4 21.0 23.3 2.1%
Argentina 7.5 7.9 8.3 10.4 4.7%
RoLA 18.7 19.4 20.3 24.9 4.2%
Total 79.4 82.3 85.5 102.1 3.6%
Source: Annual Reports, Press Releases, SEC Filings, Investor Presentations, Microscopy society of America, Canadian Cytometry and
Microscopy Association, Chinese Electron Microcopy Society, Australian Microscopy and Microanalysis Society, Journal of
Microscopy, Journal of advanced Microscopy Research, Expert Interviews, and MarketsandMarkets Analysis
In 2016, Brazil is expected to account for the largest share of the RoW microscopy market for other end
users. This country segment is projected to reach USD 43.6 million by 2021 from USD 35.9 million in
2016, at a CAGR of 3.9% from 2016 to 2021.
101
MICROSCOPY MARKET – GLOBAL FORECAST TO 2021
© MarketsandMarkets
9 MICROSCOPY MARKET, BY REGION
KEY FINDINGS
 North America is expected to account for the largest share of 36.1% of the microscopy market
in 2016. This regional segment is expected to reach USD 2,265.1 million by 2021
 Technological advancements; favorable government funding; and growing inclination toward
nanotechnology are key drivers for the North American microscopy market
 The Asia-Pacific microscopy market is estimated to grow at the highest CAGR of 9.8% during the
forecast period, and is expected to reach USD 1,803.6 million by 2021
 Europe is expected to account for the second-largest share of 29.5% of the microscopy market
in 2016. This regional segment is expected to reach USD 1,977.4 million by 2021 from USD
1,380.8 million in 2016
 The RoW is expected to account for 10.4% of the microscopy market in 2016. This regional
segment is expected to reach USD 680.5 million by 2021 from USD 486.8 million in 2016
102
MICROSCOPY MARKET – GLOBAL FORECAST TO 2021
© MarketsandMarkets
9.1 INTRODUCTION
In this research report, the microscopy market has been divided into four major regions— North America,
Europe, Asia-Pacific, and the Rest of the World (RoW). The global microscopy market is expected to be
valued at an estimated USD 4,685.4 million in 2016, with North America accounting for the largest share
(36.1%), followed by Europe (29.5%).
The major drivers for growth of this market are availability of government and private funding, growing
focus on nanotechnology, and technological advancements in this market. On the other hand, high cost of
advanced microscopes, implementation of excise tax by the U.S. government, huge custom duties charged
(nearly 28%) on medical devices in countries such as India and Brazil, and the economic downturn in
European countries are hindering market growth.
Emerging markets such as China, India, Brazil, and the Middle East are expected to present significant
growth opportunities for stakeholders. In addition, new application areas such as optogenetics;
nanomedicine; quantum dots; nanoelectronics and nanocrystalline materials; and the combination of
microscopy with spectroscopy; are further expected to drive the market in the coming years.
FIGURE 35 GEOGRAPHIC SNAPSHOT: ASIA-PACIFIC TO GROW AT THE FASTEST RATE DURING
THE FORECAST PERIOD
Source: Annual Reports, Press Releases, SEC Filings, Investor Presentations, Expert Interviews, and MarketsandMarkets Analysis
Asia-Pacific
9.8%
Rest of the World
6.9%
Europe
7.4%North America
6.0%
>7.0%
High Growth
6.0%-7.0%
Medium Growth
103
MICROSCOPY MARKET – GLOBAL FORECAST TO 2021
© MarketsandMarkets
FIGURE 36 ASIA-PACIFIC OFFERS SIGNIFICANT GROWTH OPPORTUNITIES FOR ALL
MICROCOPY PRODUCT CATEGORIES DURING THE FORECAST PERIOD
Source: Annual Reports, Press Releases, SEC Filings, Investor Presentations, Expert Interviews, and MarketsandMarkets Analysis
TABLE 69 MICROSCOPY MARKET SIZE, BY REGION, 2014–2021 (USD MILLION)
Region 2014 2015 2016 2021
CAGR
(2016–2021)
North America 1,504.3 1,591.8 1,689.1 2,265.1 6.0%
Europe 1,199.4 1,285.3 1,380.8 1,977.4 7.4%
Asia-Pacific 935.1 1,026.0 1,128.7 1,803.6 9.8%
RoW 426.9 455.5 486.8 680.5 6.9%
Total 4,065.8 4,358.6 4,685.4 6,726.5 7.5%
Source: Annual Reports, Press Releases, SEC Filings, Investor Presentations, Microscopy Society of America, Canadian Cytometry and
Microscopy Association, Chinese Electron Microcopy Society, Australian Microscopy and Microanalysis Society, Journal of
Microscopy, Journal of Advanced Microscopy Research, Expert Interviews, and MarketsandMarkets Analysis
North America is expected to account for the largest share of the global microscopy market in 2016. This
regional segment is projected to reach USD 2,265.1 million by 2021 from USD 1,689.1 million in 2016, at
a CAGR of 6.0% from 2016 to 2021.
AFRICA
EUROPE ASIA-PACIFICNORTH AMERICA RoWPRODUCT
HIGH
8.1%-10.9%
MEDIUM
5.1%-7.9%
CAGR (%) from
2016 to 2021
VERY HIGH
11.1%-13.9%
OPTICAL MICROSCOPES
ELECTRON MICROSCOPES
CONFOCAL MICROSCOPES
SCANNING PROBE MICROSCOPES
SLOW
<5
104
MICROSCOPY MARKET – GLOBAL FORECAST TO 2021
© MarketsandMarkets
9.2 NORTH AMERICA
In 2016, North America is expected to account for the largest share of 36.1% of the global microscopy
market. North America comprises the U.S. and Canada. The U.S. is expected to account for approximately
81% of the microscopy market by the end of 2016, while Canada is expected to account for the remaining
approximately 19%.
Factors such as increasing investment in nanotechnology research in the U.S. and Canada are responsible
for driving market growth in North America. Globally, the U.S. government is the major contributor to
nanotechnology research and development funding. In 2000, the Federal government launched the
National Nanotechnology Initiative (NNI) and allocated funds worth approximately USD 17.9 billion for
nanotechnology research and development from 2001 to 2013. For 2016, the government proposed a
budget of USD 1.5 billion in NNI funding. Nearly 1,200 organizations (companies, universities, and
government laboratories) across the U.S. are involved in the research, development, and
commercialization of nanotechnology-based products. Since 2009, there has been a 50% rise in the
number of nanotechnology organizations operating in the U.S. States such as California, Massachusetts,
New York, Texas, and Ohio have the highest number of nanotechnology organizations in the country. The
U.S. Department of Energy (DOE) has also opened five facilities, called Nanoscale Science Research
Centers (NSRCs), around the country that are involved in the development and characterization of novel
nanomaterials. These centers are:
 The Argonne National Laboratory in Illinois
 The Brookhaven National Laboratory in New York
 The Lawrence Berkeley National Laboratory in California
 The Oak Ridge National Laboratory in Tennessee
 The Sandia National Laboratories in New Mexico
Canada is a potential market for microscopy owing to government support and growing academic
excellence. The Canadian government works in close association with provincial governments, universities,
and national institutes to support and promote nanotechnology-based research and development
programs across the nation. Nearly 200 companies are engaged in nanotechnology-related businesses in
Canada. Major nanotechnology industries are concentrated in the Canadian provinces of Alberta, British
Columbia, Ontario, and Quebec.
The major companies operating in this region are Bruker (U.S.), Carl Zeiss AG (Germany), FEI Co. (U.S.),
Leica Microsystems (Germany), Nikon (Japan), Olympus Corporation (Japan), and Tescan (The Czech
Republic).
105
MICROSCOPY MARKET – GLOBAL FORECAST TO 2021
© MarketsandMarkets
FIGURE 37 NORTH AMERICA: MICROSCOPY MARKET SNAPSHOT, 2016
Source: Annual Reports, Press Releases, SEC Filings, Investor Presentations, Microscopy Society of America, Canadian Cytometry and
Microscopy Association, Chinese Electron Microcopy Society, Australian Microscopy and Microanalysis Society, Journal of
Microscopy, Journal of Advanced Microscopy Research, Expert Interviews, and MarketsandMarkets Analysis
NORTH AMERICA
NORTH AMERICA: MICROSCOPY MARKET SIZE,
BY END USER, 2016 vs 2021 (USD MILLION)
NORTH AMERICA: MICROSCOPY MARKET, BY COUNTRY,
2016
COUNTRY
MARKET SIZE
(USD MILLION)
CAGR
(2016-2021)
U.S. 1,361.8 6.1%
Canada 327.3 5.7%
NORTH AMERICA: MICROSCOPY MARKET
FACTORSSUPPORTING THE GROWTH OF
THE MICROSCOPYMARKET IN NORTH AMERICA
• Increasing investments in nanotechnology research
• Favorable government support and growing
academic excellence
NORTH AMERICA: MICROSCOPY MARKET SIZE,
BY APPLICATION, 2016 (USD MILLION)
North America to account
for 36.1% of the global
microscopy market in 2016
U.S. to command ~81% of
the North American
microscopy market in 2016
SEMICONDUCTORS LIFE SCIENCES
USD 592.7 Million USD 578.5 Million
Canada to hold ~19% of
the North American
microscopy market in 2016
The market in the U.S. is
expected to grow at a higher
CAGR of 6.1% (2016–2021)
MATERIAL SCIENCES NANOTECHNOLOGY
USD 322.6 Million USD 195.2 Million
881.0
511.5
296.6
1,265.5
659.6
340.0
Academic
Institutes
Industries Others*
2016 2021
106
MICROSCOPY MARKET – GLOBAL FORECAST TO 2021
© MarketsandMarkets
TABLE 70 NORTH AMERICA: MICROSCOPY MARKET SIZE, BY PRODUCT, 2014-2021 (USD MILLION)
Product 2014 2015 2016 2021
CAGR
(2016–2021)
Optical Microscopes 594.2 615.2 638.0 758.3 3.5%
Electron Microscopes 558.1 608.4 664.1 1,027.0 9.1%
SPM 212.1 220.8 230.2 278.4 3.9%
Confocal Microscopes 139.9 147.4 156.7 201.4 5.1%
Total 1,504.3 1,591.8 1,689.1 2,265.1 6.0%
Source: Annual Reports, Press Releases, SEC Filings, Investor Presentations, Microscopy Society of America, Canadian Cytometry and
Microscopy Association, Chinese Electron Microcopy Society, Australian Microscopy and Microanalysis Society, Journal of
Microscopy, Journal of Advanced Microscopy Research, Expert Interviews, and MarketsandMarkets Analysis
In 2016, the electron microscopes segment is expected to account for the largest share of the North
American microscopy market. This product segment is projected to reach USD 1,027.0 million by 2021
from USD 664.1 million in 2016, at a CAGR of 9.1% during the forecast period.
TABLE 71 NORTH AMERICA: OPTICAL MICROSCOPES MARKET SIZE, BY TYPE,
2014-2021 (USD MILLION)
Type 2014 2015 2016 2021
CAGR
(2016–2021)
Fluorescence Microscopes 442.7 448.2 455.1 475.9 0.9%
Super-resolution Microscopes 151.5 167.0 182.9 282.5 9.1%
Total 594.2 615.2 638.0 758.3 3.5%
Source: Annual Reports, Press Releases, SEC Filings, Investor Presentations, Microscopy Society of America, Canadian Cytometry and
Microscopy Association, Chinese Electron Microcopy Society, Australian Microscopy and Microanalysis Society, Journal of
Microscopy, Journal of Advanced Microscopy Research, Expert Interviews, and MarketsandMarkets Analysis
In 2016, the fluorescence microscopes segment is expected to account for the larger share of the North
American optical microscopes market. This segment is projected to reach USD 475.9 million by 2021 from
USD 455.1 million in 2016, at a CAGR of 0.9% during the forecast period.
TABLE 72 NORTH AMERICA: ELECTRON MICROSCOPES MARKET SIZE, BY TYPE,
2014-2021 (USD MILLION)
Type 2014 2015 2016 2021
CAGR
(2016–2021)
SEM 435.9 475.7 520.0 809.2 9.2%
Transmission Electron
Microscopes 122.2 132.6 144.1 217.7 8.6%
Total 558.1 608.4 664.1 1,027.0 9.1%
Source: Annual Reports, Press Releases, SEC Filings, Investor Presentations, Microscopy Society of America, Canadian Cytometry and
Microscopy Association, Chinese Electron Microcopy Society, Australian Microscopy and Microanalysis Society, Journal of
Microscopy, Journal of Advanced Microscopy Research, Expert Interviews, and MarketsandMarkets Analysis
In 2016, the SEM segment is expected to account for the larger share of the electron microscopes market
in North America. This segment is projected to reach USD 809.2 million by 2021 from USD 520.0 million in
2016, at a CAGR of 9.2% during the forecast period.
107
MICROSCOPY MARKET – GLOBAL FORECAST TO 2021
© MarketsandMarkets
TABLE 73 NORTH AMERICA: SPM MARKET SIZE, BY TYPE, 2014-2021 (USD MILLION)
Type 2014 2015 2016 2021
CAGR
(2016–2021)
STM 146.1 152.0 158.5 191.5 3.9%
AFM 55.7 58.0 60.5 73.3 3.9%
Near-field Scanning Microscopes 10.3 10.7 11.1 13.5 4.0%
Total 212.1 220.8 230.2 278.4 3.9%
Source: Annual Reports, Press Releases, SEC Filings, Investor Presentations, Microscopy Society of America, Canadian Cytometry and
Microscopy Association, Chinese Electron Microcopy Society, Australian Microscopy and Microanalysis Society, Journal of
Microscopy, Journal of Advanced Microscopy Research, Expert Interviews, and MarketsandMarkets Analysis
In 2016, the STM segment is expected to account for the largest share of the SPM market in North
America. This segment is projected to reach USD 191.5 million by 2021 from USD 158.5 million in 2016,
at a CAGR of 3.9% during the forecast period.
TABLE 74 NORTH AMERICA: MICROSCOPY MARKET SIZE, BY APPLICATION,
2014-2021 (USD MILLION)
Application 2014 2015 2016 2021
CAGR
(2016–2021)
Semiconductors 526.5 558.4 592.7 798.5 6.1%
Life Sciences 511.5 543.4 578.5 792.4 6.5%
Material Sciences 300.9 310.3 322.6 377.5 3.2%
Nanotechnology 165.5 179.6 195.2 296.7 8.7%
Total 1,504.3 1,591.8 1,689.1 2,265.1 6.0%
Source: Annual Reports, Press Releases, SEC Filings, Investor Presentations, Microscopy Society of America, Canadian Cytometry and
Microscopy Association, Chinese Electron Microcopy Society, Australian Microscopy and Microanalysis Society, Journal of
Microscopy, Journal of Advanced Microscopy Research, Expert Interviews, and MarketsandMarkets Analysis
In 2016, the semiconductors segment is expected to account for the largest share of the microscopy
market in North America. This application segment is projected to reach USD 798.5 million by 2021 from
USD 592.7 million in 2016, at a CAGR of 6.1% during the forecast period.
108
MICROSCOPY MARKET – GLOBAL FORECAST TO 2021
© MarketsandMarkets
TABLE 75 NORTH AMERICA: MICROSCOPY MARKET SIZE, BY END USER, 2014-2021 (USD MILLION)
End User 2014 2015 2016 2021
CAGR
(2016–2021)
Academic Institutes 762.1 818.4 881.0 1,265.5 7.5%
Industries 462.4 485.8 511.5 659.6 5.2%
Other End Users* 279.8 287.5 296.6 340.0 2.8%
Total 1,504.3 1,591.7 1,689.1 2,265.1 6.0%
*Note: The other end users segment includes government research institutes and private laboratories.
Source: Annual Reports, Press Releases, SEC Filings, Investor Presentations, Microscopy Society of America, Canadian Cytometry and
Microscopy Association, Chinese Electron Microcopy Society, Australian Microscopy and Microanalysis Society, Journal of
Microscopy, Journal of Advanced Microscopy Research, Expert Interviews, and MarketsandMarkets Analysis
In 2016, the academic institutes segment is expected to account for the largest share of the microscopy
market in North America. This end-user segment is projected to reach USD 1,265.5 million by 2021 from
USD 881.0 million in 2016, at the highest CAGR of 7.5% during the forecast period.
TABLE 76 NORTH AMERICA: MICROSCOPY MARKET SIZE, BY COUNTRY, 2014-2021 (USD MILLION)
Country 2014 2015 2016 2021
CAGR
(2016–2021)
U.S. 1,211.0 1,282.3 1,361.8 1,832.9 6.1%
Canada 293.3 309.4 327.3 432.2 5.7%
Total 1,504.3 1,591.7 1,689.1 2,265.0 6.0%
Source: Annual Reports, Press Releases, SEC Filings, Investor Presentations, Microscopy Society of America, Canadian Cytometry and
Microscopy Association, Chinese Electron Microcopy Society, Australian Microscopy and Microanalysis Society, Journal of
Microscopy, Journal of Advanced Microscopy Research, Expert Interviews, and MarketsandMarkets Analysis
The U.S. is expected to account for the larger share of the North American microscopy market in 2016. This
segment is projected to reach USD 1,832.9 million by 2021 from USD 1,361.8 million in 2016, at a CAGR
of 6.1% from 2016 to 2021.
9.2.1 U.S.
The U.S. is expected to account for the larger share of the North American microscopy market in 2016.
Factors such as a favorable government funding environment and growing focus on nanotechnology are
major drivers for this market. In addition to nanotechnology, the U.S. is also a world leader in
pharmaceutical and biotechnology research, accounting for around one-third of research and development
investment globally. The country is also prominent in the chemical industry sector. The presence of strong
nanotechnology and life sciences research and development infrastructure is a key factor driving
microscopy market in the U.S.
However, from January 2013, the U.S. government imposed an excise tax of 2.3% on Class I, II, and III
medical devices, under the Patient Protection and Affordable Care Act (PPACA). This tax is applicable for all
medical devices manufactured or imported in the U.S. Due to this, the market for some automated medical
devices, including medical imaging equipment (such as microscopes), will be affected in the U.S. This tax
will result in lower profits for manufacturers as well as lower reimbursements from payers for procedures
that use these devices. This may hinder growth of the U.S. microscopy market. As the U.S. accounts for a
major share of the global microscopy market, this move is also expected to affect the global market.
109
MICROSCOPY MARKET – GLOBAL FORECAST TO 2021
© MarketsandMarkets
TABLE 77 U.S.: MICROSCOPY MARKET SIZE, BY PRODUCT, 2014-2021 (USD MILLION)
Product 2014 2015 2016 2021
CAGR
(2016–2021)
Optical Microscopes 478.3 495.6 514.3 613.7 3.6%
Electron Microscopes 449.3 490.1 535.4 831.0 9.2%
SPM 170.8 177.9 185.6 225.3 3.9%
Confocal Microscopes 112.6 118.7 126.4 162.9 5.2%
Total 1,211.0 1,282.3 1,361.8 1,832.9 6.1%
Source: Annual Reports, Press Releases, SEC Filings, Investor Presentations, Microscopy Society of America, Canadian Cytometry and
Microscopy Association, Chinese Electron Microcopy Society, Australian Microscopy and Microanalysis Society, Journal of
Microscopy, Journal of Advanced Microscopy Research, Expert Interviews, and MarketsandMarkets Analysis
In 2016, the electron microscopes segment is expected to account for the largest share of the microscopy
market in the U.S. This product segment is projected to reach USD 831.0 million by 2021 from USD 535.4
million in 2016, at the highest CAGR of 9.2% during the forecast period.
FIGURE 38 SEMICONDUCTORS APPLICATION SEGMENT TO DOMINATE THE U.S.
MICROSCOPY MARKET DURING THE FORECAST PERIOD
Source: Annual Reports, Press Releases, SEC Filings, Investor Presentations Expert Interviews, and MarketsandMarkets Analysis
Semiconductors Life Sciences Material Sciences Nanotechnology
2016 477.9 466.4 260.1 157.4
2021 646.1 641.2 305.4 240.1
CAGR 6.2% 6.5% 3.2% 8.8%
0
100
200
300
400
500
600
700
MarketSize(USDMillion)
110
MICROSCOPY MARKET – GLOBAL FORECAST TO 2021
© MarketsandMarkets
TABLE 78 U.S.: MICROSCOPY MARKET SIZE, BY APPLICATION, 2014-2021 (USD MILLION)
Application 2014 2015 2016 2021
CAGR
(2016–2021)
Semiconductors 423.8 449.8 477.9 646.1 6.2%
Life Sciences 411.7 437.8 466.4 641.2 6.6%
Material Sciences 242.2 250.0 260.1 305.4 3.3%
Nanotechnology 133.2 144.7 157.4 240.1 8.8%
Total 1,211.0 1,282.3 1,361.7 1,832.9 6.1%
Source: Annual Reports, Press Releases, SEC Filings, Investor Presentations, Microscopy Society of America, Canadian Cytometry and
Microscopy Association, Chinese Electron Microcopy Society, Australian Microscopy and Microanalysis Society, Journal of
Microscopy, Journal of Advanced Microscopy Research, Expert Interviews, and MarketsandMarkets Analysis
In 2016, the semiconductors segment is expected to account for the largest share of the microscopy
market in the U.S. This application segment is projected to reach USD 646.1 million by 2021 from USD
477.9 million in 2016, at a CAGR of 6.2% during the forecast period.
TABLE 79 U.S.: MICROSCOPY MARKET SIZE, BY END USER, 2014-2021 (USD MILLION)
End User 2014 2015 2016 2021
CAGR
(2016–2021)
Academic Institutes 613.5 659.3 710.3 1,024.0 7.6%
Industries 372.3 391.4 412.3 533.7 5.3%
Other End Users 225.2 231.6 239.1 275.1 2.8%
Total 1,211.0 1,282.3 1,361.7 1,832.9 6.1%
Source: Annual Reports, Press Releases, SEC Filings, Investor Presentations, Microscopy Society of America, Canadian Cytometry and
Microscopy Association, Chinese Electron Microcopy Society, Australian Microscopy and Microanalysis Society, Journal of
Microscopy, Journal of Advanced Microscopy Research, Expert Interviews, and MarketsandMarkets Analysis
In 2016, the academic institutes segment is expected to account for the largest share of the microscopy
market in the U.S. This end-user segment is projected to reach USD 1,024.0 million by 2021 from USD
710.3 million in 2016, at the highest CAGR of 7.6% during the forecast period.
9.2.2 CANADA
In Canada, nanotechnology research and development programs are led by the Federal government,
provincial governments, universities, and national institutes. For instance, nine institutes of the National
Research Council (NRC) are conducting research and development activities in nanotechnology, and
around 200 companies are engaged in nanotechnology-related businesses in Canada. In 2001, the
National Institute of Nanotechnology (NINT) was established as a joint venture between the Federal
government, the Alberta provincial government, and the University of Alberta to support and boost
nanotechnology research and economic development in the province. Similarly, provincial initiatives such
as NanoQuébec and nanoFAB are driving growth of nanotechnology infrastructure in Canada. NanoQuébec
is a consortium of six universities and research centers in Quebec that offer technology support to local
small and medium-sized enterprises (SMEs) dealing in nanotechnology. nanoFAB is an open-access
fabrication and characterization facility that provides equipment, infrastructure, and assistance to local
microelectromechanical systems (MEMS) industries and nanotechnology researchers.
111
MICROSCOPY MARKET – GLOBAL FORECAST TO 2021
© MarketsandMarkets
Furthermore, a Federal government interdepartmental network was established in 2003 for promoting
nanotechnology in the region. The Natural Sciences and Engineering Research Council of Canada (NSERC),
the Canadian Institutes of Health Research (CIHR), and the Canada Foundation for Innovation (CFI) also
allocate funds to promote research in nanotechnology.
TABLE 80 CANADA: MICROSCOPY MARKET SIZE, BY PRODUCT, 2014-2021 (USD MILLION)
Product 2014 2015 2016 2021
CAGR
(2016–2021)
Optical Microscopes 115.9 119.6 123.6 144.7 3.2%
Electron Microscopes 108.8 118.3 128.7 195.9 8.8%
SPM 41.4 42.9 44.6 53.1 3.5%
Confocal Microscopes 27.3 28.7 30.4 38.4 4.8%
Total 293.3 309.4 327.3 432.2 5.7%
Source: Annual Reports, Press Releases, SEC Filings, Investor Presentations, Microscopy Society of America, Canadian Cytometry and
Microscopy Association, Chinese Electron Microcopy Society, Australian Microscopy and Microanalysis Society, Journal of
Microscopy, Journal of Advanced Microscopy Research, Expert Interviews, and MarketsandMarkets Analysis
In 2016, the electron microscopes segment is expected to account for the largest share of the microscopy
market in Canada. This segment is projected to reach USD 195.9 million by 2021 from USD 128.7 million
in 2016, at the highest CAGR of 8.8% during the forecast period.
TABLE 81 CANADA: MICROSCOPY MARKET SIZE, BY APPLICATION, 2014-2021 (USD MILLION)
Application 2014 2015 2016 2021
CAGR
(2016–2021)
Semiconductors 102.7 108.5 114.9 152.3 5.8%
Life Sciences 99.7 105.6 112.1 151.2 6.2%
Material Sciences 58.7 60.3 62.5 72.0 2.9%
Nanotechnology 32.3 34.9 37.8 56.6 8.4%
Total 293.3 309.4 327.3 432.1 5.7%
Source: Annual Reports, Press Releases, SEC Filings, Investor Presentations, Microscopy Society of America, Canadian Cytometry and
Microscopy Association, Chinese Electron Microcopy Society, Australian Microscopy and Microanalysis Society, Journal of
Microscopy, Journal of Advanced Microscopy Research, Expert Interviews, and MarketsandMarkets Analysis
In 2016, the semiconductors segment is expected to account for the largest share of the microscopy
market in Canada. This application segment is projected to reach USD 152.3 million by 2021 from USD
114.9 million in 2016, at a CAGR of 5.8% during the forecast period.
112
MICROSCOPY MARKET – GLOBAL FORECAST TO 2021
© MarketsandMarkets
FIGURE 39 ACADEMIC INSTITUTES END-USER SEGMENT TO ACCOUNT FOR THE LARGEST
SHARE OF THE CANADIAN MICROSCOPY MARKET IN 2016
Source: Annual Reports, Press Releases, SEC Filings, Investor Presentations Expert Interviews, and MarketsandMarkets Analysis
TABLE 82 CANADA: MICROSCOPY MARKET SIZE, BY END USER, 2014-2021 (USD MILLION)
End User 2014 2015 2016 2021
CAGR
(2016–2021)
Academic Institutes 148.6 159.1 170.7 241.4 7.2%
Industries 90.2 94.4 99.1 125.8 4.9%
Others 54.6 55.9 57.5 64.9 2.4%
Total 293.3 309.4 327.3 432.2 5.7%
Source: Annual Reports, Press Releases, SEC Filings, Investor Presentations, Microscopy Society of America, Canadian Cytometry and
Microscopy Association, Chinese Electron Microcopy Society, Australian Microscopy and Microanalysis Society, Journal of
Microscopy, Journal of Advanced Microscopy Research, Expert Interviews, and MarketsandMarkets Analysis
In 2016, the academic institutes segment is expected to account for the largest share of the microscopy
market in Canada. This end-user segment is projected to reach USD 241.4 million by 2021 from USD
170.7 million in 2016, at a CAGR of 7.2% during the forecast period.
Academic Institutes Industries Other End Users
2016 170.7 99.1 57.5
2021 241.4 125.8 64.9
CAGR 7.1% 4.8% 2.4%
0
50
100
150
200
250
300
MarketSize(USDMillion)
113
MICROSCOPY MARKET – GLOBAL FORECAST TO 2021
© MarketsandMarkets
9.3 EUROPE
Europe is expected to account for the second-largest share of 29.5% of the global microscopy market in
2016. In 2014, about 10.4% of the European gross domestic product (GDP) was spent on healthcare; of
this; nearly 7.5% was spent on medical devices. Increasing government support in the form of funding for
research is the major factor responsible for growth of the European microscopy market. The European
Commission (EC) supports nanoscience and nanotechnology through the European Research Council
(ERC). Until 2013, funding for research and development in nanotechnology was covered under the
Seventh Framework Programme (FP7), which, during 2007-2013, spent around USD 69.4 billion to boost
nanoscience-related programs in the region. In 2014, the FP7 was superseded by a new funding initiative,
Horizon 2020. The Horizon 2020 initiative aims to transform Europe over the next seven-year period (2014
to 2020) into a dynamic and competitive knowledge-based economy. It is the largest EU research and
innovation program, with nearly USD 107.6 billion (€80 billion) available in funding, in addition to private
investment. In July 2005, the EU, as a part of the nanotechnology initiative, formed a framework for
nanotechnology activities within Europe, called the Nanoforum. It acts as a central location for all
nanotechnology activities within the European community. Furthermore, the European Nanotechnology
Trade Alliance was also formed to oversee and bridge gaps within nanotechnology research in Europe.
Germany has the highest public sector investment in nanotechnology, in comparison to other European
countries. About half of all European nanotechnology companies are based in Germany. Germany’s
nanotechnology development is guided by the Nano Initiative Action Plan 2010.
As a result of favorable government and corporate support, many key industry participants are expanding
their microscopy business in Europe. For instance, in September 2014, FEI Co. (U.S.) opened a new state-
of-the art facility in the Czech Republic. Nearly 600 people are expected to be employed in this facility,
which will produce approximately 60% of the company’s electron microscopes.
Growth in the biotechnology industry in countries such as Germany and the U.K. is another major growth
contributor for the European microscopy market. Other countries that are expected to contribute
significantly include the Netherlands, France, Italy, and Belgium. Many societies have been formed in
Europe to support the microscopy industry, such as the Belgian Society for Microscopy (BSM). The BSM
aims to support microscopy in all aspects and promote interaction between its members in Europe and the
world.
The European region is currently undergoing an economic downturn, which is a major factor restraining
growth of the microscopy market in this region. However, despite the aforementioned factor, the European
microscopy market is expected to grow at a modest rate during the forecast period.
The key companies operating in this region are Bruker (U.S.), Carl Zeiss AG (Germany), Danish Micro
Engineering A/S (Denmark), FEI Co. (U.S.), Hitachi High-Technologies (Japan), Leica Microsystems
(Germany), Nikon (Japan), and Olympus Corporation (Japan).
114
MICROSCOPY MARKET – GLOBAL FORECAST TO 2021
© MarketsandMarkets
FIGURE 40 EUROPE: MICROSCOPY MARKET SNAPSHOT, 2016
Source: Annual Reports, Press Releases, SEC Filings, Investor Presentations Expert Interviews, and MarketsandMarkets Analysis
EUROPE
EUROPE: MICROSCOPY MARKET SIZE,
BY END USER, 2016 vs 2021 (USD MILLION)
EUROPE: MICROSCOPY MARKET, BY PRODUCT,
2016 vs 2021 (USD MILLION)
PRODUCT 2016 2021
Electron Microscopes 542.9 896.5
Optical Microscopes 521.5 662.0
Scanning Probe
Microscopes
188.2 243.0
Confocal Microscopes 128.1 175.8
FACTORS SUPPORTING THE GROWTH OF
THE MICROSCOPY MARKET IN EUROPE
• Increasing government support
• Growing focus on nanotechnology
EUROPE: MICROSCOPYMARKET SIZE,
BY APPLICATION,2016
This geographic segment is estimated to grow
at a CAGR of 7.4% from 2016 to 2021
Europe holds 29.5%
of the global microscopy market in 2016
USD 484.5 Million USD 253.8 Million
SEMICONDUCTORS LIFE SCIENCES
720.2
418.1
242.5
1,104.8
575.8
296.8
Academic
Institutes
Industries Others*
2016 2021
USD 263.7 Million USD 253.8 Million
MATERIAL
SCIENCES
NANOTECHNOLOGY
USD 159.6 Million
USD 472.9 Million
115
MICROSCOPY MARKET – GLOBAL FORECAST TO 2021
© MarketsandMarkets
FIGURE 41 ELECTRON MICROSCOPY TO GROW AT THE HIGHEST RATE IN THE EUROPEAN
MICROSCOPY MARKET DURING THE FORECAST PERIOD
Source: Annual Reports, Press Releases, SEC Filings, Investor Presentations Expert Interviews, and MarketsandMarkets Analysis
TABLE 83 EUROPE: MICROSCOPY MARKET SIZE, BY PRODUCT, 2014-2021 (USD MILLION)
Product 2014 2015 2016 2021
CAGR
(2016–2021)
Optical Microscopes 473.8 496.8 521.5 662.0 4.9%
Electron Microscopes 445.0 491.3 542.9 896.5 10.6%
SPM 169.1 178.3 188.2 243.0 5.2%
Confocal Microscopes 111.5 119.0 128.1 175.8 6.5%
Total 1,199.4 1,285.3 1,380.8 1,977.4 7.4%
Source: Annual Reports, Press Releases, SEC Filings, Investor Presentations, Microscopy Society of America, Canadian Cytometry and
Microscopy Association, Chinese Electron Microcopy Society, Australian Microscopy and Microanalysis Society, Journal of
Microscopy, Journal of Advanced Microscopy Research, Expert Interviews, and MarketsandMarkets Analysis
In 2016, the electron microscopes segment is expected to account for the largest share of the microscopy
market in Europe. This segment is projected to reach USD 896.5 million by 2021 from USD 542.9 million
in 2016, at the highest CAGR of 10.6% during the forecast period.
Electron Microcsopes Optical Microcsopes
Scanning Probe
Microcsopes
Confocal Microcsopes
2016 542.9 521.5 188.2 128.1
2021 896.5 662.0 243.0 175.8
CAGR 10.5% 4.8% 5.2% 6.5%
0
100
200
300
400
500
600
700
800
900
1,000
MarketSize(USDMillion)
116
MICROSCOPY MARKET – GLOBAL FORECAST TO 2021
© MarketsandMarkets
TABLE 84 EUROPE: OPTICAL MICROSCOPES MARKET SIZE, BY TYPE, 2014-2021 (USD MILLION)
Type 2014 2015 2016 2021
CAGR
(2016–2021)
Fluorescence Microscopes 353.0 361.9 372.0 415.4 2.2%
Super-resolution Microscopes 120.8 134.9 149.5 246.6 10.5%
Total 473.8 496.8 521.5 662.0 4.9%
Source: Annual Reports, Press Releases, SEC Filings, Investor Presentations, Microscopy Society of America, Canadian Cytometry and
Microscopy Association, Chinese Electron Microcopy Society, Australian Microscopy and Microanalysis Society, Journal of
Microscopy, Journal of Advanced Microscopy Research, Expert Interviews, and MarketsandMarkets Analysis
In 2016, the fluorescence microscopes segment is expected to account for the larger share of the optical
microscopes market in Europe. This segment is projected to reach USD 415.4 million by 2021 from USD
372.0 million in 2016, at a CAGR of 2.2% during the forecast period.
TABLE 85 EUROPE: ELECTRON MICROSCOPES MARKET SIZE, BY TYPE, 2014-2021 (USD MILLION)
Type 2014 2015 2016 2021
CAGR
(2016–2021)
SEM 347.5 384.2 425.1 706.5 10.7%
Transmission Electron
Microscopes 97.5 107.1 117.8 190.1 10.0%
Total 445.0 491.2 542.9 896.5 10.6%
Source: Annual Reports, Press Releases, SEC Filings, Investor Presentations, Microscopy Society of America, Canadian Cytometry and
Microscopy Association, Chinese Electron Microcopy Society, Australian Microscopy and Microanalysis Society, Journal of
Microscopy, Journal of Advanced Microscopy Research, Expert Interviews, and MarketsandMarkets Analysis
In 2016, the SEM segment is expected to account for the larger share of the electron microscopes market
in Europe. This segment is projected to reach USD 706.5 million by 2021 from USD 425.1 million in 2016,
at a CAGR of 10.7% during the forecast period.
TABLE 86 EUROPE: SPM MARKET SIZE, BY TYPE, 2014-2021 (USD MILLION)
Type 2014 2015 2016 2021
CAGR
(2016–2021)
STM 116.5 122.7 129.6 167.2 5.2%
AFM 44.4 46.9 49.5 64.0 5.3%
Near-field Scanning Microscopes 8.2 8.7 9.1 11.8 5.3%
Total 169.1 178.3 188.2 243.0 5.2%
Source: Annual Reports, Press Releases, SEC Filings, Investor Presentations, Microscopy Society of America, Canadian Cytometry and
Microscopy Association, Chinese Electron Microcopy Society, Australian Microscopy and Microanalysis Society, Journal of
Microscopy, Journal of Advanced Microscopy Research, Expert Interviews, and MarketsandMarkets Analysis
In 2016, the STM segment is expected to account for the largest share of the SPM market in Europe. This
segment is projected to reach USD 167.2 million by 2021 from USD 129.6 million in 2016, at a CAGR of
5.2% during the forecast period.
117
MICROSCOPY MARKET – GLOBAL FORECAST TO 2021
© MarketsandMarkets
TABLE 87 EUROPE: MICROSCOPY MARKET SIZE, BY APPLICATION, 2014-2021 (USD MILLION)
Application 2014 2015 2016 2021
CAGR
(2016–2021)
Semiconductors 419.8 450.9 484.5 697.1 7.5%
Life Sciences 407.8 438.8 472.9 691.7 7.9%
Material Sciences 239.9 250.6 263.7 329.5 4.6%
Nanotechnology 131.9 145.0 159.6 259.0 10.2%
Total 1,199.4 1,285.3 1,380.8 1,977.4 7.4%
Source: Annual Reports, Press Releases, SEC Filings, Investor Presentations, Microscopy Society of America, Canadian Cytometry and
Microscopy Association, Chinese Electron Microcopy Society, Australian Microscopy and Microanalysis Society, Journal of
Microscopy, Journal of Advanced Microscopy Research, Expert Interviews, and MarketsandMarkets Analysis
In 2016, the semiconductors segment is expected to account for the largest share of the microscopy
market in Europe. This application segment is projected to reach USD 697.1 million by 2021 from USD
484.5 million in 2016, at a CAGR of 7.5% during the forecast period.
TABLE 88 EUROPE: MICROSCOPY MARKET SIZE, BY END USER, 2014-2021 (USD MILLION)
End User 2014 2015 2016 2021
CAGR
(2016–2021)
Academic Institutes 607.6 660.9 720.2 1,104.8 8.9%
Industries 368.7 392.3 418.1 575.8 6.6%
Other End Users 223.1 232.1 242.5 296.8 4.1%
Total 1,199.4 1,285.3 1,380.8 1,977.4 7.4%
Source: Annual Reports, Press Releases, SEC Filings, Investor Presentations, Microscopy Society of America, Canadian Cytometry and
Microscopy Association, Chinese Electron Microcopy Society, Australian Microscopy and Microanalysis Society, Journal of
Microscopy, Journal of Advanced Microscopy Research, Expert Interviews, and MarketsandMarkets Analysis
In 2016, the academic institutes segment is expected to account for the largest share of the microscopy
market in Europe. This end-user segment is projected to reach USD 1,104.8 million by 2021 from USD
720.2 million in 2016, at the highest CAGR of 8.9% during the forecast period.
TABLE 89 EUROPE: MICROSCOPY MARKET SIZE, BY COUNTRY/REGION, 2014-2021 (USD MILLION)
Country/Region 2014 2015 2016 2021
CAGR
(2016–2021)
Germany 318.0 350.6 386.7 629.0 10.2%
U.K. 174.3 190.2 208.1 325.6 9.4%
France 122.6 132.3 143.3 214.2 8.4%
RoE 584.6 612.2 642.7 808.5 4.7%
Total 1,199.4 1,285.3 1,380.8 1,977.4 7.4%
Source: Annual Reports, Press Releases, SEC Filings, Investor Presentations, Microscopy Society of America, Canadian Cytometry and
Microscopy Association, Chinese Electron Microcopy Society, Australian Microscopy and Microanalysis Society, Journal of
Microscopy, Journal of Advanced Microscopy Research, Expert Interviews, and MarketsandMarkets Analysis
Germany is expected to account for the largest share of the European microscopy market in 2016. This
country segment is projected to reach USD 629.0 million by 2021 from USD 386.7 million in 2016, at the
highest CAGR of 10.2% from 2016 to 2021.
118
MICROSCOPY MARKET – GLOBAL FORECAST TO 2021
© MarketsandMarkets
9.3.1 GERMANY
Germany accounted for the largest share of 28% of the European microscopy market in 2016. Germany is
Europe’s largest market for medical devices and has the highest public sector investment in
nanotechnology. About half of all European nanotechnology companies are based in Germany. In addition,
the country has a national program for nanotechnology development—the Nano Initiative Action Plan 2010,
which aims at providing common goals and plans for nanotechnology development throughout the nation.
Due to favorable government and corporate support, many key industry participants are expanding their
microscopy business in Germany.
Growth in research and development in life science plays a significant role in Germany’s economy. In
addition, growth in the biotechnology industry is another major contributor to the microscopy market.
According to the World Bank, research and development spending as a percentage of Germany’s GDP
increased from 2.80% in 2011 to 2.85% in 2013. The Federal Ministry for Education and Research
(BMBF), Germany, established two funding programs—the Health Research Program and the Research
Strategy BioEconomy 2030. Along with these programs, the BMBF will provide institutional funding to
research societies. These funding programs, coupled with the high research and development growth rate
in Germany, are expected to boost the country’s biotechnology industry and positively impact the German
microscopy market during the forecast period.
TABLE 90 GERMANY: MICROSCOPY MARKET SIZE, BY PRODUCT, 2014-2021 (USD MILLION)
Product 2014 2015 2016 2021
CAGR
(2016–2021)
Optical Microscopes 125.6 135.5 146.0 210.6 7.6%
Electron Microscopes 118.0 134.0 152.0 285.2 13.4%
SPM 44.8 48.6 52.7 77.3 8.0%
Confocal Microscopes 29.6 32.5 35.9 55.9 9.3%
Total 318.0 350.6 386.7 629.0 10.2%
Source: Annual Reports, Press Releases, SEC Filings, Investor Presentations, Microscopy Society of America, Canadian Cytometry and
Microscopy Association, Chinese Electron Microcopy Society, Australian Microscopy and Microanalysis Society, Journal of
Microscopy, Journal of Advanced Microscopy Research, Expert Interviews, and MarketsandMarkets Analysis
In 2016, the electron microscopes segment is expected to account for the largest share of the German
microscopy market. This segment is projected to reach USD 285.2 million by 2021 from USD 152.0 million
in 2016, at the highest CAGR of 13.4% from 2016 to 2021.
119
MICROSCOPY MARKET – GLOBAL FORECAST TO 2021
© MarketsandMarkets
FIGURE 42 SEMICONDUCTORS APPLICATION SEGMENT TO ACCOUNT FOR THE LARGEST
SHARE OF THE EUROPEAN MICROSCOPY MARKET IN 2016
Source: Annual Reports, Press Releases, SEC Filings, Investor Presentations Expert Interviews, and MarketsandMarkets Analysis
TABLE 91 GERMANY: MICROSCOPY MARKET SIZE, BY APPLICATION, 2014-2021 (USD MILLION)
Application 2014 2015 2016 2021
CAGR
(2016–2021)
Semiconductors 111.3 123.0 135.7 221.8 10.3%
Life Sciences 108.1 119.7 132.4 220.0 10.7%
Material Sciences 63.6 68.4 73.9 104.8 7.3%
Nanotechnology 35.0 39.6 44.7 82.4 13.0%
Total 318.0 350.6 386.7 629.0 10.2%
Source: Annual Reports, Press Releases, SEC Filings, Investor Presentations, Microscopy Society of America, Canadian Cytometry and
Microscopy Association, Chinese Electron Microcopy Society, Australian Microscopy and Microanalysis Society, Journal of
Microscopy, Journal of Advanced Microscopy Research, Expert Interviews, and MarketsandMarkets Analysis
In 2016, the semiconductors segment is expected to account for the largest share of the German
microscopy market. This application segment is projected to reach USD 221.8 million by 2021 from USD
135.7 million in 2016, at a CAGR of 10.3% from 2016 to 2021.
Semiconductors Life Sciences Material Sciences Nanotechnology
2016 135.7 132.4 73.9 44.7
2021 221.8 220.0 104.8 82.4
CAGR 10.3% 10.6% 7.2% 13.0%
0
50
100
150
200
250
MarketSize(USDMillion)
120
MICROSCOPY MARKET – GLOBAL FORECAST TO 2021
© MarketsandMarkets
TABLE 92 GERMANY: MICROSCOPY MARKET SIZE, BY END USER, 2014-2021 (USD MILLION)
End User 2014 2015 2016 2021
CAGR
(2016–2021)
Academic Institutes 161.1 180.3 201.7 351.4 11.7%
Industries 97.7 107.0 117.1 183.2 9.4%
Other End Users 59.1 63.3 67.9 94.4 6.8%
Total 318.0 350.6 386.7 629.0 10.2%
Source: Annual Reports, Press Releases, SEC Filings, Investor Presentations, Microscopy Society of America, Canadian Cytometry and
Microscopy Association, Chinese Electron Microcopy Society, Australian Microscopy and Microanalysis Society, Journal of
Microscopy, Journal of Advanced Microscopy Research, Expert Interviews, and MarketsandMarkets Analysis
In 2016, the academic institutes segment is expected to account for the largest share of the German
microscopy market. This end-user segment is projected to reach USD 351.4 million by 2021 from USD
201.7 million in 2016, at the highest CAGR of 11.7% from 2016 to 2021.
9.3.2 THE U.K.
In 2016, the U.K. accounted for a 15.1% share of the European microscopy market. Research and
development spending in the U.K. increased at a CAGR of 4.94% from USD 26.63 billion in 2001 to USD
41.08 billion in 2010. Substantial research and development spending is expected to drive growth of the
academic research institutes end-user segment of the U.K. microscopy market in the forecast period.
In addition, the Biotechnology and Biological Sciences Research Council (BBSRC) had a budget of USD 785
million in the academic year 2012–2013 to fund scientific research institutes and university research
departments in the U.K. The availability of funding will enhance life sciences research, and consequently
boost growth of the U.K. microscopy market.
FIGURE 43 ELECTRON MICROSCOPES PRODUCT SEGMENT TO GROW AT THE HIGHEST RATE
IN THE U.K. MICROSCOPY MARKET
Source: Annual Reports, Press Releases, SEC Filings, Investor Presentations Expert Interviews, and MarketsandMarkets Analysis
Electron Microcsopes Optical Microcsopes
Scanning Probe
Microcsopes
Confocal Microcsopes
2016 81.8 78.6 28.4 19.3
2021 147.6 109.0 40.0 28.9
CAGR 12.5% 6.7% 7.1% 8.4%
0
20
40
60
80
100
120
140
160
MarketSize(USDMillion)
121
MICROSCOPY MARKET – GLOBAL FORECAST TO 2021
© MarketsandMarkets
TABLE 93 U.K.: MICROSCOPY MARKET SIZE, BY PRODUCT, 2014-2021 (USD MILLION)
Product 2014 2015 2016 2021
CAGR
(2016–2021)
Optical Microscopes 68.8 73.5 78.6 109.0 6.8%
Electron Microscopes 64.7 72.7 81.8 147.6 12.5%
SPM 24.6 26.4 28.4 40.0 7.1%
Confocal Microscopes 16.2 17.6 19.3 28.9 8.4%
Total 174.3 190.2 208.1 325.6 9.4%
Source: Annual Reports, Press Releases, SEC Filings, Investor Presentations, Microscopy Society of America, Canadian Cytometry and
Microscopy Association, Chinese Electron Microcopy Society, Australian Microscopy and Microanalysis Society, Journal of
Microscopy, Journal of Advanced Microscopy Research, Expert Interviews, and MarketsandMarkets Analysis
In 2016, the electron microscopes segment is expected to account for the largest share of the U.K.
microscopy market. This segment is projected to reach USD 147.6 million by 2021 from USD 81.8 million
in 2016, at the highest CAGR of 12.5% from 2016 to 2021.
TABLE 94 U.K.: MICROSCOPY MARKET SIZE, BY APPLICATION, 2014-2021 (USD MILLION)
Application 2014 2015 2016 2021
CAGR
(2016–2021)
Semiconductors 61.0 66.7 73.0 114.8 9.5%
Life Sciences 59.3 64.9 71.3 113.9 9.8%
Material Sciences 34.9 37.1 39.7 54.3 6.4%
Nanotechnology 19.2 21.5 24.0 42.7 12.1%
Total 174.3 190.2 208.1 325.6 9.4%
Source: Annual Reports, Press Releases, SEC Filings, Investor Presentations, Microscopy Society of America, Canadian Cytometry and
Microscopy Association, Chinese Electron Microcopy Society, Australian Microscopy and Microanalysis Society, Journal of
Microscopy, Journal of Advanced Microscopy Research, Expert Interviews, and MarketsandMarkets Analysis
In 2016, the semiconductors segment is expected to account for the largest share of the U.K. microscopy
market. This application segment is projected to reach USD 114.8 million by 2021 from USD 73.0 million
in 2016, at a CAGR of 9.5% from 2016 to 2021.
TABLE 95 U.K.: MICROSCOPY MARKET SIZE, BY END USER, 2014-2021 (USD MILLION)
End User 2014 2015 2016 2021
CAGR
(2016–2021)
Academic Institutes 88.3 97.8 108.5 181.9 10.9%
Industries 53.6 58.1 63.0 94.8 8.5%
Other End Users 32.4 34.4 36.5 48.9 6.0%
Total 174.3 190.2 208.1 325.6 9.4%
Source: Annual Reports, Press Releases, SEC Filings, Investor Presentations, Microscopy Society of America, Canadian Cytometry and
Microscopy Association, Chinese Electron Microcopy Society, Australian Microscopy and Microanalysis Society, Journal of
Microscopy, Journal of Advanced Microscopy Research, Expert Interviews, and MarketsandMarkets Analysis
In 2016, the academic institutes segment is expected to account for the largest share of the U.K.
microscopy market. This end-user segment is projected to reach USD 181.9 million by 2021 from USD
108.5 million in 2016, at the highest CAGR of 10.9% from 2016 to 2021.
122
MICROSCOPY MARKET – GLOBAL FORECAST TO 2021
© MarketsandMarkets
9.3.3 FRANCE
In 2016, France accounted for a 10.4% share of the European microscopy market. Research and
development spending in France increased from USD 29.43 billion in 2001 to USD 57.45 billion in 2010,
at a CAGR of 7.71% between the two years. In 2011, the French government invested about USD 360
million in nine national infrastructure projects in medical and life sciences research, and in two
demonstration projects in biotechnology. This, coupled with the increasing overall research and
development spending, will drive the biotechnology market in the country. Similarly, France’s five-year
Nano2012 strategic research and development program, led by STMicroelectronics, has been granted a
research and development budget of USD 2.57 billion, making it one of France’s biggest industrial
projects. The French national and local governments are providing substantial support for the project,
contributing nearly USD 511 million.
TABLE 96 FRANCE: MICROSCOPY MARKET SIZE, BY PRODUCT, 2014-2021 (USD MILLION)
Product 2014 2015 2016 2021
CAGR
(2016–2021)
Optical Microscopes 48.4 51.1 54.1 71.7 5.8%
Electron Microscopes 45.5 50.6 56.4 97.1 11.5%
SPM 17.3 18.3 19.5 26.3 6.1%
Confocal Microscopes 11.4 12.2 13.3 19.0 7.4%
Total 122.6 132.3 143.3 214.2 8.4%
Source: Annual Reports, Press Releases, SEC Filings, Investor Presentations, Microscopy Society of America, Canadian Cytometry and
Microscopy Association, Chinese Electron Microcopy Society, Australian Microscopy and Microanalysis Society, Journal of
Microscopy, Journal of Advanced Microscopy Research, Expert Interviews, and MarketsandMarkets Analysis
In 2016, the electron microscopes segment is expected to account for the largest share of the French
microscopy market. This segment is projected to reach USD 97.1 million by 2021 from USD 56.4 million in
2016, at the highest CAGR of 11.5% from 2016 to 2021.
TABLE 97 FRANCE: MICROSCOPY MARKET SIZE, BY APPLICATION, 2014-2021 (USD MILLION)
Application 2014 2015 2016 2021
CAGR
(2016–2021)
Semiconductors 42.9 46.4 50.3 75.5 8.5%
Life Sciences 41.7 45.2 49.1 74.9 8.8%
Material Sciences 24.5 25.8 27.4 35.7 5.5%
Nanotechnology 13.5 14.9 16.6 28.1 11.1%
Total 122.6 132.3 143.3 214.2 8.4%
Source: Annual Reports, Press Releases, SEC Filings, Investor Presentations, Microscopy Society of America, Canadian Cytometry and
Microscopy Association, Chinese Electron Microcopy Society, Australian Microscopy and Microanalysis Society, Journal of
Microscopy, Journal of Advanced Microscopy Research, Expert Interviews, and MarketsandMarkets Analysis
In 2016, the semiconductors segment is expected to account for the largest share of the French
microscopy market. This application segment is projected to reach USD 75.5 million by 2021 from USD
50.3 million in 2016, at a CAGR of 8.5% from 2016 to 2021.
123
MICROSCOPY MARKET – GLOBAL FORECAST TO 2021
© MarketsandMarkets
FIGURE 44 ACADEMIC INSTITUTES END-USER SEGMENT TO ACCOUNT FOR THE HIGHEST
SHARE IN THE FRENCH MICROSCOPY MARKET IN 2016
Source: Annual Reports, Press Releases, SEC Filings, Investor Presentations Expert Interviews, and MarketsandMarkets Analysis
TABLE 98 FRANCE: MICROSCOPY MARKET SIZE, BY END USER, 2014-2021 (USD MILLION)
End User 2014 2015 2016 2021
CAGR
(2016–2021)
Academic Institutes 62.1 68.0 74.8 119.7 9.9%
Industries 37.7 40.4 43.4 62.4 7.5%
Other End User 22.8 23.9 25.2 32.2 5.0%
Total 122.6 132.3 143.3 214.2 8.4%
Source: Annual Reports, Press Releases, SEC Filings, Investor Presentations, Microscopy Society of America, Canadian Cytometry and
Microscopy Association, Chinese Electron Microcopy Society, Australian Microscopy and Microanalysis Society, Journal of
Microscopy, Journal of Advanced Microscopy Research, Expert Interviews, and MarketsandMarkets Analysis
In 2016, the academic institutes segment is expected to account for the largest share of the French
microscopy end users market. This end-user segment is projected to reach USD 119.7 million by 2021
from USD 74.8 million in 2016, at the highest CAGR of 9.9% from 2016 to 2021.
Academic Institutes Industries Other End Users
2016 74.8 43.4 25.2
2021 119.7 62.4 32.2
CAGR 9.8% 7.5% 5.0%
0
20
40
60
80
100
120
140
MarketSize(USDMillion)
124
MICROSCOPY MARKET – GLOBAL FORECAST TO 2021
© MarketsandMarkets
9.3.4 REST OF EUROPE (ROE)
The Rest of Europe (RoE) accounted for a 46.5% share of the European microscopy market in 2016. This
segment includes Italy, Spain, the Netherlands, Switzerland, Sweden, Belgium, Turkey, and the Czech
Republic. Many societies have been formed in this region to aid growth of the microscopy industry. For
instance, the Belgian Society for Microscopy (BSM) is a society of professional microscopists from various
industries, academic institutes, and government laboratories in Belgium.
It is expected, though, that the economic downturn in the region will negatively affect growth of the rest of
European market.
TABLE 99 ROE: MICROSCOPY MARKET SIZE, BY PRODUCT, 2014-2021 (USD MILLION)
Product 2014 2015 2016 2021
CAGR
(2016–2021)
Optical Microscopes 230.9 236.6 242.8 270.7 2.2%
Electron Microscopes 216.9 234.0 252.7 366.6 7.7%
SPM 82.4 84.9 87.6 99.4 2.6%
Confocal Microscopes 54.4 56.7 59.6 71.9 3.8%
Total 584.6 612.2 642.7 808.5 4.7%
Source: Annual Reports, Press Releases, SEC Filings, Investor Presentations, Microscopy Society of America, Canadian Cytometry and
Microscopy Association, Chinese Electron Microcopy Society, Australian Microscopy and Microanalysis Society, Journal of
Microscopy, Journal of Advanced Microscopy Research, Expert Interviews, and MarketsandMarkets Analysis
In 2016, the electron microscopes segment is expected to account for the largest share of the RoE
microscopy market. This segment is projected to reach USD 366.6 million by 2021 from USD 252.7 million
in 2016, at the highest CAGR of 7.7% from 2016 to 2021.
FIGURE 45 NANOTECHNOLOGY TO WITNESS FASTEST GROWTH IN THE ROE MICROSCOPY
MARKET DURING FORECAST PERIOD
Source: Annual Reports, Press Releases, SEC Filings, Investor Presentations Expert Interviews, and MarketsandMarkets Analysis
Semiconductors Life Sciences Material Sciences Nanotechnology
2016 225.5 220.1 122.8 74.3
2021 285.0 282.8 134.7 105.9
CAGR 4.7% 5.1% 1.8% 7.3%
0
50
100
150
200
250
300
MarketSize(USDMillion)
125
MICROSCOPY MARKET – GLOBAL FORECAST TO 2021
© MarketsandMarkets
TABLE 100 ROE: MICROSCOPY MARKET SIZE, BY APPLICATION, 2014-2021 (USD MILLION)
Application 2014 2015 2016 2021
CAGR
(2016–2021)
Semiconductors 204.6 214.8 225.5 285.0 4.8%
Life Sciences 198.8 209.0 220.1 282.8 5.1%
Material Sciences 116.9 119.4 122.8 134.7 1.9%
Nanotechnology 64.3 69.1 74.3 105.9 7.4%
Total 584.6 612.2 642.7 808.5 4.7%
Source: Annual Reports, Press Releases, SEC Filings, Investor Presentations, Microscopy Society of America, Canadian Cytometry and
Microscopy Association, Chinese Electron Microcopy Society, Australian Microscopy and Microanalysis Society, Journal of
Microscopy, Journal of Advanced Microscopy Research, Expert Interviews, and MarketsandMarkets Analysis
In 2016, the semiconductors segment is expected to account for the largest share of the RoE microscopy
market. This application segment is projected to reach USD 285.0 million by 2021 from USD 225.5 million
in 2016, at a CAGR of 4.8% from 2016 to 2021.
TABLE 101 ROE: MICROSCOPY MARKET SIZE, BY END USER, 2014-2021 (USD MILLION)
End User 2014 2015 2016 2021
CAGR
(2016–2021)
Academic Institutes 296.2 314.8 335.2 451.7 6.1%
Industries 179.7 186.9 194.6 235.4 3.9%
Other End User 108.7 110.6 112.9 121.4 1.5%
Total 584.6 612.2 642.7 808.5 4.7%
Source: Annual Reports, Press Releases, SEC Filings, Investor Presentations, Microscopy Society of America, Canadian Cytometry and
Microscopy Association, Chinese Electron Microcopy Society, Australian Microscopy and Microanalysis Society, Journal of
Microscopy, Journal of Advanced Microscopy Research, Expert Interviews, and MarketsandMarkets Analysis
In 2016, the academic institutes segment is expected to account for the largest share of the RoE
microscopy market. This end-user segment is projected to reach USD 451.7 million by 2021 from USD
335.2 million in 2016, at the highest CAGR of 6.1% from 2016 to 2021.
126
MICROSCOPY MARKET – GLOBAL FORECAST TO 2021
© MarketsandMarkets
9.4 ASIA-PACIFIC
The Asia-Pacific region’s microscopy market comprises China, India, Japan, the Middle East, Australia, New
Zealand, and others (including Malaysia, Taiwan, Singapore, and South Korea). This market is expected to
account for a 24.1% share of the global microscopy market in 2016.
The APAC microscopy market, particularly in China, Japan, India, Taiwan, and South Korea, is expected to
witness high growth in the next five years. Growth in these countries will be fueled by factors such as
aggressive investment by key market companies, increasing government support, developing research and
development infrastructure, and growing expertise and academic excellence.
Japan has always been at the forefront of technological innovation. Increasing research and development
in nanotechnology is a major driving factor for the microscopy market in Japan. In addition, technological
advancements in microscopes, growing demand for visualization and measurement devices from Japanese
research institutes, and lucrative market opportunities such as lack of regulations are propelling growth of
this market. However, within APAC China is expected to witness the highest growth rate during the forecast
period. Original equipment manufacturers (OEMs) from China and Japan also play a crucial role in the
growth of the microscopy market in these regions, as key industry participants are very dependent on
OEMs to meet their production requirements. For instance, Leica ES2 stereo microscopes are
manufactured by Novel Optics (China). Similarly, Zeiss Primo Star microscopes are manufactured by the
Motic Group (China).
In addition, low labor costs, lack of regulations, and increasing liberalization in Asian countries have also
made this region a lucrative market for investors. In April 2011, Hitachi High-Technologies Corporation
(Japan) and Techcomp Holdings Ltd. (China) renewed their marketing agreement for five years. Under the
agreement, Techcomp owned the distribution and marketing rights for Hitachi’s analytical product range
and electronic microscopes in the Pacific region, Southeast Asia, and South Asia.
However, a number of factors such as the high cost of advanced microscopes, slow adoption of
technologically-advanced systems, high custom duties charged on medical devices in India and political
instability in the Middle East are restraining growth of this market.
The major companies operating in the Asia-Pacific region include Bruker (U.S.), Carl Zeiss AG (Germany),
Danish Micro Engineering A/S (Denmark), FEI Co. (U.S.), Hitachi High-Technologies (Japan), Leica
Microsystems (Germany), Nikon (Japan), and Olympus Corporation (Japan).
127
MICROSCOPY MARKET – GLOBAL FORECAST TO 2021
© MarketsandMarkets
FIGURE 46 ASIA-PACIFIC: MICROSCOPY MARKET SNAPSHOT, 2016
Source: Annual Reports, Press Releases, SEC Filings, Investor Presentations, Microscopy Society of America, Canadian Cytometry and
Microscopy Association, Chinese Electron Microcopy Society, Australian Microscopy and Microanalysis Society, Journal of
Microscopy, Journal of Advanced Microscopy Research, Expert Interviews, and MarketsandMarkets Analysis
ASIA-PACIFIC
APAC: MICROSCOPY MARKET SIZE,
BY END USER, 2016 vs 2021
(USD MILLION)
APAC: MICROSCOPY MARKET, BY PRODUCT,
2016 VS. 2021 (USD MILLION)
PRODUCT 2016 2021
Electron Microscopes 443.8 817.8
Optical Microscopes 426.3 603.8
Scanning Probe
Microscopes
153.9 221.7
Confocal Microscopes 104.7 160.3
APAC: MICROSCOPY MARKET SIZE,
BY APPLICATION, 2016
• Aggressive investments by key market players
• Increasing government support
• Developing R&D infrastructure
• Growing expertise and academic excellence
FACTORS SUPPORTING THE GROWTH OF
THE MICROSCOPY MARKET IN APAC
APAC to hold 24.1%
share of the global
microscopy market
in 2016
This geographic segment
is expected to grow at a
CAGR of 9.8% from
2016 to 2021
SEMICONDUCTORS LIFE SCIENCES
USD 396.1 MILLION USD 386.6 MILLION
MATERIAL
SCIENCES
NANOTECHNOLOGY
USD 215.6 MILLION USD 130.4 MILLION
588.7
341.8
198.2
1,007.7
525.2
270.7
Academic
Institutes
Industries Others*
2016 2021
128
MICROSCOPY MARKET – GLOBAL FORECAST TO 2021
© MarketsandMarkets
TABLE 102 ASIA-PACIFIC: MICROSCOPY MARKET SIZE, BY PRODUCT, 2014-2021 (USD MILLION)
Product 2014 2015 2016 2021
CAGR
(2016–2021)
Optical Microscopes 369.4 396.5 426.3 603.8 7.2%
Electron Microscopes 346.9 392.1 443.8 817.8 13.0%
SPM 131.9 142.3 153.9 221.7 7.6%
Confocal Microscopes 87.0 95.0 104.7 160.3 8.9%
Total 935.1 1,026.0 1,128.7 1,803.6 9.8%
Source: Annual Reports, Press Releases, SEC Filings, Investor Presentations, Microscopy Society of America, Canadian Cytometry and
Microscopy Association, Chinese Electron Microcopy Society, Australian Microscopy and Microanalysis Society, Journal of
Microscopy, Journal of Advanced Microscopy Research, Expert Interviews, and MarketsandMarkets Analysis
In 2016, the electron microscopes segment is expected to account for the largest share of the microscopy
market in APAC. This product segment is projected to reach USD 817.8 million by 2021 from USD 443.8
million in 2016, at the highest CAGR of 13.0% during the forecast period.
TABLE 103 ASIA-PACIFIC: OPTICAL MICROSCOPES MARKET SIZE, BY TYPE,
2014-2021 (USD MILLION)
Type 2014 2015 2016 2021
CAGR
(2016–2021)
Fluorescence Microscopes 275.2 288.9 304.1 378.9 4.5%
Super-resolution Microscopes 94.2 107.7 122.2 224.9 13.0%
Total 369.4 396.5 426.3 603.8 7.2%
Source: Annual Reports, Press Releases, SEC Filings, Investor Presentations, Microscopy Society of America, Canadian Cytometry and
Microscopy Association, Chinese Electron Microcopy Society, Australian Microscopy and Microanalysis Society, Journal of
Microscopy, Journal of Advanced Microscopy Research, Expert Interviews, and MarketsandMarkets Analysis
In 2016, the fluorescence microscopes segment is expected to account for the larger share of the optical
microscopes market in the APAC region. This segment is projected to reach USD 378.9 million by 2021
from USD 304.1 million in 2016, at a CAGR of 4.5% during the forecast period.
TABLE 104 ASIA-PACIFIC: ELECTRON MICROSCOPES MARKET SIZE, BY TYPE,
2014-2021 (USD MILLION)
Type 2014 2015 2016 2021
CAGR
(2016–2021)
SEM 271.0 306.7 347.5 644.4 13.1%
Transmission Electron Microscopes 76.0 85.5 96.3 173.4 12.5%
Total 346.9 392.1 443.8 817.7 13.0%
Source: Annual Reports, Press Releases, SEC Filings, Investor Presentations, Microscopy Society of America, Canadian Cytometry and
Microscopy Association, Chinese Electron Microcopy Society, Australian Microscopy and Microanalysis Society, Journal of
Microscopy, Journal of Advanced Microscopy Research, Expert Interviews, and MarketsandMarkets Analysis
In 2016, the SEM segment is expected to account for the larger share of the electron microscopes market
in the APAC region. This segment is projected to reach USD 644.4 million by 2021 from USD 347.5 million
in 2016, at a higher CAGR of 13.1% during the forecast period.
129
MICROSCOPY MARKET – GLOBAL FORECAST TO 2021
© MarketsandMarkets
TABLE 105 ASIA-PACIFIC: SPM MARKET SIZE, BY TYPE, 2014-2021 (USD MILLION)
Type 2014 2015 2016 2021
CAGR
(2016–2021)
STM 131.9 142.3 153.9 221.7 7.6%
AFM 34.7 37.4 40.5 58.4 7.6%
Near-field Scanning Microscopes 6.4 6.9 7.4 10.8 7.7%
Total 172.9 186.6 201.8 290.8 7.6%
Source: Annual Reports, Press Releases, SEC Filings, Investor Presentations, Microscopy Society of America, Canadian Cytometry and
Microscopy Association, Chinese Electron Microcopy Society, Australian Microscopy and Microanalysis Society, Journal of
Microscopy, Journal of Advanced Microscopy Research, Expert Interviews, and MarketsandMarkets Analysis
In 2016, the STM segment is expected to account for the larger share of the SPM market in the APAC
region. This segment is projected to reach USD 221.7 million by 2021 from USD 153.9 million in 2016, at
a CAGR of 7.6% during the forecast period.
TABLE 106 ASIA-PACIFIC: MICROSCOPY MARKET SIZE, BY APPLICATION, 2014-2021 (USD MILLION)
Application 2014 2015 2016 2021
CAGR
(2016–2021)
Semiconductors 327.3 359.9 396.1 635.8 9.9%
Life Sciences 317.9 350.3 386.6 630.9 10.3%
Material Sciences 187.0 200.0 215.6 300.6 6.9%
Nanotechnology 102.9 115.8 130.4 236.3 12.6%
Total 935.1 1,026.0 1,128.7 1,803.6 9.8%
Source: Annual Reports, Press Releases, SEC Filings, Investor Presentations, Microscopy Society of America, Canadian Cytometry and
Microscopy Association, Chinese Electron Microcopy Society, Australian Microscopy and Microanalysis Society, Journal of
Microscopy, Journal of Advanced Microscopy Research, Expert Interviews, and MarketsandMarkets Analysis
In 2016, the semiconductors segment is expected to account for the largest share of the microscopy
market in the APAC region. This application segment is projected to reach USD 635.8 million by 2021 from
USD 396.1 million in 2016, at a CAGR of 9.9% during the forecast period.
TABLE 107 ASIA-PACIFIC: MICROSCOPY MARKET SIZE, BY END USER, 2014-2021 (USD MILLION)
End User 2014 2015 2016 2021
CAGR
(2016–2021)
Academic Institutes 473.7 527.5 588.7 1,007.7 11.3%
Industries 287.5 313.2 341.8 525.2 9.0%
Other End Users 173.9 185.3 198.2 270.7 6.4%
Total 935.1 1,026.0 1,128.7 1,803.6 9.8%
*Note: The others segment includes government research institutes and private laboratories.
Source: Annual Reports, Press Releases, SEC Filings, Investor Presentations, Microscopy Society of America, Canadian Cytometry and
Microscopy Association, Chinese Electron Microcopy Society, Australian Microscopy and Microanalysis Society, Journal of
Microscopy, Journal of Advanced Microscopy Research, Expert Interviews, and MarketsandMarkets Analysis
In 2016, the academic institutes segment is expected to account for the largest share of the microscopy
market in the APAC region. This end-user segment is projected to reach USD 1,007.7 million by 2021 from
USD 588.7 million in 2016, at the highest CAGR of 11.3% during the forecast period.
130
MICROSCOPY MARKET – GLOBAL FORECAST TO 2021
© MarketsandMarkets
9.5 REST OF THE WORLD (ROW)
The Rest of the World (RoW) region includes Africa and Latin America. The RoW is expected to account for
a 10.5% share of the overall microscopy market in 2016. Growth in this region will primarily be centered on
South American countries such as Brazil, Mexico, and Argentina. Companies in the microscopy market are
expected to shift their focus toward untapped markets in Latin America and Africa, once developed
markets start getting saturated.
TABLE 108 ROW: MICROSCOPY MARKET SIZE, BY PRODUCT, 2014-2021 (USD MILLION)
Product 2014 2015 2016 2021
CAGR
(2016–2021)
Optical Microscopes 168.6 176.0 183.9 227.8 4.4%
Electron Microscopes 158.4 174.1 191.4 308.5 10.0%
SPM 60.2 63.2 66.4 83.6 4.7%
Confocal Microscopes 39.7 42.2 45.2 60.5 6.0%
Total 426.9 455.5 486.8 680.5 6.9%
Source: Annual Reports, Press Releases, SEC Filings, Investor Presentations, Microscopy Society of America, Canadian Cytometry and
Microscopy Association, Chinese Electron Microcopy Society, Australian Microscopy and Microanalysis Society, Journal of
Microscopy, Journal of Advanced Microscopy Research, Expert Interviews, and MarketsandMarkets Analysis
In 2016, the electron microscopes segment is expected to account for the largest share of the microscopy
market in the RoW. This product segment is projected to reach USD 308.5 million by 2021 from USD
191.4 million in 2016, at the highest CAGR of 10.0% during the forecast period.
TABLE 109 ROW: OPTICAL MICROSCOPES MARKET SIZE, BY TYPE, 2014-2021 (USD MILLION)
Type 2014 2015 2016 2021
CAGR
(2016–2021)
Fluorescence Microscopes 125.6 128.2 131.2 143.0 1.7%
Super-resolution Microscopes 43.0 47.8 52.7 84.9 10.0%
Total 168.6 176.0 183.9 227.8 4.4%
Source: Annual Reports, Press Releases, SEC Filings, Investor Presentations, Microscopy Society of America, Canadian Cytometry and
Microscopy Association, Chinese Electron Microcopy Society, Australian Microscopy and Microanalysis Society, Journal of
Microscopy, Journal of Advanced Microscopy Research, Expert Interviews, and MarketsandMarkets Analysis
In 2016, the fluorescence microscopes segment is expected to account for a larger share of the optical
microscopes market in the RoW. This segment is projected to reach USD 143.0 million by 2021 from USD
131.2 million in 2016, at a CAGR of 1.7% during the forecast period.
131
MICROSCOPY MARKET – GLOBAL FORECAST TO 2021
© MarketsandMarkets
TABLE 110 ROW: ELECTRON MICROSCOPES MARKET SIZE, BY TYPE, 2014-2021 (USD MILLION)
Type 2014 2015 2016 2021
CAGR
(2016–2021)
SEM 123.7 136.1 149.9 243.1 10.2%
Transmission Electron
Microscopes 34.7 37.9 41.5 65.4 9.5%
Total 158.4 174.1 191.4 308.5 10.0%
Source: Annual Reports, Press Releases, SEC Filings, Investor Presentations, Microscopy Society of America, Canadian Cytometry and
Microscopy Association, Chinese Electron Microcopy Society, Australian Microscopy and Microanalysis Society, Journal of
Microscopy, Journal of Advanced Microscopy Research, Expert Interviews, and MarketsandMarkets Analysis
In 2016, the SEM segment is expected to account for a larger share of the electron microscopes market in
the RoW. This segment is projected to reach USD 243.1 million by 2021 from USD 149.9 million in 2016,
at a higher CAGR of 10.2% during the forecast period.
TABLE 111 ROW: SPM MARKET SIZE, BY TYPE, 2014-2021 (USD MILLION)
Type 2014 2015 2016 2021
CAGR
(2016–2021)
STM 41.5 43.5 45.7 57.5 4.7%
AFM 15.8 16.6 17.4 22.0 4.8%
Near-field Scanning Microscopes 2.9 3.1 3.2 4.1 4.8%
Total 60.2 63.2 66.4 83.6 4.7%
Source: Annual Reports, Press Releases, SEC Filings, Investor Presentations, Microscopy Society of America, Canadian Cytometry and
Microscopy Association, Chinese Electron Microcopy Society, Australian Microscopy and Microanalysis Society, Journal of
Microscopy, Journal of Advanced Microscopy Research, Expert Interviews, and MarketsandMarkets Analysis
In 2016, the STM segment is expected to account for the largest share of the SPM market in the RoW. This
segment is projected to reach USD 57.5 million by 2021 from USD 45.7 million in 2016, at a CAGR of 4.7%
during the forecast period.
TABLE 112 ROW: MICROSCOPY MARKET SIZE, BY APPLICATION, 2014-2021 (USD MILLION)
Application 2014 2015 2016 2021
CAGR
(2016–2021)
Semiconductors 149.4 159.8 170.8 239.9 7.0%
Life Sciences 145.1 155.5 166.7 238.1 7.4%
Material Sciences 85.4 88.8 93.0 113.4 4.1%
Nanotechnology 47.0 51.4 56.3 89.1 9.6%
Total 426.9 455.5 486.8 680.5 6.9%
Source: Annual Reports, Press Releases, SEC Filings, Investor Presentations, Microscopy Society of America, Canadian Cytometry and
Microscopy Association, Chinese Electron Microcopy Society, Australian Microscopy and Microanalysis Society, Journal of
Microscopy, Journal of Advanced Microscopy Research, Expert Interviews, and MarketsandMarkets Analysis
In 2016, the semiconductors segment is expected to account for the largest share of the microscopy
market in the RoW. This application segment is projected to reach USD 239.9 million by 2021 from USD
170.8 million in 2016, at a CAGR of 7.0% during the forecast period.
132
MICROSCOPY MARKET – GLOBAL FORECAST TO 2021
© MarketsandMarkets
FIGURE 47 ACADEMIC INSTITUTES END-USER SEGMENT TO WITNESS THE HIGHEST GROWTH
RATE IN THE ROW MICROSCOPY MARKET DURING THE FORECAST PERIOD
Source: Annual Reports, Press Releases, SEC Filings, Investor Presentations, Microscopy Society of America, Canadian Cytometry and
Microscopy Association, Chinese Electron Microcopy Society, Australian Microscopy and Microanalysis Society, Journal of
Microscopy, Journal of Advanced Microscopy Research, Expert Interviews, and MarketsandMarkets Analysis
TABLE 113 ROW: MICROSCOPY MARKET SIZE, BY END USER, 2014-2021 (USD MILLION)
End User 2014 2015 2016 2021
CAGR
(2016–2021)
Academic Institutes 216.3 234.2 253.9 380.2 8.4%
Industries 131.2 139.0 147.4 198.2 6.1%
Other End Users 79.4 82.3 85.5 102.1 3.6%
Total 426.9 455.5 486.8 680.5 6.9%
Source: Annual Reports, Press Releases, SEC Filings, Investor Presentations, Microscopy Society of America, Canadian Cytometry and
Microscopy Association, Chinese Electron Microcopy Society, Australian Microscopy and Microanalysis Society, Journal of
Microscopy, Journal of Advanced Microscopy Research, Expert Interviews, and MarketsandMarkets Analysis
In 2016, the academic institutes segment is expected to account for the largest share of the microscopy
market in the RoW. This end-user segment is projected to reach USD 380.2 million by 2021 from USD
253.9 million in 2016, at a CAGR of 8.4% during the forecast period.
Academic Institutes Industries Other End Users
2016 253.9 147.4 85.5
2021 380.2 198.2 102.1
CAGR 8.4% 6.0% 3.6%
0
50
100
150
200
250
300
350
400
MarketSize(USDMillion)
133
MICROSCOPY MARKET – GLOBAL FORECAST TO 2021
© MarketsandMarkets
TABLE 114 ROW: MICROSCOPY MARKET SIZE, BY COUNTRY/REGION, 2014-2021 (USD MILLION)
Country/Region 2014 2015 2016 2021
CAGR
(2016–2021)
Brazil 178.4 191.0 204.7 290.4 7.2%
Mexico 107.6 113.2 119.3 155.1 5.4%
Argentina 40.6 43.7 47.2 69.3 8.0%
RoLA 100.3 107.6 115.6 165.7 7.5%
Total 426.9 455.5 486.8 680.5 6.9%
Source: Annual Reports, Press Releases, SEC Filings, Investor Presentations, Microscopy Society of America, Canadian Cytometry and
Microscopy Association, Chinese Electron Microcopy Society, Australian Microscopy and Microanalysis Society, Journal of
Microscopy, Journal of Advanced Microscopy Research, Expert Interviews, and MarketsandMarkets Analysis
Brazil is expected to account for the largest share of the RoW microscopy market in 2016. This regional
segment is projected to reach USD 290.4 million by 2021 from USD 204.7 million in 2016, at a CAGR of
7.2% from 2016 to 2021.
9.5.1 BRAZIL
Brazil, the growth engine for the RoW microscopy market, is expected to account for the largest share
(41.9%) of the RoW microscopy market in 2016. According to World Bank 2010 data, Brazil spent
approximately 1.1% of its GDP on research and development activities, which was less than the OECD
countries’ average of 2.2%. However, in 2007, the Ministry of Health launched the National Action Plan for
Science and Technology to increase research and development investment to 1.5% of the country’s GDP.
The life sciences sector has the greatest demand for research and development activities in the country,
with much of the research being conducted in the field of genomics, stem cell research, vaccines,
neurosciences, and green biotechnology.
The Brazilian government is also dedicated to improving human resource support in the country. In
addition, in 2001, the Brazilian Ministry of Science and Technology (MCT) started a systematic approach
for nanotechnology development. In 2012, the MCT launched the SisNANO project with a view to reduce
the gap between researchers in academic institutes and industries. Thus, favorable government initiatives
are a major driving factor for this region. On the other hand, political instability and a lack of funding are
restraining growth of this market.
TABLE 115 BRAZIL: MICROSCOPY MARKET SIZE, BY PRODUCT, 2014-2021 (USD MILLION)
Product 2014 2015 2016 2021
CAGR
(2016–2021)
Optical Microscopes 70.5 73.8 77.3 97.2 4.7%
Electron Microscopes 66.2 73.0 80.5 131.7 10.3%
SPM 25.2 26.5 27.9 35.7 5.0%
Confocal Microscopes 16.6 17.7 19.0 25.8 6.3%
Total 178.4 191.0 204.7 290.4 7.2%
Source: Annual Reports, Press Releases, SEC Filings, Investor Presentations, Microscopy Society of America, Canadian Cytometry and
Microscopy Association, Chinese Electron Microcopy Society, Australian Microscopy and Microanalysis Society, Journal of
Microscopy, Journal of Advanced Microscopy Research, Expert Interviews, and MarketsandMarkets Analysis
In 2016, the electron microscopes segment is expected to account for the largest share of the microscopy
market in Brazil. This product segment is projected to reach USD 131.7 million by 2021 from USD 80.5
million in 2016, at the highest CAGR of 10.3% during the forecast period.
134
MICROSCOPY MARKET – GLOBAL FORECAST TO 2021
© MarketsandMarkets
TABLE 116 BRAZIL: OPTICAL MICROSCOPES MARKET SIZE, BY TYPE, 2014-2021 (USD MILLION)
Type 2014 2015 2016 2021
CAGR
(2016–2021)
Fluorescence Microscopes 52.5 53.8 55.2 61.0 2.0%
Super-resolution Microscopes 18.0 20.0 22.2 36.2 10.3%
Total 70.5 73.8 77.3 97.2 4.7%
Source: Annual Reports, Press Releases, SEC Filings, Investor Presentations, Microscopy Society of America, Canadian Cytometry and
Microscopy Association, Chinese Electron Microcopy Society, Australian Microscopy and Microanalysis Society, Journal of
Microscopy, Journal of Advanced Microscopy Research, Expert Interviews, and MarketsandMarkets Analysis
In 2016, the fluorescence microscopes segment is expected to account for a larger share of the optical
microscopes market in Brazil. This segment is projected to reach USD 61.0 million by 2021 from USD 55.2
million in 2016, at a CAGR of 2.0% during the forecast period.
TABLE 117 BRAZIL: ELECTRON MICROSCOPES MARKET SIZE, BY TYPE, 2014-2021 (USD MILLION)
Type 2014 2015 2016 2021
CAGR
(2016–2021)
SEM 51.7 57.1 63.0 103.7 10.5%
Transmission Electron
Microscopes 14.5 15.9 17.5 27.9 9.8%
Total 66.2 73.0 80.5 131.7 10.3%
Source: Annual Reports, Press Releases, SEC Filings, Investor Presentations, Microscopy Society of America, Canadian Cytometry and
Microscopy Association, Chinese Electron Microcopy Society, Australian Microscopy and Microanalysis Society, Journal of
Microscopy, Journal of Advanced Microscopy Research, Expert Interviews, and MarketsandMarkets Analysis
In 2016, the SEM segment is expected to account for a larger share of the electron microscopes market in
Brazil. This segment is projected to reach USD 103.7 million by 2021 from USD 63.0 million in 2016, at a
higher CAGR of 10.5% during the forecast period.
FIGURE 48 STM TO ACCOUNT FOR THE LARGEST SHARE OF THE SPM MARKET IN BRAZIL IN
2016
Source: Annual Reports, Press Releases, SEC Filings, Investor Presentations, Microscopy Society of America, Canadian Cytometry and
Microscopy Association, Chinese Electron Microcopy Society, Australian Microscopy and Microanalysis Society, Journal of
Microscopy, Journal of Advanced Microscopy Research, Expert Interviews, and MarketsandMarkets Analysis
Scanning Tunneling
Microscopes
Atomic Force Microscopes
Near-field Scanning
Microscope
2016 19.2 7.3 1.4
2021 24.6 9.4 1.7
CAGR 5.0% 5.0% 5.1%
0
5
10
15
20
25
30
MarketSize(USDMillion)
135
MICROSCOPY MARKET – GLOBAL FORECAST TO 2021
© MarketsandMarkets
TABLE 118 BRAZIL: SPM MARKET SIZE, BY TYPE, 2014-2021 (USD MILLION)
Type 2014 2015 2016 2021
CAGR
(2016–2021)
STM 17.3 18.2 19.2 24.6 5.0%
AFM 6.6 7.0 7.3 9.4 5.1%
Near-field Scanning Microscopes 1.2 1.3 1.4 1.7 5.1%
Total 25.2 26.5 27.9 35.7 5.0%
Source: Annual Reports, Press Releases, SEC Filings, Investor Presentations, Microscopy Society of America, Canadian Cytometry and
Microscopy Association, Chinese Electron Microcopy Society, Australian Microscopy and Microanalysis Society, Journal of
Microscopy, Journal of Advanced Microscopy Research, Expert Interviews, and MarketsandMarkets Analysis
In 2016, the STM segment is expected to account for the largest share of the SPM market in Brazil. This
segment is projected to reach USD 24.6 million by 2021 from USD 19.2 million in 2016, at a CAGR of 5.0%
during the forecast period.
TABLE 119 BRAZIL: MICROSCOPY MARKET SIZE, BY APPLICATION, 2014-2021 (USD MILLION)
Application 2014 2015 2016 2021
CAGR
(2016–2021)
Semiconductors 62.5 67.0 71.8 102.4 7.3%
Life Sciences 60.7 65.2 70.1 101.6 7.7%
Material Sciences 35.7 37.2 39.1 48.4 4.4%
Nanotechnology 19.6 21.6 23.7 38.0 10.0%
Total 178.4 191.0 204.7 290.4 7.2%
Source: Annual Reports, Press Releases, SEC Filings, Investor Presentations, Microscopy Society of America, Canadian Cytometry and
Microscopy Association, Chinese Electron Microcopy Society, Australian Microscopy and Microanalysis Society, Journal of
Microscopy, Journal of Advanced Microscopy Research, Expert Interviews, and MarketsandMarkets Analysis
In 2016, the semiconductors segment is expected to account for the largest share of the microscopy
market in Brazil. This application segment is projected to reach USD 102.4 million by 2021 from USD 71.8
million in 2016, at a CAGR of 7.3% during the forecast period.
TABLE 120 BRAZIL: MICROSCOPY MARKET SIZE, BY END USER, 2014-2021 (USD MILLION)
End User 2014 2015 2016 2021
CAGR
(2016–2021)
Academic Institutes 90.4 98.2 106.8 162.2 8.7%
Industries 54.9 58.3 62.0 84.6 6.4%
Other End Users 33.2 34.5 35.9 43.6 3.9%
Total 178.4 191.0 204.7 290.4 7.2%
Source: Annual Reports, Press Releases, SEC Filings, Investor Presentations, Microscopy Society of America, Canadian Cytometry and
Microscopy Association, Chinese Electron Microcopy Society, Australian Microscopy and Microanalysis Society, Journal of
Microscopy, Journal of Advanced Microscopy Research, Expert Interviews, and MarketsandMarkets Analysis
In 2016, the academic institutes segment is expected to account for the largest share of the microscopy
market in Brazil. This end-user segment is projected to reach USD 162.2 million by 2021 from USD 106.8
million in 2016, at a CAGR of 8.7% during the forecast period.
136
MICROSCOPY MARKET – GLOBAL FORECAST TO 2021
© MarketsandMarkets
9.5.2 MEXICO
Mexico is expected to account for the second-largest share of 24.5% of the RoW microscopy market in
2016. In the past, growth of Mexico’s microscopy market has been driven mainly by growth of the country’s
clinical research industry. According to the Asociación Mexicana de Industrias de Investigación
Farmacéutica (AMIIF), more than 1,250 research institutions and 2,000 researchers were involved in
clinical trials in 2005. The rising number of clinical trials and research and development activities by
pharmaceutical and biotechnology companies is expected to drive the market for microscopy in Mexico
during the forecast period. Furthermore, growing demand from universities for state-of-the-art research
facilities is another key driver for growth of the microscopy market in Mexico. Mexico has more than 50
universities and public centers conducting research on nanotechnology. Thus, growing focus on
nanotechnology presents significant growth opportunities in the future. However, high market risk is a
major factor limiting growth of this market.
FIGURE 49 ELECTRON MICROSCOPES PRODUCT SEGMENT TO ACCOUNT FOR THE LARGEST
SHARE OF THE MEXICAN MICROSCOPY MARKET IN 2016
Source: Annual Reports, Press Releases, SEC Filings, Investor Presentations, Microscopy Society of America, Canadian Cytometry and
Microscopy Association, Chinese Electron Microcopy Society, Australian Microscopy and Microanalysis Society, Journal of
Microscopy, Journal of Advanced Microscopy Research, Expert Interviews, and MarketsandMarkets Analysis
TABLE 121 MEXICO: MICROSCOPY MARKET SIZE, BY PRODUCT, 2014-2021 (USD MILLION)
Product 2014 2015 2016 2021
CAGR
(2016–2021)
Optical Microscopes 42.5 43.7 45.1 51.9 2.9%
Electron Microscopes 39.9 43.3 46.9 70.3 8.4%
SPM 15.2 15.7 16.3 19.1 3.2%
Confocal Microscopes 10.0 10.5 11.1 13.8 4.5%
Total 107.6 113.2 119.3 155.1 5.4%
Source: Annual Reports, Press Releases, SEC Filings, Investor Presentations, Microscopy Society of America, Canadian Cytometry and
Microscopy Association, Chinese Electron Microcopy Society, Australian Microscopy and Microanalysis Society, Journal of
Microscopy, Journal of Advanced Microscopy Research, Expert Interviews, and MarketsandMarkets Analysis
In 2016, the electron microscopes segment is expected to account for the largest share of the microscopy
market in Mexico. This product segment is projected to reach USD 70.3 million by 2021 from USD 46.9
million in 2016, at the highest CAGR of 8.4% during the forecast period.
Electron Microcsopes Optical Microcsopes
Scanning Probe
Microcsopes
Confocal
Microcsopes
2016 46.9 45.1 16.3 11.1
2021 70.3 51.9 19.1 13.8
CAGR 8.4% 2.8% 3.2% 4.4%
0
10
20
30
40
50
60
70
80
MarketSize(USDMillion)
137
MICROSCOPY MARKET – GLOBAL FORECAST TO 2021
© MarketsandMarkets
TABLE 122 MEXICO: OPTICAL MICROSCOPES MARKET SIZE, BY TYPE, 2014-2021 (USD MILLION)
Type 2014 2015 2016 2021
CAGR
(2016–2021)
Fluorescence Microscopes 31.7 31.9 32.1 32.6 0.3%
Super-resolution Microscopes 10.8 11.9 12.9 19.3 8.4%
Total 42.5 43.7 45.1 51.9 2.9%
Source: Annual Reports, Press Releases, SEC Filings, Investor Presentations, Microscopy Society of America, Canadian Cytometry and
Microscopy Association, Chinese Electron Microcopy Society, Australian Microscopy and Microanalysis Society, Journal of
Microscopy, Journal of Advanced Microscopy Research, Expert Interviews, and MarketsandMarkets Analysis
In 2016, the fluorescence microscopes segment is expected to account for a larger share of the optical
microscopes market in Mexico. This segment is projected to reach USD 32.6 million by 2021 from USD
32.1 million in 2016, at a CAGR of 0.3% during the forecast period.
TABLE 123 MEXICO: ELECTRON MICROSCOPES MARKET SIZE, BY TYPE, 2014-2021 (USD MILLION)
Type 2014 2015 2016 2021
CAGR
(2016–2021)
SEM 31.2 33.8 36.7 55.4 8.6%
Transmission Electron
Microscopes 8.7 9.4 10.2 14.9 7.9%
Total 39.9 43.3 46.9 70.3 8.4%
Source: Annual Reports, Press Releases, SEC Filings, Investor Presentations, Microscopy Society of America, Canadian Cytometry and
Microscopy Association, Chinese Electron Microcopy Society, Australian Microscopy and Microanalysis Society, Journal of
Microscopy, Journal of Advanced Microscopy Research, Expert Interviews, and MarketsandMarkets Analysis
In 2016, the SEM segment is expected to account for a larger share of the electron microscopes market in
Mexico. This segment is projected to reach USD 55.4 million by 2021 from USD 36.7 million in 2016, at a
higher CAGR of 8.6% during the forecast period.
TABLE 124 MEXICO: SPM MARKET SIZE, BY TYPE, 2014-2021 (USD MILLION)
Type 2014 2015 2016 2021
CAGR
(2016–2021)
STM 10.45 10.81 11.20 13.11 3.2%
AFM 3.99 4.13 4.28 5.02 3.3%
Near-field Scanning Microscopes 0.74 0.76 0.79 0.93 3.3%
Total 15.17 15.70 16.26 19.06 3.2%
Source: Annual Reports, Press Releases, SEC Filings, Investor Presentations, Microscopy Society of America, Canadian Cytometry and
Microscopy Association, Chinese Electron Microcopy Society, Australian Microscopy and Microanalysis Society, Journal of
Microscopy, Journal of Advanced Microscopy Research, Expert Interviews, and MarketsandMarkets Analysis
In 2016, the STM segment is expected to account for the largest share of the SPM market in Mexico. This
segment is projected to reach USD 13.11 million by 2021 from USD 11.20 million in 2016, at a CAGR of
3.2% during the forecast period.
138
MICROSCOPY MARKET – GLOBAL FORECAST TO 2021
© MarketsandMarkets
TABLE 125 MEXICO: MICROSCOPY MARKET SIZE, BY APPLICATION, 2014-2021 (USD MILLION)
Application 2014 2015 2016 2021
CAGR
(2016–2021)
Semiconductors 37.7 39.7 41.9 54.7 5.5%
Life Sciences 36.6 38.6 40.9 54.3 5.8%
Material Sciences 21.5 22.1 22.8 25.8 2.5%
Nanotechnology 11.8 12.8 13.8 20.3 8.1%
Total 107.6 113.2 119.3 155.1 5.4%
Source: Annual Reports, Press Releases, SEC Filings, Investor Presentations, Microscopy Society of America, Canadian Cytometry and
Microscopy Association, Chinese Electron Microcopy Society, Australian Microscopy and Microanalysis Society, Journal of
Microscopy, Journal of Advanced Microscopy Research, Expert Interviews, and MarketsandMarkets Analysis
In 2016, the semiconductors segment is expected to account for the largest share of the microscopy
market in Mexico. This application segment is projected to reach USD 54.7 million by 2021 from USD 41.9
million in 2016, at a CAGR of 5.5% during the forecast period.
TABLE 126 MEXICO: MICROSCOPY MARKET SIZE, BY END USER, 2014-2021 (USD MILLION)
End User 2014 2015 2016 2021
CAGR
(2016–2021)
Academic Institutes 54.5 58.2 62.2 86.6 6.8%
Industries 33.1 34.5 36.1 45.2 4.6%
Other End Users 20.0 20.4 21.0 23.3 2.1%
Total 107.6 113.2 119.3 155.1 5.4%
Source: Annual Reports, Press Releases, SEC Filings, Investor Presentations, Microscopy Society of America, Canadian Cytometry and
Microscopy Association, Chinese Electron Microcopy Society, Australian Microscopy and Microanalysis Society, Journal of
Microscopy, Journal of Advanced Microscopy Research, Expert Interviews, and MarketsandMarkets Analysis
In 2016, the academic institutes segment is expected to account for the largest share of the microscopy
market in Mexico. This end-user segment is projected to reach USD 86.6 million by 2021 from USD 62.2
million in 2016, at the highest CAGR of 6.8% during the forecast period.
139
MICROSCOPY MARKET – GLOBAL FORECAST TO 2021
© MarketsandMarkets
9.5.3 ARGENTINA
Argentina is expected to account for a 9.6% share of the RoW microscopy market in 2016. The nation has
a strong research base with the highest number of researchers (3.06/1000) within Latin America. This
represents huge market potential for laboratory instruments, including microscopes and imaging devices.
Government initiatives to promote and facilitate basic research and technological investment, through the
establishment of institutions such as the National Institute for Scientific and Technological Promotion, are
expected to boost research activities in the country, which will ultimately drive its microscopy market.
TABLE 127 ARGENTINA: MICROSCOPY MARKET SIZE, BY PRODUCT, 2014-2021 (USD MILLION)
Product 2014 2015 2016 2021
CAGR
(2016–2021)
Optical Microscopes 16.0 16.9 17.8 23.2 5.4%
Electron Microscopes 15.0 16.7 18.6 31.4 11.1%
SPM 5.7 6.1 6.4 8.5 5.8%
Confocal Microscopes 3.8 4.0 4.4 6.2 7.1%
Total 40.6 43.7 47.2 69.3 8.0%
Source: Annual Reports, Press Releases, SEC Filings, Investor Presentations, Microscopy Society of America, Canadian Cytometry and
Microscopy Association, Chinese Electron Microcopy Society, Australian Microscopy and Microanalysis Society, Journal of
Microscopy, Journal of Advanced Microscopy Research, Expert Interviews, and MarketsandMarkets Analysis
In 2016, the electron microscopes segment is expected to account for the largest share of the microscopy
market in Argentina. This product segment is projected to reach USD 31.4 million by 2021 from USD 18.6
million in 2016, at the highest CAGR of 11.1% during the forecast period.
TABLE 128 ARGENTINA: OPTICAL MICROSCOPES MARKET SIZE, BY TYPE, 2014-2021 (USD MILLION)
Type 2014 2015 2016 2021
CAGR
(2016–2021)
Fluorescence Microscopes 11.9 12.3 12.7 14.6 2.7%
Super-resolution Microscopes 4.1 4.6 5.1 8.6 11.1%
Total 16.0 16.9 17.8 23.2 5.4%
Source: Annual Reports, Press Releases, SEC Filings, Investor Presentations, Microscopy Society of America, Canadian Cytometry and
Microscopy Association, Chinese Electron Microcopy Society, Australian Microscopy and Microanalysis Society, Journal of
Microscopy, Journal of Advanced Microscopy Research, Expert Interviews, and MarketsandMarkets Analysis
In 2016, the fluorescence microscopes segment is expected to account for a larger share of the optical
microscopes market in Argentina. This segment is projected to reach USD 14.6 million by 2021 from USD
12.7 million in 2016, at a CAGR of 2.7% during the forecast period.
140
MICROSCOPY MARKET – GLOBAL FORECAST TO 2021
© MarketsandMarkets
TABLE 129 ARGENTINA: ELECTRON MICROSCOPES MARKET SIZE, BY TYPE,
2014-2021 (USD MILLION)
Type 2014 2015 2016 2021
CAGR
(2016–2021)
SEM 11.8 13.1 14.5 24.8 11.3%
Transmission Electron
Microscopes 3.3 3.6 4.0 6.7 10.6%
Total 15.0 16.7 18.6 31.4 11.1%
Source: Annual Reports, Press Releases, SEC Filings, Investor Presentations, Microscopy Society of America, Canadian Cytometry and
Microscopy Association, Chinese Electron Microcopy Society, Australian Microscopy and Microanalysis Society, Journal of
Microscopy, Journal of Advanced Microscopy Research, Expert Interviews, and MarketsandMarkets Analysis
In 2016, the SEM segment is expected to account for a larger share of the electron microscopes market in
Argentina. This segment is projected to reach USD 24.8 million by 2021 from USD 14.5 million in 2016, at
a higher CAGR of 11.3% during the forecast period.
TABLE 130 ARGENTINA: SPM MARKET SIZE, BY TYPE, 2014-2021 (USD MILLION)
Type 2014 2015 2016 2021
CAGR
(2016–2021)
STM 3.94 4.18 4.43 5.86 5.8%
AFM 1.50 1.59 1.69 2.24 5.8%
Near-field Scanning Microscopes 0.28 0.29 0.31 0.41 5.9%
Total 5.72 6.06 6.44 8.52 5.8%
Source: Annual Reports, Press Releases, SEC Filings, Investor Presentations, Microscopy Society of America, Canadian Cytometry and
Microscopy Association, Chinese Electron Microcopy Society, Australian Microscopy and Microanalysis Society, Journal of
Microscopy, Journal of Advanced Microscopy Research, Expert Interviews, and MarketsandMarkets Analysis
In 2016, the STM segment is expected to account for the largest share of the SPM market in Argentina.
This segment is projected to reach USD 5.9 million by 2021 from USD 4.4 million in 2016, at a CAGR of
5.8% during the forecast period.
141
MICROSCOPY MARKET – GLOBAL FORECAST TO 2021
© MarketsandMarkets
FIGURE 50 NANOTECHNOLOGY APPLICATION SEGMENT TO OFFER LUCRATIVE GROWTH
OPPORTUNITIES IN ARGENTINA DURING THE FORECAST PERIOD
Source: Annual Reports, Press Releases, SEC Filings, Investor Presentations, Microscopy Society of America, Canadian Cytometry and
Microscopy Association, Chinese Electron Microcopy Society, Australian Microscopy and Microanalysis Society, Journal of
Microscopy, Journal of Advanced Microscopy Research, Expert Interviews, and MarketsandMarkets Analysis
TABLE 131 ARGENTINA: MICROSCOPY MARKET SIZE, BY APPLICATION, 2014-2021 (USD MILLION)
Application 2014 2015 2016 2021
CAGR
(2016–2021)
Semiconductors 14.2 15.3 16.6 24.4 8.1%
Life Sciences 13.8 14.9 16.2 24.3 8.5%
Material Sciences 8.1 8.5 9.0 11.6 5.1%
Nanotechnology 4.5 4.9 5.5 9.1 10.7%
Total 40.6 43.7 47.2 69.3 8.0%
Source: Annual Reports, Press Releases, SEC Filings, Investor Presentations, Microscopy Society of America, Canadian Cytometry and
Microscopy Association, Chinese Electron Microcopy Society, Australian Microscopy and Microanalysis Society, Journal of
Microscopy, Journal of Advanced Microscopy Research, Expert Interviews, and MarketsandMarkets Analysis
In 2016, the semiconductors segment is expected to account for the largest share of the microscopy
market in Argentina. This application segment is projected to reach USD 24.4 million by 2021 from USD
16.6 million in 2016, at a CAGR of 8.1% during the forecast period.
Semiconductors Life Sciences Material Sciences Nanotechnology
2016 16.6 16.2 9.0 5.5
2021 24.4 24.3 11.6 9.1
CAGR 8.0% 8.4% 5.0% 10.7%
0
5
10
15
20
25
30
MarketSize(USDMillion)
142
MICROSCOPY MARKET – GLOBAL FORECAST TO 2021
© MarketsandMarkets
TABLE 132 ARGENTINA: MICROSCOPY MARKET SIZE, BY END USER, 2014-2021 (USD MILLION)
End User 2014 2015 2016 2021
CAGR
(2016–2021)
Academic Institutes 20.5 22.5 24.6 38.7 9.5%
Industries 12.5 13.3 14.3 20.2 7.1%
Other End User 7.5 7.9 8.3 10.4 4.7%
Total 40.6 43.7 47.2 69.3 8.0%
Source: Annual Reports, Press Releases, SEC Filings, Investor Presentations, Microscopy Society of America, Canadian Cytometry and
Microscopy Association, Chinese Electron Microcopy Society, Australian Microscopy and Microanalysis Society, Journal of
Microscopy, Journal of Advanced Microscopy Research, Expert Interviews, and MarketsandMarkets Analysis
In 2016, the academic institutes segment is expected to account for the largest share of the microscopy
market in Argentina. This end-user segment is projected to reach USD 38.7 million by 2021 from USD 24.6
million in 2016, at the highest CAGR of 9.5% during the forecast period.
9.5.4 REST OF LATIN AMERICA (ROLA)
The Rest of Latin America (RoLA) region consists of microscopy markets in Chile, Colombia, and Peru. This
segment is expected to account for a 23.7% share of the RoW microscopy market in 2016. Among the
countries in RoLA, Chile has the highest growth potential for the microscopy market. Government initiatives
to boost research and development are the major driver of market growth. In 1981, the Chilean
government created the national fund for scientific and technological development (FONDECYT) to promote
basic scientific and technological research in the country. Since 1981, it has funded more than 16,000
research projects. In 2013, it spent USD 158.2 million on various research projects. In addition, the
growing biotechnology and clinical trials market in Chile represents huge growth potential for the
microscopy market in the country.
Colombia and Peru also represent significant markets for microscopy in the RoLA region. Colombia has
attracted scientific and technological investment due to the 125% income tax exemption for investing
companies. On the other hand, Peru, with its agriculture-based economy, represents a potential research
base for the biotechnology industry.
TABLE 133 ROLA: MICROSCOPY MARKET SIZE, BY PRODUCT, 2014-2021 (USD MILLION)
Product 2014 2015 2016 2021
CAGR
(2016–2021)
Optical Microscopes 39.6 41.6 43.7 55.5 4.9%
Electron Microscopes 37.2 41.1 45.4 75.1 10.6%
SPM 14.1 14.9 15.8 20.4 5.3%
Confocal Microscopes 9.3 10.0 10.7 14.7 6.6%
Total 100.3 107.6 115.6 165.7 7.5%
Source: Annual Reports, Press Releases, SEC Filings, Investor Presentations, Microscopy Society of America, Canadian Cytometry and
Microscopy Association, Chinese Electron Microcopy Society, Australian Microscopy and Microanalysis Society, Journal of
Microscopy, Journal of Advanced Microscopy Research, Expert Interviews, and MarketsandMarkets Analysis
In 2016, the electron microscopes segment is expected to account for the largest share of the microscopy
market in the RoLA. This product segment is projected to reach USD 75.1 million by 2021 from USD 45.4
million in 2016, at the highest CAGR of 10.6% during the forecast period.
143
MICROSCOPY MARKET – GLOBAL FORECAST TO 2021
© MarketsandMarkets
TABLE 134 ROLA: OPTICAL MICROSCOPES MARKET SIZE, BY TYPE, 2014-2021 (USD MILLION)
Type 2014 2015 2016 2021
CAGR
(2016–2021)
Fluorescence Microscopes 29.5 30.3 31.1 34.8 2.3%
Super-resolution Microscopes 10.1 11.3 12.5 20.7 10.6%
Total 39.6 41.6 43.7 55.5 4.9%
Source: Annual Reports, Press Releases, SEC Filings, Investor Presentations, Microscopy Society of America, Canadian Cytometry and
Microscopy Association, Chinese Electron Microcopy Society, Australian Microscopy and Microanalysis Society, Journal of
Microscopy, Journal of Advanced Microscopy Research, Expert Interviews, and MarketsandMarkets Analysis
In 2016, the fluorescence microscopes segment is expected to account for a larger share of the optical
microscopes market in the RoLA region. This segment is projected to reach USD 34.8 million by 2021 from
USD 31.1 million in 2016, at a CAGR of 2.3% during the forecast period.
TABLE 135 ROLA: ELECTRON MICROSCOPES MARKET SIZE, BY TYPE, 2014-2021 (USD MILLION)
Type 2014 2015 2016 2021
CAGR
(2016–2021)
SEM 29.1 32.2 35.6 59.2 10.7%
Transmission Electron
Microscopes 8.2 9.0 9.9 15.9 10.1%
Total 37.2 41.1 45.4 75.1 10.6%
Source: Annual Reports, Press Releases, SEC Filings, Investor Presentations, Microscopy Society of America, Canadian Cytometry and
Microscopy Association, Chinese Electron Microcopy Society, Australian Microscopy and Microanalysis Society, Journal of
Microscopy, Journal of Advanced Microscopy Research, Expert Interviews, and MarketsandMarkets Analysis
In 2016, the SEM segment is expected to account for a larger share of the electron microscopes market in
the RoLA. This segment is projected to reach USD 59.2 million by 2021 from USD 35.6 million in 2016, at
a higher CAGR of 10.7% during the forecast period.
FIGURE 51 STM TO ACCOUNT FOR THE HIGHEST SHARE IN THE SPM MARKET IN ROLA IN
2016
Source: Annual Reports, Press Releases, SEC Filings, Investor Presentations, Microscopy Society of America, Canadian Cytometry and
Microscopy Association, Chinese Electron Microcopy Society, Australian Microscopy and Microanalysis Society, Journal of
Microscopy, Journal of Advanced Microscopy Research, Expert Interviews, and MarketsandMarkets Analysis
Scanning Tunneling
Microscopes
Atomic Force Microscopes
Near-field Scanning
Microscopes
2016 10.8 4.1 0.8
2021 14.0 5.4 1.0
CAGR 5.2% 5.3% 5.3%
0
2
4
6
8
10
12
14
16
MarketSize(USDMillion)
144
MICROSCOPY MARKET – GLOBAL FORECAST TO 2021
© MarketsandMarkets
TABLE 136 ROLA: SPM MARKET SIZE, BY TYPE, 2014-2021 (USD MILLION)
Type 2014 2015 2016 2021
CAGR
(2016–2021)
STM 9.7 10.3 10.8 14.0 5.3%
AFM 3.7 3.9 4.1 5.4 5.3%
Near-field Scanning Microscopes 0.7 0.7 0.8 1.0 5.4%
Total 14.1 14.9 15.8 20.4 5.3%
Source: Annual Reports, Press Releases, SEC Filings, Investor Presentations, Microscopy Society of America, Canadian Cytometry and
Microscopy Association, Chinese Electron Microcopy Society, Australian Microscopy and Microanalysis Society, Journal of
Microscopy, Journal of Advanced Microscopy Research, Expert Interviews, and MarketsandMarkets Analysis
In 2016, the STM segment is expected to account for the largest share of the SPM market in the RoLA.
This segment is projected to reach USD 14.0 million by 2021 from USD 10.8 million in 2016, at a CAGR of
5.3% during the forecast period.
TABLE 137 ROLA: MICROSCOPY MARKET SIZE, BY APPLICATION, 2014-2021 (USD MILLION)
Application 2014 2015 2016 2021
CAGR
(2016–2021)
Semiconductors 35.1 37.7 40.6 58.4 7.6%
Life Sciences 34.1 36.7 39.6 58.0 7.9%
Material Sciences 20.1 21.0 22.1 27.6 4.6%
Nanotechnology 11.0 12.1 13.4 21.7 10.2%
Total 100.3 107.6 115.6 165.7 7.5%
Source: Annual Reports, Press Releases, SEC Filings, Investor Presentations, Microscopy Society of America, Canadian Cytometry and
Microscopy Association, Chinese Electron Microcopy Society, Australian Microscopy and Microanalysis Society, Journal of
Microscopy, Journal of Advanced Microscopy Research, Expert Interviews, and MarketsandMarkets Analysis
In 2016, the semiconductors segment is expected to account for the largest share of the microscopy
market in the RoLA. This application segment is projected to reach USD 58.4 million by 2021 from USD
40.6 million in 2016, at a CAGR of 7.6% during the forecast period.
TABLE 138 ROLA: MICROSCOPY MARKET SIZE, BY END USER, 2014-2021 (USD MILLION)
End User 2014 2015 2016 2021
CAGR
(2016–2021)
Academic Institutes 50.8 55.3 60.3 92.6 9.0%
Industries 30.8 32.8 35.0 48.3 6.6%
Other End User 18.7 19.4 20.3 24.9 4.2%
Total 100.3 107.6 115.6 165.7 7.5%
Source: Annual Reports, Press Releases, SEC Filings, Investor Presentations, Microscopy Society of America, Canadian Cytometry and
Microscopy Association, Chinese Electron Microcopy Society, Australian Microscopy and Microanalysis Society, Journal of
Microscopy, Journal of Advanced Microscopy Research, Expert Interviews, and MarketsandMarkets Analysis
In 2016, the academic institutes segment is expected to account for the largest share of the microscopy
market in the RoLA. This end-user segment is projected to reach USD 92.6 million by 2021 from USD 60.3
million in 2016, at a CAGR of 9.0% during the forecast period.
145
MICROSCOPY MARKET – GLOBAL FORECAST TO 2021
© MarketsandMarkets
10 COMPETITIVE LANDSCAPE
KEY FINDINGS
 New product launches was the most widely adopted growth strategy; it accounted for 82.03% of
the total number of strategies pursued by key companies in the microscopy market
 Agreements, partnerships, and collaborations was the second-most preferred strategy pursued
by companies in the microscopy market; it accounted for a share of 10.94%
 Acquisitions accounted for a share of 3.91% of the total number of strategies adopted by
companies in the microscopy market
 Expansions accounted for a share of 3.13% of the total number of strategies adopted by
companies in the microscopy market
 Leica Microsystems (Danaher Corporation) (U.S.), Carl Zeiss (Germany), Nikon Corporation
(Japan), and FEI Company (Japan) are key companies active in the microscopy market
146
MICROSCOPY MARKET – GLOBAL FORECAST TO 2021
© MarketsandMarkets
10.1 OVERVIEW
This section of the report analyzes the strategies adopted by companies in the microscopy market between
2013 and 2016. Companies have implemented different strategies in order to maintain their positions and
ensure long-term growth in the microscopy market. The key strategies implemented by companies in the
microscopy market are new product launches; agreements, collaborations, and partnerships; acquisitions;
and expansions.
FIGURE 52 COMPANIES MAINLY PURSUED THE STRATEGY OF NEW PRODUCT LAUNCHES
FROM 2013 TO JULY 2016
Note: Indicates events that will have a significant impact on the market
Source: Press Releases, Expert Interviews, and MarketsandMarkets Analysis
ORGANIC GROWTH STRATEGIES INORGANIC GROWTH STRATEGIES
New Product Launches
Agreements, Collaborations,
and Partnerships
Expansions Acquisitions
DANAHER
CORPORATION (LEICA
MICROSYSTEMS)
CARL ZEISS AG
BRUKER
CORPORATION
NIKON
CORPORATION
FEI CO.
• Vutara 352 Super-resolution
Microscope
• Contour Elite 3D Optical
Microscopes
• Ultima Investigator Multiphoton
Microscope
• Opterra Il Multipoint Scanning
Confocal Microscope
COMPANY
NAME
• Carl Zeiss acquired Xradia, Inc.
(U.S.)
• Leica Microsystems
Collaborated with Yale
University (U.S.)
• Leica Microsystems Entered into
an Agreement with TrueVision
3D Surgical (U.S.)
• ZEISS LSM 880 Confocal
Laser Scanning Microscope
• ZEISS GeminiSEM and ZEISS
Sigma Field Emission Scanning
Electron Microscopes
• Apreo Scanning Electron
Microscope (SEM)
• Helios NanoLab G3 DualBeam,
a Combination of Electron and
Ion Optics Microscopy
• ECLIPSE Ts2R, a Compact
Inverted Research Microscope
• NIS-Elements C-ER High-
resolution Confocal Imaging
Software
• Leica Microsystems Established an
Experience Lab in Tokyo, Japan
• FEI Co. acquired Lithicon AS,
Australia
• FEI Co. acquired nanoTechnology
Systems Pty. Ltd. (NTS) (Australia)
• Partnered with the University of
Manchester’s National Graphene
Institute (NGI)
• Carl Zeiss Entered into a
Public-private Partnership
with UC Berkeley
• Carl Zeiss Collaborated with the
University of California, Berkeley
• Leica DM4 B and Leica DM6 B
Upright Research Microscopes
• Leica EM Cryo CLEM Light and
Electron Microscope (CLEM)
• Leica M530 OH6
Neurosurgical Microscope
• FEI Co. Opened a New
Technology Center in the Czech
Republic
• Acquired Vutara Inc. (U.S.)
• Acquired Prairie Technologies, Inc.
(U.S.)
• FEI Company Partnered with
NovAliX (France)
• FEI Co. collaborated with the
Metal Labs at The University of
Manchester's Electron
Microscopy Centre in the School
of Materials
147
MICROSCOPY MARKET – GLOBAL FORECAST TO 2021
© MarketsandMarkets
10.2 MARKET ANALYSIS
In 2015, the global optical microscopes market was dominated by Carl Zeiss (Germany), Leica
Microsystems (Germany), Nikon Corporation (Japan), and Olympus Corporation (Japan). The electron
microscopes market, on the other hand, was dominated by FEI Co. (U.S.), JEOL (Japan), and Hitachi High-
Technologies (Japan).
TABLE 139 OPTICAL MICROSCOPES MARKET RANKING, BY KEY COMPANY, 2015
Company Name Ranking
Carl Zeiss 1
Nikon Corporation 2
Olympus Corporation 3
Danaher Corporation (Leica Microsystems) 4
Source: Annual Reports, SEC Filings, Press Releases, Investor Presentations, Expert Interviews, and MarketsandMarkets Analysis
Among the top four companies in the optical microscopes market, Carl Zeiss held the top position in 2015.
The company has strengthened its position in the market through the adoption of organic strategies such
as new product launches and collaborations, agreements, and partnerships. Between 2013 and 2016, the
company introduced various new products into its portfolio. For instance, in January 2016, Carl Zeiss
introduced ZEISS Xradia Versa with FPX, an extension for the ZEISS Xradia Versa 500-series of 3D X-ray
microscopes. The company also focuses on entering into collaborative agreements with academic
institutions. In accordance with this, in June 2015, Carl Zeiss entered into a public-private partnership with
UC Berkeley as part of the Brain Microscopy Innovation Center (BrainMIC), Berkeley BRAIN Initiative.
Nikon Corporation held the second position in the optical microscopes market in 2015. The company
focuses on launching new products in the microscopy segment. From 2013 to 2016, the company
launched a wide range of innovative products, such as the ECLIPSE Ts2R compact inverted research
microscope, the NIS-Elements C-ERDS-Ri2 high-resolution confocal imaging software, the DS-Qi2
monochrome microscope camera, the Ti-LAPP laser application system, and a wide range of stereo
microscopes.
Olympus Corporation held the third position in the optical microscopes market in 2015. The company
adopted new product launches as its key strategy to strengthen its position in the market. In the past three
years, the company has launched various microscopes, such as measuring microscopes, standalone
microscopes, and super-resolution microscopes.
Leica Microsystems held the fourth position in the optical microscopes market. The company has a robust
product portfolio in the field of microscopy and has maintained its position in the market through
continuous launch of products. In 2015, the company launched a wide range of innovative products, such
as the Leica DMi8 (an inverted research microscope platform), the Leica DM4 B and the Leica DM6 B
upright research microscope series, the Leica DVM6 digital microscope, and the Leica EM Cryo CLEM.
148
MICROSCOPY MARKET – GLOBAL FORECAST TO 2021
© MarketsandMarkets
TABLE 140 ELECTRON MICROSCOPES MARKET RANKING, BY KEY COMPANY, 2015
Company Name Ranking
FEI Co. 1
JEOL Ltd. 2
Hitachi High-Technologies Corporation 3
Source: Annual Reports, SEC Filings, Press Releases, Investor Presentations, Expert Interviews, and MarketsandMarkets Analysis
FEI Co. dominated the electron microscopes market in 2015. The company has maintained its footprint in
the global electron microscopy market through continuous launch of innovative products. In the past three
years, the company has launched a wide range of microscopes such as the Apreo scanning electron
microscope (SEM), the Helios NanoLab G3 DualBeam —which is a combination of electron and ion optics
microscopy, the Teneo VolumeScope (VS), the scanning electron microscope (SEM), and the Titan Halo
transmission electron microscope (TEM).
JEOL Ltd. accounted for the second position in the electron microscopes market. The company has a wide
range of products and a significant global footprint in the microscopy market. To strengthen its position in
this market, the company focuses on new product launch as its key strategy. In 2016, JEOL launched the
JEM-F200, a multi-purpose transmission electron microscope, and JSM-IT100 InTouchScope scanning
electron microscope.
Hitachi High-Technologies held the third position in the electron microscopes market in 2015. The
company strives to launch advanced electron microscopes and pursues the strategy of expansions in order
to strengthen its position in the market. In accordance with this, the company established its Hitachi High-
Technologies India Private Limited (Hitachi High-Tech India) subsidiary in Haryana, India, and a new
production site in Omuta, Japan.
TABLE 141 CONFOCAL MICROSCOPES MARKET RANKING, BY KEY COMPANY, 2015
Company Name Ranking
Carl Zeiss 1
Nikon Corporation 2
Danaher Corporation (Leica Microsystems) 3
Olympus Corporation 4
Source: Annual Reports, SEC Filings, Press Releases, Investor Presentations, Expert Interviews, and MarketsandMarkets Analysis
Among the top companies in the confocal microscopes segment, Carl Zeiss held the leading position in
2015. The company has retained its global leadership position through its broad range of innovative
products. In May 2016, the company launched the ZEISS LSM 880 with Airyscan detector, a new confocal
laser scanning microscope. Similarly, it introduced the ZEISS LSM 880 in April 2016, which is a confocal
laser scanning microscope for material science and failure analysis; and the Smartproof 5 in January
2016, a widefield confocal microscope for industrial applications.
149
MICROSCOPY MARKET – GLOBAL FORECAST TO 2021
© MarketsandMarkets
TABLE 142 SPM MARKET SHARE, BY KEY COMPANY, 2015
Company Name Ranking
Bruker Corporation 1
Asylum Research (Oxford Instruments) 2
NT-MDT 3
Agilent Technologies 4
Source: Annual Reports, SEC Filings, Press Releases, Investor Presentations, Expert Interviews, and MarketsandMarkets Analysis
Bruker Corporation was the leading participant in the SPM market in 2015. The company has maintained
its footprint in the global SPM market through continuous launches of new and innovative products. In May
2016, Bruker Corporation launched its SENTERRA II, a compact research-grade confocal multi-laser
Raman microscope. In addition, in August 2015, the company launched its Opterra II, a multipoint
scanning confocal microscope for quantitative live-cell analysis.
10.3 BATTLE FOR MARKET SHARE: NEW PRODUCT LAUNCHES IS
THEKEY GROWTH STRATEGY ADOPTED BY MARKET COMPANIES
As microscopy is a technology -industry, new product launches is the key strategy employed by market
leading companies to remain competitive.
3.1%
Expansions
10.9%
Agreements,
Partnerships, and
Collaborations
82.1%
New Product
Launches
3.9%
Acquisitions
150
MICROSCOPY MARKET – GLOBAL FORECAST TO 2021
© MarketsandMarkets
10.4 NEW PRODUCT LAUNCHES
Maximum new product launches were witnessed in the optical microscopes segment. In September 2014,
Leica Microsystems launched the Leica DMi8 inverted microscope, which is equipped with additional
features such as incident illumination port, infinity port, and laser systems.
The strategy of new product launches accounted for the largest share of 82.1% of the total strategic
developments in the global microscopy market. Companies adopted this strategy to develop new and
advanced products, strengthen their product portfolios, and cater to the unmet needs of their customers.
FEI Company (U.S.), Carl Zeiss (Germany), Hitachi High-Technologies (Japan), JEOL (Japan), Bruker
Corporation (U.S.), and Asylum Research (U.S.) are among the leading manufacturing companies that
adopted this strategy.
TABLE 143 NEW PRODUCT LAUNCHES, 2013–2016
Month & Year Company Name Description
May 2016 FEI Co. (U.S.)
FEI introduced Apreo, a scanning electron microscope (SEM). The
product utilizes the proprietary compound final lens design that allows
improvement in resolution and backscatter detection at the lowest
beam current.
April 2016 Carl Zeiss (Germany)
Carl Zeiss launched ZEISS LSM 880, a confocal laser scanning
microscope for material science and failure analysis. The product
comprises of the confocal fluorescence and other contrasting
techniques that enables high-precision examination of nanomaterials,
metals, polymers, and semiconductors, with maximum information
content. The product also offers precise capture of 3D topography and
the investigation of nanometer-scaled structures. This launch will help
the company strengthen its confocal laser scanning microscope
portfolio.
December 2015
Bruker Corporation
(U.S.)
Bruker Corporation introduced Vutara 352, a super resolution
microscope with high speed, more imaging depth, better resolution, and
real-time quantitative capabilities as well as multimodal imaging. Vutara
352 can perform pair-correlation, co-location, cluster, and live-cell
analysis with super resolution. This new launch will help the company to
meet growing demand for high-speed imaging in the life science
industry.
November 2015
Nikon Corporation
(Japan)
Nikon Corporation launched ECLIPSE Ts2R, a compact inverted
research microscope, which is easy to use and offers a wide variety of
observation methods for medical and biological research fields. This
launch will help the company enhance its brand image and strengthen
its market presence.
October 2015
Leica Microsystems
(U.S.)
Leica Microsystems introduced DMi8, an inverted research microscope
platform. The product offers observation via an external, remote
operation and monitoring, high throughput and complex screening.
Leica DMi8 can be configured without the optical components
associated with this optical path.
Source: Press Releases
151
MICROSCOPY MARKET – GLOBAL FORECAST TO 2021
© MarketsandMarkets
10.5 AGREEMENTS, PARTNERSHIPS, AND COLLABORATIONS
Agreements, partnerships, and collaborations accounted for 10.9% of the total strategic developments in
the microscopy market during 2013 to 2016. Companies such as FEI Company (U.S.), Leica Microsystems
(Danaher Corporation) (U.S.), Carl Zeiss (Germany), Hitachi High-Technologies Corporation (Japan), JEOL
(Japan), Bruker Corporation (U.S.), and Asylum Research (U.S.) adopted this strategy to increase their
geographic reach and expand their product portfolios.
TABLE 144 AGREEMENTS, PARTNERSHIPS, AND COLLABORATIONS, 2013–2016
Month & Year Company Name Description
March 2016
FEI Company (U.S.) and
NovAliX (France)
FEI Company and NovAliX (France), a contract research
organization, entered into a partnership to provide cryo-electron
microscopy-based structural biology services for the
pharmaceutical and biotech industry. The partnership combines
application, training, and support with on-site personnel from FEI.
This partnership will help the company to step into the broader
commercialization and industrialization of the technology.
June 2015
Carl Zeiss (Germany) and
UC Berkeley (U.S.)
Carl Zeiss entered into a public-private partnership with UC
Berkeley (U.S.) as part of the Brain Microscopy Innovation Center
(BrainMIC), Berkeley BRAIN Initiative. As part of the initiative, Carl
Zeiss has delivered a variety of high performance microscopes
and imaging systems. Under the partnership, Carl Zeiss will offer
the latest updates of the equipment and, in turn, UC Berkeley
researchers will provide feedback on any new or special
neurotechnology needs to help Carl Zeiss produce future products
best suited for the latest advances in neuroscience research
endeavors.
September 2014
Leica Microsystems (U.S.)
and Yale University (U.S.)
Leica Microsystems collaborated with Yale University (U.S.) to
establish a new Microscopy Center of Excellence at Yale
University’s campus. This collaboration has strengthened the
company’s market reach in the U.S.
August 2014
JEOL (Japan) with the
Oxford University (U.K.),
Johnson Matthey (U.K.),
and Diamond Light Source
(U.K.)
JEOL collaborated with Oxford University (U.K.), Johnson Matthey
(U.K.), and Diamond Light Source (U.K.), to establish a materials
characterization facility at the Harwell Science and Innovation
Campus.
April 2014
Leica Microsystems (U.S.)
and TrueVision 3D
Surgical (U.S.)
Leica Microsystems entered into an agreement with TrueVision
3D Surgical (U.S.), a neuro and ophthalmic 3D surgical
visualization and guidance company. This agreement is aimed to
incorporate the computer guidance platform of TrueVision into
Leica’s ophthalmic microscopes for cataract and refractive
surgeries. This agreement leveraged the expertise of TrueVision
for developing technologically advanced products for Leica.
Source: Press Releases
152
MICROSCOPY MARKET – GLOBAL FORECAST TO 2021
© MarketsandMarkets
10.6 ACQUISITIONS
Acquisitions accounted for 3.9% of the total strategic developments in the microscopy market. Major
companies that adopted this strategy are Bruker Corporation (U.S.), Carl Zeiss (Germany), and FEI Co.
(U.S.).
TABLE 145 ACQUISITIONS, 2013–2016
Month & Year Company Name Description
July 2014
Bruker Corporation (U.S.)
acquired Vutara Inc. (U.S.)
Bruker Corporation acquired Vutara Inc. (U.S.), a technology
leader in high-speed, 3D, and super-resolution fluorescence
microscopy, to utilize Vutara’s expertise. This acquisition
strengthened Bruker’s biological microscopy segment by
leveraging the expertise of Vutara and for including super-
resolution and single-molecule localization (SML) microscopy in
Bruker’s product portfolio.
February 2014
FEI Co. (U.S.) acquired
Lithicon AS (Australia)
FEI Co. acquired Lithicon AS, Australia. This acquisition was
conducted to access Lithicon’s expertise in digital rock technology
services and core imaging and analysis. This helped FEI Co.
extend its microscopy product line.
September 2013
Bruker Corporation (U.S.)
acquired Prairie
Technologies, Inc. (U.S.)
Bruker Corporation acquired Prairie Technologies, Inc. (U.S.), a
provider of life science fluorescence microscopy products. This
acquisition aimed to leverage Prairie’s expertise in Bruker’s
existing life science atomic force microscopy (Bio-AFM) systems.
The acquisition has strengthened Bruker’s Nano Surfaces Division
in the life sciences market.
August 2013
FEI Co. (U.S.) acquired
nanoTechnology Systems
Pty. Ltd. (NTS) (Australia),
FEI Co. acquired nanoTechnology Systems Pty. Ltd. (NTS)
(Australia), an electron and ion beam systems supplier.
nanoTechnology Systems has been the distributor of FEI’s
products for 10 years. This helped FEI expand its business in
Australia and the Pacific countries.
July 2013
Carl Zeiss (Germany)
acquired Xradia, Inc.
(U.S.),
Carl Zeiss acquired Xradia, Inc. (U.S.), a provider of innovative 3D
X-ray microscopes for industrial and academic research
applications. Xradia, Inc. is now operating under the new name of
Carl Zeiss X-ray Microscopy, Inc. This acquisition was to utilize
Xradia’s expertise in Zeiss’ microscopy business, and it has
helped Zeiss expand its business from light and electron
microscopy to X-ray microscopy solutions.
Source: Press Releases
153
MICROSCOPY MARKET – GLOBAL FORECAST TO 2021
© MarketsandMarkets
10.7 EXPANSIONS
Expansions accounted for 3.1% of the total strategic developments adopted by companies in the
microscopy market. Companies adopted this strategy to expand their global presence. This key strategy
was mainly adopted by FEI Company (U.S.), Hitachi High-Technologies (Japan), JEOL (Japan), Asylum
Research (U.S.), and Leica Microsystems (Danaher Corporation) (U.S.).
TABLE 146 EXPANSIONS, 2013-2016
Month & Year Company Name Description
September 2014 FEI Co. (U.S.)
FEI Co. opened a new technology center in the Czech Republic,
in which the company invested CZK 800 million (approximately
USD 38 million). This new setup is intended to employ about
600 people and produce approximately 60% of FEI’s electron
microscopes. This will help the company expand its market in
the European region.
April 2014 Leica Microsystems (U.S.)
Leica Microsystems expanded its business by introducing an
Experience Lab in Tokyo, Japan. This expansion helped the
company expand its presence and customer base in Japan.
July 2014 Asylum Research (U.S.)
Asylum Research opened its first Nanotechnology Lab for Atomic
Force Microscopy (AFM) in India. This lab is equipped with MFP-
3D Classic and the MFP-3D Origin technology, which adds to the
range of industrial analysis tools available for demonstration.
This expansion helped the company strengthen its AFM market
in the Asia-Pacific region.
April 2013
Hitachi High-Technologies
(Japan)
Hitachi High-Technologies created a subsidiary, Hitachi High-
Technologies India Private Limited (Hitachi High-Tech India) in
Haryana, India. This new subsidiary mainly focuses on sale of
industrial-use equipment, industrial materials, electronic
materials and software, and related services. This will help the
company increase its sales in the Asia-Pacific region.
Source: Press Releases
154
MICROSCOPY MARKET – GLOBAL FORECAST TO 2021
© MarketsandMarkets
11 COMPANY PROFILES
11.1 INTRODUCTION
FIGURE 53 GEOGRAPHIC REVENUE MIX OF THE TOP FIVE MARKET COMPANIES IN 2015
*Note: Geographic shares are derived from the overall revenues of the individual companies in 2015.
EMEA - Europe, the Middle East, and Africa
Source: Annual Reports, SEC Filings, Press Releases, Investor Presentations, and MarketsandMarkets Analysis
COMPANY
MEDIUM
(20%–40%)
VERY HIGH
(60% and Above)
BRUKER CORPORATION
CARL ZEISS AG
FEI CO.
NIKON CORPORATION
DANAHER CORPORATION
(LEICA MICROSYSTEMS)
LOW
*(0%–20%) (40%–60%)
HIGH
ASIA-PACIFICEMEAAMERICAS
155
MICROSCOPY MARKET – GLOBAL FORECAST TO 2021
© MarketsandMarkets
11.2 BRUKER CORPORATION
11.2.1 BUSINESS OVERVIEW
Founded in 1960, with headquarters in Massachusetts, U.S., Bruker Corporation designs, manufactures,
and provides proprietary life science systems based on spectrometry technology platforms in more than 90
countries across the globe. The company develops tools for research on life science and advanced
materials based on X-ray technology, and offers a wide range of field analytical systems for substance
detection and pathogen identification. Bruker operates through two segments, Bruker Scientific
Instruments (BSI) and Bruker Energy & Supercon Technologies (BEST). The BSI segment caters to the
company’s microscopy business.
The company operates in the U.S., Europe, and the Asia-Pacific region, and its end users include medical
companies, private and public research and development laboratories, academic institutions, and
government agencies. As of 2015, the company had a headcount of 6,000 employees.
FIGURE 54 BRUKER CORPORATION: COMPANY SNAPSHOT
*Note: The total for business revenue mix is more than 100% due to eliminations.
Source: Company Website, Annual Reports, and SEC Filings
Founded: 1960
Headquarters: Massachusetts, U.S.
No. of Employees: 6,000
Revenue: USD 1,623.8 Million
R&D Expenditure: USD 145.7 Million
Ownership: Public
COMPANY AT A GLANCE - 2015
GEOGRAPHIC REVENUE MIX BUSINESS REVENUE MIX
RECENT FINANCIALS
41.8%
25.6%
23.4%
9.2% Europe
Asia-Pacific
U.S.
Rest of the World 91.8%
8.2%
Bruker Scientific Instruments
(BSI)
Bruker Energy and Supercon
Technologies (BEST)
1,839.4 1,808.9 1,623.8
10.4%
9.6%
9.0%
8.0%
8.5%
9.0%
9.5%
10.0%
10.5%
1,500
1,550
1,600
1,650
1,700
1,750
1,800
1,850
1,900
2013 2014 2015
R&DExpenditure(%)
TotalRevenue(USDMillion)
156
MICROSCOPY MARKET – GLOBAL FORECAST TO 2021
© MarketsandMarkets
11.2.2 PRODUCTS OFFERED
Category Product
Atomic Force Microscopy (AFM)
 Dimension FastScan
 MultiMode 8
 Dimension Icon
 BioScope Catalyst
 Dimension FastScan Bio
 Inspire
 Innova-IRIS
 Dimension Icon- Raman
 BioScope Catalyst-IRIS
 Dimension Edge
 Innova
 Dimension Edge PSS
 InSight-450 3DAFM
 InSight 3DAFM
 Dimension AFP
 AFM Probes and Accessories
Surface Analysis
 Atomic Force Microscopes
 3D Optical Microscopes
FTIR Microscopes/Raman Microscopes
 HYPERION Series FT-IR Microscopes
 SENTERRA II Compact Raman Microscope
 LUMOS FTIR Microscope
3D Industrial Optical Microscopy
 ContourGT-I
 ContourGT InMotion
 ContourGT-K
 ContourGT-X
 NPFLEX-LA
 NPFLEX
 ContourSP
 HD9800+
Stylus Profilometry
 DektakXT
 Dektak XTL
Fluorescence Optical Microscopy
 Opterra
 Opterra II
 Opterra Multipoint Confocal
 Vutara 350
 Vutara 352
 Vutara Super-resolution
 Ultima
 Ultima In Vivo
 Ultima Multiphoton
157
MICROSCOPY MARKET – GLOBAL FORECAST TO 2021
© MarketsandMarkets
11.2.3 RECENT DEVELOPMENTS
Month & Year Approach Description
May 2016
Product
Enhancement
Bruker Corporation launched SENTERRA II, a compact research-grade
confocal multi-laser Raman microscope. SENTERRA II is the advanced
version of SENTERRA with novel features such as compact size, easy-
to-use interface, and higher resolution. The microscope has a wide
array of applications, including in material science, pharmaceutical
and novel nano-materials, life science, forensics, art, and geology.
January 2016
Product
Enhancement
Bruker’s Nano Surfaces Division introduced the MultiMode 8-HR
Atomic Force Microscope (AFM) replacing the successor model—
MultiMode platform. MultiMode 8-HR offers enhanced capabilities
such as high speed and higher resolution imaging for nanomechanics.
With this launch, the company has enhanced its visibility in the highly
competitive microscopy market.
December 2015 New Product Launch
Bruker Corporation introduced Vutara 352, a super-resolution
microscope with high speed, more imaging depth, better resolution,
and real-time quantitative capabilities & multimodal imaging. Vutara
352 can perform pair-correlation, co-location, cluster, and live-cell
analysis with super resolution. This new launch will help the company
cater to growing demand for high-speed imaging in the life sciences
industry.
November 2015 New Product Launch
Bruker Corporation launched the Ultima Investigator Multiphoton
Microscope for high-performance in vivo imaging. For advanced in
vivo neural activity research, Ultima Investigator utilizes a rotatable
nose piece that allows off-axis imaging, which is useful for brain
imaging applications.
August 2015 New Product Launch
Bruker Corporation launched Opterra II, a multipoint scanning
confocal microscope that symbolizes the next generation of
quantitative live-cell microscopes. Opterra II has features such as high
speed and resolution, illumination uniformity, low photo-toxicity, and
photo-bleaching capabilities.
May 2015 New Product Launch
Bruker Corporation introduced the Contour Elite 3D Optical
Microscope, a fully integrated, high-definition microscope with three-
dimensional (3D) optical metrology functionality. With features like
high-speed operation, accuracy, repeatability, and imaging & display
advantage, the microscope is useful for top-level research and
development and production QC facilities.
September 2014 New Product Launch
Bruker Corporation introduced Innova-IRIS, the first guaranteed Tip-
enhanced Raman Spectroscopy (TERS) system designed to accelerate
the adoption of nano-Raman spectroscopy research. Innova-IRIS is a
combination of TERS probes based on high-contrast tuning-fork with
nano-Raman spectroscopy and high-performance atomic force
microscopy (AFM) capabilities. This launch enabled the company to
provide technologically-advanced products to its customers.
July 2014 Acquisition
Bruker Corporation acquired Vutara Inc. (U.S.), a technology leader in
high-speed, 3D, and super-resolution fluorescence microscopy. This
acquisition strengthened Bruker’s biological microscopy segment by
leveraging the expertise of Vutara and including super-resolution and
single-molecule localization (SML) microscopy in Bruker’s product
portfolio.
158
MICROSCOPY MARKET – GLOBAL FORECAST TO 2021
© MarketsandMarkets
Month & Year Approach Description
July 2014 New Product Launch
Bruker Corporation unveiled Inspire, its first integrated scanning
probe microscopy (SPM) infrared system. This product is the
integration of four technologies, namely, infrared scattering, scanning
near-field optical microscope (sSNOM) optics, point-and-click
alignment, and PeakForce Tapping. This launch helped the company
strengthen its position in the emerging microscopy market.
December 2013 New Product Launch
Bruker Corporation introduced the Opterra Multipoint Scanning
Confocal Microscope at the American Society for Cell Biology Annual
Meeting. This microscope is used for the betterment of resolution and
fast confocal imaging of live cell preparations. This launch
strengthened the company’s product portfolio and provided flexible
optical workstations to its end users.
Source: Press Releases
11.2.4 MNM VIEW
Bruker Corporation is among the leading companies in the microscopy market, owing to its broad product
portfolio of atomic force and fluorescence microscopes and its strong geographic presence in North
America, Europe, Latin America, Africa, Asia, and Australia. In order to sustain its market position, the
company pursues the strategy of new product launches. The company generates a majority of its revenue
from the European market, followed by the Asia-Pacific region and the U.S. Hence, international markets
present significant growth opportunities for the company.
In 2015, the company witnessed a 10.2% dip in its total revenue, as compared to that of 2014. This
decline can be attributed to the fluctuating foreign currency rates and divestiture of the company’s former
Chemical and Applied Markets (CAM) division. Similarly, the company witnessed a decline in research and
development expenditure by 16.4% in 2015 compared to the previous year. This decrease was due to
recent divestitures and restructuring actions.
159
MICROSCOPY MARKET – GLOBAL FORECAST TO 2021
© MarketsandMarkets
11.3 LEICA MICROSYSTEMS GMBH
11.3.1 BUSINESS OVERVIEW
Founded in 1969, with headquarters at Washington D.C., U.S., Danaher Corporation designs and
manufactures medical, industrial, and commercial products and services. The company conducts its
business through five segments, namely, Life Sciences and Diagnostics, Industrial Technologies,
Environmental, Dental, and Test & Measurement. In 2005, Danaher Corporation acquired Leica
Microsystems and its subsidiaries. Leica Microsystems is a provider of microscopy, camera, and software
solutions for the imaging and analysis of macro, micro, and nanostructure. Leica Microsystems has its
subsidiaries in the U.K., the U.S., Australia, China, and Singapore; six manufacturing facilities in five
countries, with sales and services facilities in 20 countries. Leica Microsystems operates in three divisions,
namely, Life Sciences, Industry, and Medical.
FIGURE 55 DANAHER CORPORATION: COMPANY SNAPSHOT
Source: Company Website, Annual Reports, and SEC Filings
Founded: 1969
Headquarters: Washington, U.S.
No. of Employees: ~81,000
Total Revenue: USD 20,563.1 Million
R&D Expenditure: USD 1,239.1 Million
Ownership: Public
COMPANY AT A GLANCE - 2015
GEOGRAPHIC REVENUE MIX BUSINESS REVENUE MIX
RECENT FINANCIALS
44.1%
9.7%
5.5%
40.7%
U.S.
China
Germany
Others
39.9%
17.7%
16.2%
13.3%
12.9%
Life Sciences and Diagnostics
Environmental
Industrial Technologies
Dental
Test and Measurment
18,283.1 19,154.0 20,563.1
6.0% 6.0% 6.0%
2.5%
3.0%
3.5%
4.0%
4.5%
5.0%
5.5%
6.0%
6.5%
7.0%
17,000
17,500
18,000
18,500
19,000
19,500
20,000
20,500
21,000
2013 2014 2015
R&DExpenditure(%)
TotalRevenue(USDMillion)
160
MICROSCOPY MARKET – GLOBAL FORECAST TO 2021
© MarketsandMarkets
11.3.2 PRODUCTS OFFERED
Category Product
Super-resolution Microscopes
 Leica SR GSD 3D
 Leica TCS SP8 STED 3X
Confocal Microscopes
 Leica TCS SP8
 Leica TCS SP8 X
 Leica TCS SP8 DLS
 Leica TCS SP8 STED 3X
 Leica TCS SP8 CARS
 Leica TCS SP8 SMD
 Leica TCS SPE
 Leica DCM8
 Leica HyD
 Leica HCS A
 Leica SD AF
Stereo Microscopes and Macroscopes
 Macroscopes
 Leica DMS300
 Leica DMS1000
 Leica DMS1000 B
 Leica Z6 APO
 Leica Z16 APO
 Stereo Microscope - Research Manual
 Leica M205 C
 Leica M165 C
 Leica M125
 Leica S8 APO
 Leica M80
 Stereo Microscope - Fluorescence
 Leica M205 FA
 Leica M165 FC
 Leica MZ10F
 Leica EL6000
 Stereo Microscope - Routine Manual Series
 Leica M50
 Leica M60
 Leica M80
 Leica A60 S
 Leica A60 F
 Leica EZ5
 Leica S6
 Leica S4 E
 Leica S6 E
 Leica S6 D
 Stereo Microscope - Research Automated
 Leica M205 A
 Stereo Microscope - Education
 Leica EZ4
161
MICROSCOPY MARKET – GLOBAL FORECAST TO 2021
© MarketsandMarkets
Category Product
 Leica EZ4 HD
 Leica S4 E
 Leica S6 E
 Leica ES2
 Stereo Microscope - Illumination Series
 Leica LED3000 RL
 Leica LED5000 RL
 Leica LED5000 CXI
 Leica LED3000 NVI and Leica LED5000 NVI
 Leica LED3000 BLI
 Leica LED5000 HDI and Leica LED3000 DI
 Leica LED3000 SLI, Leica LED5000 SLI
 Leica LED3000 MCI, Leica LED5000 MCI
 Stereo Microscopes - Ergonomics
Light Microscopes
 Leica DM4 B & DM6 B
 Leica DMi8
 Leica DM2500 & DM2500 LED
 Leica SFL4000
 Leica SFL100
 Leica DM4 P, DM2700 P & DM750 P
 Leica LMD6 & LMD7
 iPad Leica DMshare
 Leica DM6 FS
 Leica DMD108
 Leica DMi1
 Leica DM IL LED
 Leica DM1000 LED
 Leica DMi8
 Leica DM2700 M
 Leica DM1750 M
 Leica DM8000 M
 Leica DM12000 M
 Leica SD AF
 Leica Micromanipulator
 Leica Multiviews
 Leitz Optilux
 Leica DM750 M
 Leica DM ILM
 LAS X Widefield Systems
 Leica DM3000 & DM3000 LED
 Leica FS CB
 Leica Telatom
Digital Microscopes
 Leica DVM6
 Leica DMS300
 Leica DMS1000
162
MICROSCOPY MARKET – GLOBAL FORECAST TO 2021
© MarketsandMarkets
Category Product
 Leica DMS1000 B
 Leica DCM8
Microscope Cameras
 Microscope Camera Series for Education
 Microscope Camera Series for Life Science
 Microscope Camera Series for Industry
 Microscope Camera Series for Fluorescence
Microscope Software
 Software for Life Science Research
 Software for Education
 Software for Materials Sciences
11.3.3 RECENT DEVELOPMENTS
Month & Year Approach Description
October 2015 New Product Launch
Leica Microsystems introduced DMi8, an inverted research
microscope platform. The product offers observation through
an external monitor, remote operation and monitoring, high-
throughput, and complex screening. Leica DMi8 can be
configured without the optical components associated with the
optical path.
July 2015 New Product Launch
Leica Microsystems launched Leica DM4 B and Leica DM6 B, a
series of upright research microscopes. The series has wide
applications in life sciences research, laser microdissection,
neurosciences and evolutionary biology, materials science, and
materials analysis.
April 2015 New Product Launch
Leica Microsystems launched the Leica DVM6 digital
microscope. Leica DVM6 offers integrated illumination options
and PlanApo-corrected optics, which ensure high-quality
images. The product has wide applications in inspection,
analysis, and measurement in quality control, quality
assurance, failure analysis, research and development, and
forensics.
March 2015 New Product Launch
Leica Microsystems introduced Leica EM Cryo CLEM, a system
that facilitates correlative light and electron microscopy
(CLEM). CLEM enables sample study under a fluorescence light
microscope and electron microscope, and enables rapid
screening of large areas and fast determination of regions of
interest. The Leica EM Cryo CLEM system comprises a
fluorescence light microscope with cryo stage, cryo objective,
and a cyro transfer shuttle.
October 2014 New Product Launch
Leica Microsystems introduced the Leica M530 OH6
Neurosurgical Microscope. This microscope is armed with
technologies such as advanced small angle illumination (SAI),
FusionOptics, and apochromatic optics.
September 2014 Collaboration
Leica Microsystems collaborated with the Yale University (U.S.)
to establish a new Microscopy Center of Excellence at the Yale
University’s campus. This collaboration strengthened the
company’s market presence in the U.S.
163
MICROSCOPY MARKET – GLOBAL FORECAST TO 2021
© MarketsandMarkets
Month & Year Approach Description
September 2014 New Product Launch
Leica Microsystems introduced the Leica Application Suite X
(LAS X) imaging software in the life sciences segment for all
widefield, confocal, and super-resolution microscopes. This
software is equipped with a basic version known as LAS X Core.
This launch has strengthened the company’s microscope
software portfolio.
September 2014 New Product Launch
Leica Microsystems introduced Leica M844 and Leica M822
ophthalmology microscopes with TrueVision 3D visualization,
recording, and editing technologies. These microscopes help
surgeons and researchers in anterior and posterior surgical
techniques.
September 2014 New Product Launch
Leica Microsystems launched the Leica DMi8 inverted
microscope. The microscope is equipped with additional
features such as incident illumination port, infinity port, and
laser systems. This advanced product launch has helped the
company strengthen its portfolio of inverted research
microscopes.
July 2014 New Product Launch
Leica Microsystems launched the new Leica LMD software
V7.5.1. The software is equipped with features such as
extended toolbox for shape definition, improved AVC software,
remote navigation, and extension of time lapse. This advanced
product launch helped the company strengthen its portfolio of
software solutions.
Source: Press Releases
11.3.4 MNM VIEW
Leica Microsystems is a pioneer in the microscopy market. Geographically, the company operates in over
20 countries, including the U.S., the U.K., Australia, China, and Singapore. The company offers a strong
product portfolio, which includes microscopes, cameras, and software solutions for the imaging and
analysis of macro, micro, and nanostructures. The company maintains its strong position in the competitive
environment through innovative product launches such as super-resolution microscopes, confocal
microscopes, and light microscopes. The company mainly focuses on its super-resolution product line to
strengthen its position in the microscopy market. The company is also fortifying its position in the
microscopy market by collaborating with universities and entering into agreement with key companies such
as TrueVision 3D Surgical (U.S.).
164
MICROSCOPY MARKET – GLOBAL FORECAST TO 2021
© MarketsandMarkets
11.4 CARL ZEISS AG
11.4.1 BUSINESS OVERVIEW
Founded in 1846, with headquarters at Oberkochen, Germany, Carl Zeiss AG operates in the fields of
optics and optoelectronics. The company’s operating segments include research and quality technology,
medical technology, vision care /consumer optics, semiconductor manufacturing technology, and others.
The Microscopy division develops and distributes microscope systems for biomedical research and
materials inspection.
Geographically, the company operates in Europe, the Americas, and Asia, and its subsidiaries are located
across the globe. Carl Zeiss Meditec AG (Germany) is a subsidiary engaged in the development, production,
and marketing of diagnostic devices, intraocular lenses, and consumables for eye surgery. Major products
offered by the company include surgical microscopes, diagnostic systems, laser surgery equipment, and
intraocular lenses.
FIGURE 56 CARL ZEISS AG: COMPANY SNAPSHOT
Source: Company Website Annual Reports
Founded: 1846
Headquarters: Oberkochen, Germany
No. of Employees: 24,946
Total Revenue: USD 4,975.8 Million
R&D Expenditure: USD 514.0 Million
Ownership: Public
COMPANY AT A GLANCE - 2015
GEOGRAPHIC REVENUE MIX BUSINESS REVENUE MIX
RECENT FINANCIALS
34.4%
26.9%
21.1%
17.5% EMEA
Americas
APAC
Cooperation Partners
30.1%
26.8%
22.3%
19.8%
1.0%
Research and Quality
Technology
Medical Technology
Vision Care/Consumer Optics
Semiconductor
Manufacturing Technology
Others
4,621.7 4,728.7 4,975.8
9.9%
10.5%
10.3%
9.5%
9.6%
9.7%
9.8%
9.9%
10.0%
10.1%
10.2%
10.3%
10.4%
10.5%
4,400
4,500
4,600
4,700
4,800
4,900
5,000
5,100
2013 2014 2015
R&DExpenditure(%)
TotalRevenue(USDMillion)
165
MICROSCOPY MARKET – GLOBAL FORECAST TO 2021
© MarketsandMarkets
11.4.2 PRODUCTS OFFERED
Category Product
Light Microscopes
 Upright and Inverted Microscopes
 Axio Imager, Observer, Examiner
 Axio Scope.A1
 Axio Vert.A1
 Axio Lab.A1
 Primovert
 Primo Star
 Primo Star iLed
 Primotech
 Stereo & Zoom Microscopes
 Smartzoom 5
 Axio Zoom.V16
 SteREO Discovery.V20, V12, V8
 Stemi 2000, Stemi DV4
 Accessories
 Digital Microscope
 Axio Scan.Z1
 O-Select
 Smartproof 5
 Smartzoom 5
 Light Sheet Fluorescence Microscopes
 Lightsheet Z.1
 Apotome.2
 NMI System
Confocal Microscopes
 Laser Scanning Microscopes
 LSM 800
 LSM 880
 Smartproof 5
 Super-resolution Microscopes
 ELYRA
 Cell Observer SD
Electron Microscopes
 SEM
 GeminiSEM
 Sigma Family
 MultiSEM 505/506
 MERLIN
 EVO
 Mineralogic Systems
 Pre-owned Instruments
 ParticleSCAN VP
 Focused Ion Beam-SEM
 Crossbeam 340 and Crossbeam 540
166
MICROSCOPY MARKET – GLOBAL FORECAST TO 2021
© MarketsandMarkets
Category Product
 Multiple Ion Beam Microscopes
 ORION NanoFab
X-ray Microscopy
 ZIESS Xradia Versa Series
 ZIESS Xradia Ultra Series
 ZIESS Xradia Synchrotron X-ray Imaging
Software
 ZEN Series
 AxioVision Series
 SmartSEM
 Atlas & Atlas 3D
 3DSM
 PALM RoboSoftware
 Light Lab
 Labscope
 Matscope
Cameras  AxioCam Series
Accessories
 Filter sets & Fluorescent Dyes
 Microbeam Accessories
 Micromanipulation
 Light Sources
 Incubation
 Objectives
 Multi-discussion System
11.4.3 RECENT DEVELOPMENTS
Month & Year Approach Description
May 2016
Product
Enhancement
Carl Zeiss introduced ZEISS LSM 880 with airyscan detector for confocal
laser scanning microscopes. This upgradation enables improved signal-
to-noise ratio and a four-fold increase in imaging speed, sensitivity, and
1.5x resolution improvement. This product enhancement has helped the
company to enhance confocal super resolution imaging for live cell
imaging.
April 2016
New Product
Launch
Carl Zeiss launched ZEISS LSM 880, a confocal laser scanning
microscope for material science and failure analysis. The product
comprises confocal fluorescence and other contrasting techniques that
enables high-precision examination of nanomaterials, metals, polymers,
and semiconductors with maximum information content. The product
also offers precise capture of 3D topography and investigation of
nanometer-scaled structures. This launch will help the company
strengthen its portfolio of confocal laser scanning microscopes.
January 2016
New Product
Launch
Carl Zeiss launched Smartproof 5, a widefield confocal microscope for
industrial applications in quality assurance and quality control
departments, production environments, and research and development
labs. The microscope offers 3D reconstructions and roughness
measurements for a wide range of work piece surfaces.
167
MICROSCOPY MARKET – GLOBAL FORECAST TO 2021
© MarketsandMarkets
Month & Year Approach Description
January 2016
Product
Enhancement
Carl Zeiss introduced EISS Xradia Versa with FPX, an extension for the
ZEISS Xradia Versa 500 series of 3D X-ray microscopes. ZEISS FPX
enhances image quality and improves workflow, which is useful in
industrial development and academic research to examine large
samples.
June 2015 Partnership
Carl Zeiss entered into a public-private partnership with University of
California, Berkeley (U.S.) as part of the Brain Microscopy Innovation
Center (BrainMIC), Berkeley BRAIN Initiative. Under this partnership, Carl
Zeiss will offer the latest updates of the equipment and, in turn, UC
Berkeley researchers will provide feedback on any new or special
neurotechnology needs to help Carl Zeiss produce future products best
suited for the newest advances in neuroscience research endeavors.
April 2015
New Product
Launch
ZEISS introduced ZEISS GeminiSEM and ZEISS Sigma, two product
lines of field emission scanning electron microscopes (FE-SEMs) with
enhanced Gemini technology. The ZEISS GeminiSEM family provides
high-contrast and low-voltage images from any sample; while the ZEISS
Sigma microscopes offer high-quality imaging and advanced analytical
microscopy. Both products find applications in research, industrial labs,
and imaging facilities.
January 2015
New Product
Launch
ZEISS introduced LSM 800, a new compact confocal laser scanning
microscope for high-end confocal imaging. ZEISS LSM 800 provides high-
image quality and offers enhanced productivity and throughput as well as
greater flexibility in live cell imaging.
December 2014
New Product
Launch
ZEISS launched ZEISS Stemi 305 and ZEISS Stemi 508, two new
compact Greenough stereo microscopes for education, lab routine, and
industrial inspection. The products offers images in true color, 3D, with
high contrast, and free of distortion or color fringes.
November 2014
New Product
Launch
ZEISS introduced MultiSEM 505, a new scanning electron microscope
(SEM) featured with 61 beams working in parallel. ZEISS MultiSEM 505 is
designed for frequent operation and is fitted with the intuitive ZEN
Software.
October 2014 Collaboration
Carl Zeiss collaborated with the University of California, Berkeley, to
support the BRAIN Initiative organized by the Berkeley Brain Microscopy
Innovation Center (BrainMIC) and supported by the National Institutes of
Health (NIH). This initiative aimed to develop the company’s microscopy
business by using emerging neurotechnologies.
Source: Press Releases
168
MICROSCOPY MARKET – GLOBAL FORECAST TO 2021
© MarketsandMarkets
11.4.4 MNM VIEW
Carl Zeiss maintained its leadership in the microscopy market through its strong distribution network and
business operations in Europe, the Americas, Asia, and other geographies. The company focuses on
strengthening its position in the market by adopting strategies such as new product launches,
collaborations, and alliances. In this regard, in October 2014, the company collaborated with the University
of California, Berkeley, to support the BRAIN Initiative organized by the Berkeley Brain Microscopy
Innovation Center (BrainMIC) and supported by the National Institutes of Health (NIH). Company focuses on
introducing innovative products such as super-resolution microscopy in the market. The company also
focuses on aftersales services to ensure customer satisfaction and strengthen its position in the market.
In 2015, the company witnessed an increase of 5.2% in its revenue, as compared to that of 2014. The
revenue increase was primarily due to a healthy trend in the company’s business and positive currency
effects.
169
MICROSCOPY MARKET – GLOBAL FORECAST TO 2021
© MarketsandMarkets
11.5 NIKON CORPORATION
11.5.1 BUSINESS OVERVIEW
Founded in 1917, with headquarters at Tokyo, Japan, Nikon Corporation is a leading manufacturer and
supplier of optical instruments. The company operates through four business segments—Imaging Products,
Precision Equipment, Instruments, and Others. The Others segment comprises sport optics, space-related
equipment, glass, lasers, encoders, and ophthalmic lens businesses. The company offers its microscopy
products through the Instruments business segment.
Geographically, the company operates in the U.S., Japan, Europe, and China. It has 59 subsidiaries, of
which 19 are domestic and 40 are overseas.
FIGURE 57 NIKON CORPORATION: COMPANY SNAPSHOT
Source: Company Website and Annual Reports
Founded: 1917
Headquarters: Tokyo, Japan
No. of Employees: 25,415
Revenue: USD 7,138.1 Million
R&D Expenditure: USD 555.3 Million
Ownership: Public
COMPANY AT A GLANCE - 2015
GEOGRAPHIC REVENUE MIX BUSINESS REVENUE MIX
RECENT FINANCIALS
24.7%
23.4%
14.3%
14.1%
23.5%
Europe
U.S.
Japan
China
Others
68.3%
19.9%
8.5%
3.3%
Imaging Products Business
Precision Equipment
Business
Instruments Business
Others
10,744.2 9,527.4 7,138.1
7.6%
7.6%
7.8%
7.2%
7.3%
7.4%
7.5%
7.6%
7.7%
7.8%
7.9%
0
2,000
4,000
6,000
8,000
10,000
12,000
2013 2014 2015
R&DExpenditure(%)
TotalRevenue(USDMillion)
170
MICROSCOPY MARKET – GLOBAL FORECAST TO 2021
© MarketsandMarkets
11.5.2 PRODUCTS OFFERED
Category Product
Super-resolution Microscopes
 N-SIM
 N-SIM E
 N-STORM
Confocal Microscopes
 Singlephoton Confocal Microscopes
 Multiphoton Confocal Microscopes
 Macro Confocal Microscope System
Inverted Microscopes
 ECLIPSE Ti
 ECLIPSE Ts2R
 ECLIPSE Ts2
 ECLIPSE TS100/100F
 Ti-LAPP Modular Illumination System
 White-light TIRF System
 NT88-V3 Micromanipulator Systems for IVF
Upright Microscopes
 ECLIPSE Ni-E/Ni-U
 Fixed-stage Microscope ECLIPSE FN1
 ECLIPSE Ci-E/Ci-L/Ci-S
 ECLIPSE E200
 ECLIPSE E100
 ECLIPSE LV100ND POL/DS
Polarizing Microscopes
 Eclipse LV100N POL
 Eclipse Ci-POL
 Eclipse E200 POL
Multi-purpose Zoom Microscopes
 MULTIZOOM AZ100
 MULTIZOOM AZ100 M
Integrated Cell Culture Observation System  BioStation CT
Digital Microscope  ShuttlePix
Stereoscopic Microscopes
 Research Stereo Microscope SMZ25/SMZ18
 Stereo Microscope SMZ1270/1270i
 Stereo Microscope SMZ800N
 Stereo Microscope SMZ745/745T
 Stereo Microscopes Accessories
Industrial Microscopes
 Upright Microscope
 Inverted Microscope
 Others
171
MICROSCOPY MARKET – GLOBAL FORECAST TO 2021
© MarketsandMarkets
11.5.3 RECENT DEVELOPMENTS
Month & Year Approach Description
November 2015 New Product Launch
Nikon Corporation launched ECLIPSE Ts2R, a compact inverted
research microscope with ease of use and wide variety of
observation methods for medical and biological research fields.
This launch helped the company enhance its brand image and
strengthen its market presence.
November 2015 Product Enhancement
Nikon Corporation introduced an inverted routine microscope—
ECLIPSE Ts2. The product is an advanced version of ECLIPSE
TS100, with new features such as emboss contrast, LED
illuminator, and with improved workflow. With this launch, the
company strengthened its microscopy product portfolio.
October 2015 New Software Launch
Nikon Corporation launched the high-resolution confocal
imaging software, NIS-Elements C-ER, which provides high-
resolution confocal images. This software launch helped the
company strengthen its software portfolio.
March 2015 Product Enhancement
Nikon Corporation unveiled the super-resolution microscope N-
STORM 4.0. The N-STORM 4.0 is an enhanced version of the
super-resolution microscope N-STORM released in 2010. The
new enhanced product offers features such as dynamic super-
resolution imaging at the nanoscale level and improvement of
image quality. This product enhancement helped the company
cater to unmet market needs.
May 2014 New Product Launch
Nikon Corporation launched the DS-Ri2 Microscope Camera
and DS-Qi2 Monochrome Microscope Camera. These products
are equipped with Nikon’s FX-format CMOS sensor.
April 2014 New Product Launch
Nikon Corporation expanded its portfolio of stereo microscopes
by introducing the SMZ1270, SMZ1270i, and SMZ800N. Of
these, the SMZ1270 and SMZ1270i are equipped with new WF
series objectives and offer highest-in-class zoom ratio. This
launch helped the company strengthen its market share.
November 2013 New Product Launch
Nikon Corporation launched the new Ti-LAPP laser application
system. This system features various combinations of multiple
epi-fluorescence modules, with high flexibility, high
expandability, an auto-alignment function to simplify TIRF
observations, and a DMD module that offers a variety of photo
stimulation patterns.
May 2013 New Product Launch
Nikon Corporation launched two research stereo microscopes,
the SMZ25 motorized epi-fluorescence set and the SMZ18
episcopic plain stand set. These products are equipped with
large zoom range and enhanced epi-fluorescence imaging.
Source: Press Releases
172
MICROSCOPY MARKET – GLOBAL FORECAST TO 2021
© MarketsandMarkets
11.5.4 MNM VIEW
Nikon Corporation is among the world’s leading providers of optical instruments. The company has created
a strong business platform that enables it to harness opportunities for continued success despite the
economic crisis. The company offers a comprehensive range of microscopes to healthcare professionals
globally.
Significant investment made by the company have enabled it to expand its international presence by
improving IT systems. The company pursues the strategy of new product launches in order to grow its
share in the microscopy market. In 2015, the company witnessed a 25.1% decline in its revenue as
compare to a decline of 11.3% in 2014. These declines were due to a decrease in the number of units sold
in the precision equipment business and delayed recoveries in the European and Chinese markets in the
company’s imaging products business. However, the company witnessed positive growth in its research
and development expenditure by 23.3% in 2015 as compare to that of the previous year. This shows the
company’s continuous involvement in research and development activities to strengthen the Nikon brand,
and its efforts to tap unmet market demand.
173
MICROSCOPY MARKET – GLOBAL FORECAST TO 2021
© MarketsandMarkets
11.6 FEI CO.
11.6.1 BUSINESS OVERVIEW
Founded in 1971, with headquarters in Oregon, U.S., FEI Co. mainly focuses on designing, manufacturing,
and supplying products based on focused charged-particle beam technology. The company offers ion beam
workstations, transmission electron microscopes, and SEM. The company has segmented its business into
two subgroups—industry group and science group. The Life Sciences segment caters to the microscopy
business.
Geographically, the company operates in North America, Europe, Asia-Pacific, and the RoW. In 2015, its
employee headcount was 3,060.
FIGURE 58 FEI CO.: COMPANY SNAPSHOT
Source: Company Website, Annual Reports, and SEC Filings
Founded: 1971
Headquarters: Oregon, U.S.
No. of Employees: 3,060
Revenue: USD 930.1 Million
R&D Expenditure: USD 95.5 Million
Ownership: Public
COMPANY AT A GLANCE - 2015
GEOGRAPHIC REVENUE MIX BUSINESS REVENUE MIX
RECENT FINANCIALS
32.0%
26.5%
41.4%
U.S. and Canada
Europe
APAC and RoW
48.0%
52.0%
Industry Group
Science Gruop
927.4 956.2 930.1
11.0%
10.7%
10.3%
9.8%
10.0%
10.2%
10.4%
10.6%
10.8%
11.0%
11.2%
910
915
920
925
930
935
940
945
950
955
960
2013 2014 2015
R&DExpenditure(%)
TotalRevenue(USDMillion)
174
MICROSCOPY MARKET – GLOBAL FORECAST TO 2021
© MarketsandMarkets
11.6.2 PRODUCTS OFFERED
Category Product
Scanning Electron Microscope (SEM)
 Quanta SEM
 Teneo Family
 Verios
 Nova NanoSEM
 Inspect Family
 MLA
 QEMSCAN
 Aspex Product Group
Transmission Electron Microscope (TEM)
 Titan
 Talos
 Tecnai
 Metrios
DualBeam (FIB/SEM)
 Helios NanoLab
 Scios
 Versa 3D
 ExSolve
Focused Ion Beam (FIB) System
 Vion Plasma Focused Ion Beam
 V400ACE Focused Ion Beam
 OptiFIB
Software
 Amira
 Argos
 EPU
 Inspect 3D
 Tomography
 Auto Slice & View
 MAPS
 Avizo
Accessories
 For SEM
 For TEM
 For Dual Beam
175
MICROSCOPY MARKET – GLOBAL FORECAST TO 2021
© MarketsandMarkets
11.6.3 RECENT DEVELOPMENTS
Month & Year Approach Description
May 2016 New Product Launch
FEI introduced Apreo, a scanning electron microscope (SEM).
The product utilizes the proprietary compound final lens design
that allows improvement in resolution and backscatter
detection at the lowest beam current.
March 2016 Partnership
FEI Co. and NovAliX (France), a contract research organization,
entered into a partnership to provide cryo-electron microscopy-
based structural biology services for the pharmaceutical and
biotech industry. The partnership combines application,
training, and support with on-site personnel from FEI.
September 2014 Expansion
FEI Co. established a new technology center in the Czech
Republic, for which the company invested CZK 800 million
(approximately USD 38 million). This new setup is intended to
employ about 600 people and produce approximately 60% of
FEI’s electron microscopes. This will help the company expand
its market in the European region.
September 2014 New Product Launch
FEI introduced the Helios NanoLab G3 DualBeam, a
combination of electron and ion optics microscopy, which
comes in two different workflow-specific configurations for
material science research. This product expanded FEI’s
transmission electron microscope (TEM) portfolio.
September 2014 New Product Launch
FEI Co. unveiled the new Teneo VolumeScope (VS) scanning
electron microscope (SEM), a fully integrated 3D volume
imaging solution. This product is equipped with VolumeScope,
an in-chamber microtome and proprietary analytical software.
July 2014 New Product Launch
FEI Co. launched two new products, namely, the Helios plasma
focused ion beam (PFIB) DualBeam and Teneo scanning
electron microscope (SEM). These products provide faster
analyses in metal research.
July 2014 New Product Launch
FEI Co. launched a new phase plate solution and the Titan
Halo™ transmission electron microscope (TEM). These two
products are based on cryo-electron microscopy applications,
and enable the analysis of 3D structure of molecules and
molecular complexes.
June 2014 Collaboration
FEI Co. collaborated with the metal labs at The University of
Manchester's Electron Microscopy Centre in the School of
Materials. This collaboration is aimed for steel and non-ferrous
alloy research.
February 2014 Acquisition
FEI Co. acquired Lithicon AS (Australia). This acquisition was
conducted to access Lithicon’s expertise in digital rock
technology services and core imaging and analysis.
October 2013 New Product Launch
FEI Co. introduced the Tecnai Femto ultrafast electron
microscope (UEM). This helped the company to become one of
the innovative companies in the microscopy market.
Source: Press Releases
176
MICROSCOPY MARKET – GLOBAL FORECAST TO 2021
© MarketsandMarkets
11.6.4 MNM VIEW
FEI Co. is one of the key companies in the electron microscopy market. The company has a broad product
portfolio of SEM, transmission electron microscopes, and DualBeam (FIB/SEM) and Focused Ion Beam
(FIB) systems. The company aims to increase its visibility in the microscopy market by launching several
new products. For instance, in May 2016, the company launched Apreo, a scanning electron microscope
(SEM). The product utilizes the proprietary compound final lens design that offers improvement in
resolution and backscatter detection at the lowest beam current. This launch will strengthen the
company’s microscopy product catalogue. The company also focuses on expansions and acquisitions to
mark its presence in emerging markets. Emerging markets present significant growth opportunities for the
company, as developed markets are gradually getting saturated. In this regard, in September 2014, the
company established a new technology center in the Czech Republic.
In 2015, the company recorded a decline of 2.7% in its revenue. This decline was due to a drop in sales of
the company’s largest business segment—Science Group.
177
MICROSCOPY MARKET – GLOBAL FORECAST TO 2021
© MarketsandMarkets
11.7 OLYMPUS CORPORATION
11.7.1 BUSINESS OVERVIEW
Incorporated in 1919, with headquarters in Tokyo, Japan, Olympus Corporation is a leading player in the
global microscopy market. The company primarily operates in four business segments—Medical, Scientific
Solution, Imaging, and Others (including information technology and industrial systems). The Scientific
Solution segment deals with biological/industrial microscopes, industrial endoscopes, printers, and non-
destructive test equipment.
The company has widespread presence across the globe, spanning the Americas, Africa, Western/Eastern
Europe, the Middle East, Asia, and Oceania.
FIGURE 59 OLYMPUS CORPORATION: COMPANY SNAPSHOT
*Note: The total of the business revenue mix is more than 100% due to eliminations.
Source: Company Website and Annual Reports
Founded: 1919
Headquarters: Tokyo, Japan
No. of Employees: 31,540
Revenue: USD 7,233.0 Million
R&D Expenditure: USD 700.9 Million
Ownership: Public
COMPANY AT A GLANCE - 2015
GEOGRAPHIC REVENUE MIX BUSINESS REVENUE MIX
RECENT FINANCIALS
21.1%
32.7%
25.5%
18.2%
2.5%
Japan
North America
Europe
Asia
Other Foreign Countries
70.5%
16.5%
10.6%
2.4%
Medical Business
Scientific Solution Bussiness
Imaging Business
Other/Corporate
7,036.1 6,746.9 7,233.0
8.5%
9.4%
9.7%
7.8%
8.0%
8.2%
8.4%
8.6%
8.8%
9.0%
9.2%
9.4%
9.6%
9.8%
6,500
6,600
6,700
6,800
6,900
7,000
7,100
7,200
7,300
2013 2014 2015
R&DExpenditure(%)
TotalRevenue(USDMillion)
178
MICROSCOPY MARKET – GLOBAL FORECAST TO 2021
© MarketsandMarkets
11.7.2 PRODUCTS OFFERED
Category Product
Inverted Microscopes
 IX83
 IX73
 IX53
 FSX100
 CKX53
 ICSI/IMSI Platform
Stereo Microscopes
 SZX16
 SZX10
 SZX7
 SZ61/SZ51
Disk Confocal Microscope  DSU
Upright Microscopes
 BX63
 BX53
 BX43
 BX46
 CX41
 CX31
 CX23
 BX61WI/BX51WI
 BX53-P
 CX31-P
Research Macro Zoom
Microscope
 MVX10
Virtual Slide Microscope  VS120
11.7.3 RECENT DEVELOPMENTS
Month & Year Approach Description
April 2016 Product Enhancement
Olympus Corporation launched FLUOVIEW FV3000 and
FV3000RS confocal laser scanning microscope series, an
enhancement of the FV1200 series. The updated versions
include features such as high speed, high-resolution,
three-dimensional images, and high sensitivity that
capture light even from dim samples. The series also
offers high-resolution images for fast, accurate imaging of
biological samples. This launch has strengthened the
company’s portfolio of confocal laser scanning
microscopes.
January 2016 Product Enhancement
Olympus Corporation unveiled the BX53M/BXFM system
microscope. This product is an enhanced version of BXiS
with additional and improved features such as aperture
adjustment and switching between different observation
methods.
179
MICROSCOPY MARKET – GLOBAL FORECAST TO 2021
© MarketsandMarkets
Month & Year Approach Description
January 2016 New Software Launch
Olympus Corporation launched the OLYMPUS Stream V2.1
software. The new software features the instant multiple
image alignment (MIA) function for building composite
panorama images.
January 2016 New Product Launch
Olympus Corporation launched new units for SZX series of
stereo microscopes; SZX2-LTTR ergonomic long tilting
trinocular and SZX2-EEPA extendable eye point adjuster.
November 2015 Product Enhancement
Olympus Corporation unveiled the CKX53 culture
microscope, an enhanced version of CKX41 and CKX31.
The product features a new phase contrast system and
LED light source, which delivers clearer images and faster
startup.
April 2015 Product Enhancement
Olympus Corporation introduced the biological microscope
CX23, an enhanced version of CX22LED. The microscope
is easy to use and thus facilitates the use of these
microscopes in educational training at various universities
and teaching laboratories.
March 2015 New Product Launch
Olympus Corporation launched the DSX Series of digital
microscopes, comprising DSX510, DSX510i, and DSX110.
October 2014 New Product Launch
Olympus Corporation launched the STM7 Measuring
Microscope. This product can be used for the efficient
shape measurement of machine parts, semiconductors,
electronic components, and other parts in industrial
processes. This product launch helped the company offer
an innovative technology to its customer base. However,
this product is not available in the European market.
October 2014 New Product Launch
Olympus Corporation launched the DP27 and DP22
standalone microscope digital cameras. These products
can be used with both biological and industrial
microscopes. This product launch helped the company
further expand its product portfolio.
Source: Press Releases
180
MICROSCOPY MARKET – GLOBAL FORECAST TO 2021
© MarketsandMarkets
11.8 ASYLUM RESEARCH (OXFORD INSTRUMENTS)
11.8.1 BUSINESS OVERVIEW
Asylum Research, with headquarters in California, U.S., was established in 1999. Asylum Research is a
subsidiary of Oxford Instruments. The company provides instrumentation for nanoscience and
nanotechnology applications, and offers scanning probe and AFM for materials and bioscience
applications. The company operates in 17 countries worldwide, including the U.S., Canada, and Israel; and
has subsidiaries in the U.K., Germany, and Taiwan.
In December 2012, Asylum Research was acquired by Oxford Instruments (U.K.), a provider of high-
technology tools and systems. As of 2015, the company had a headcount of 2,420 employees.
FIGURE 60 OXFORD INSTRUMENTS: COMPANY SNAPSHOT
*Note: All the financials mentioned in the company snapshot is for parent company Oxford Instruments
Source: Company Website, Annual Reports, and SEC Filings
Founded: 1999
Headquarters: California, U.S.
No. of Employees: 2,420
Revenue: USD 510.6 Million
R&D Expenditure: USD 30.8 Million
Ownership: Public
COMPANY AT A GLANCE - 2015
GEOGRAPHIC REVENUE MIX BUSINESS REVENUE MIX
RECENT FINANCIALS
32.8%
14.4%
9.6%
8.2%
6.7%
13.3%
11.5%
3.5%
U.S.
China
U.K.
Japan
Germany
54.6%27.7%
17.7% Nanotechnology Tools
Industrial Products
Services
464.7 477.0 510.6
6.9%
7.0%
8.0%
6.2%
6.4%
6.6%
6.8%
7.0%
7.2%
7.4%
7.6%
7.8%
8.0%
8.2%
440
450
460
470
480
490
500
510
520
2013 2014 2015
R&DExpenditure(%)
TotalRevenue(USDMillion)
181
MICROSCOPY MARKET – GLOBAL FORECAST TO 2021
© MarketsandMarkets
11.8.2 PRODUCTS OFFERED
Category Product
Atomic Force Microscopy (AFM)
 Cypher ES Environmental AFM
 Cypher S
 MFP-3D Infinity
 MFP-3D Origin
 MFP-3D BIO
 MFP-3D Classic
Accessories
 Cypher Options and Accessories Summary
 MFP-3D Options and Accessories Summary
11.8.3 RECENT DEVELOPMENTS
Month & Year Approach Description
September 2015 New Product Launch
Asylum Research launched Cypher ES Polymer Edition, an atomic
force microscope optimized for polymer research. The product
offers highest resolution, fast scanning, heating, and the most
comprehensive suite of nanomechanical characterization tools.
Cypher ES polymer is useful for polymer and material science
applications.
August 2014 New Product Launch
Asylum Research launched AM-FM Viscoelastic Mapping Mode, a
new nanomechanical imaging technique. This technique is a
combination of quantitative abilities of normal tapping mode (AM)
with a high-sensitivity frequency modulation mode (FM). This
launch strengthened the company’s NanomechPro toolkit product
line.
July 2014 Expansion
Asylum Research opened its first Nanotechnology Lab for Atomic
Force Microscopy (AFM) in India. This lab is equipped with MFP-3D
Classic and the MFP-3D Origin technology, which adds to the range
of industrial analysis tools available for demonstration. This
expansion helped the company strengthen its presence in the Asia-
Pacific region.
April 2014 New Product Launch
Asylum Research introduced its new MFP-3D Infinity atomic force
microscope (AFM) with new nanomechanical measurement
capabilities. This launch benefited the company in the expansion of
the MFP-3D AFM portfolio.
January 2014 New Product Launch
Asylum Research unveiled the new atomic force microscope
technique, namely, Scanning Microwave Impedance Microscopy
(sMIM). This new AFM technique enables nanoscale mapping of
permittivity and conductivity with unprecedented sensitivity and
resolution on any material, including conductors, semiconductors,
and insulators. This launch strengthened the company’s MFP-3D
and Cypher AFMs portfolio and provided it a competitive edge in
the market.
November 2013 New Product Launch
Asylum Research introduced blueDrive Photothermal Excitation, a
technology for the Asylum’s Cypher AFM (AFMs) family. This
technology is simple, stable, and enables accurate tapping mode
182
MICROSCOPY MARKET – GLOBAL FORECAST TO 2021
© MarketsandMarkets
Month & Year Approach Description
imaging. This launch extended the company’s product portfolio in
the microscopy market.
September 2013 New Product Launch
Asylum Research introduced the Contact Resonance Viscoelastic
Mapping Mode technique. This new technique enables high-
resolution, quantitative imaging, particularly suited for
characterizing moderate-to-high modulus materials. This launch
helped the company to augment its current product offerings in
NanomechPro Toolkit.
August 2013 New Product Launch
Asylum Research unveiled the new GetReal Automated Probe
Calibration feature for atomic force microscopes (AFM). This
technology provides consistent and accurate results, and has
strengthened the company’s position in the microscopy market.
May 2013 New Product Launch
Asylum Research launched the new MFP-3D Origin atomic force
microscope (AFM). The technology has superior performance and is
affordable as compared to the existing technologies in the AFM
portfolio. This new launch will help the company extend its range of
AFMs and strengthen its position in this market.
Source: Press Releases
183
MICROSCOPY MARKET – GLOBAL FORECAST TO 2021
© MarketsandMarkets
11.9 DANISH MICRO ENGINEERING
11.9.1 BUSINESS OVERVIEW
Established in 1979, with headquarters in Copenhagen, Denmark, Danish Micro Engineering (DME) is a
major developer and manufacturer of AFM. The company has expertise in scanning probe microbes
technology. The company’s product series, Rasterscope and DualScope, are its main business segments.
As of 2015, the company had a headcount of seven employees and generated a revenue of USD 1.5
million.
Danish Micro Engineering is a privately held company and no financial information is available in the public
domain. Hence, financial details have not been provided in this section.
11.9.2 PRODUCTS OFFERED
Category Product
Atomic Force Microscopy (AFM)
Systems
 DS 95 Scanner
 DS 95 AFM System
 Compact Granite
 ProberStation 150
 Navigator 220
 Igloo
 AFM Objective for Optical Microscope
 BRR-SEM-AFM Integration
Ultra-high Vacuum (UHV) and
Special Constructions
 SPM for Ultra High Vacuum
 UHV Scanning Tunnelling Microscope (STM)
 STM for Electrochemical measurements
 DX STM0 Head to Head STM
 UHV Tip Enhanced Raman Spectroscopy System
 Scanning Nearfield Optical Microscopy (SNOMs)
 Controlled Atmosphere High Temperature (CAHT) AFM
Software  DME ScanTool
11.9.3 RECENT DEVELOPMENTS
No significant developments have been reported by the company in the microscopy segment between
2012 and 2016.
184
MICROSCOPY MARKET – GLOBAL FORECAST TO 2021
© MarketsandMarkets
11.10 JEOL LTD.
11.10.1 BUSINESS OVERVIEW
Founded in 1949, with headquarters in Tokyo, Japan, JEOL Ltd. manufactures and markets scientific
instruments (electron optical instruments and analytical instruments) and measuring instruments;
semiconductor, industrial, and medical equipment; and processing & maintenance services for related
products and accessories. The company has three business segments—Scientific and Measurement
Instruments, Industrial Equipment, and Medical Equipment. The Scientific and Measurement Instruments
segment caters to the company’s microscopy business.
JEOL offers products in more than 30 countries across North America, Europe, Australia, and Asia; and
operates through six subsidiaries in Germany, the Netherlands, and Sweden.
FIGURE 61 JEOL LTD.: COMPANY SNAPSHOT
Source: Company Website and Annual Reports
Founded: 1949
Headquarters: Tokyo, Japan
No. of Employees: 2,952
Revenue: USD 902.2 Million
R&D Expenditure: USD 52.2 Million
Ownership: Public
COMPANY AT A GLANCE - 2015
BUSINESS REVENUE MIX
RECENT FINANCIALS
72.6%
19.6%
7.8%
Scientific and Measurement
Instruments
Medical Equipment
Industrial Equipment
753.2 939.6 902.2
5.4%
4.5%
5.8%
0.0%
1.0%
2.0%
3.0%
4.0%
5.0%
6.0%
7.0%
0
100
200
300
400
500
600
700
800
900
1,000
2013 2014 2015
R&DExpenditure(%)
TotalRevenue(USDMillion)
185
MICROSCOPY MARKET – GLOBAL FORECAST TO 2021
© MarketsandMarkets
11.10.2 PRODUCTS OFFERED
Category Product
Transmission Electron Microscopes (TEMs)
 JEM-1000 Ultra-high Voltage Electron Microscope
 JEM-3200FS Field Emission Energy Filter Electron Microscope
 JEM-ARM200F Atomic Resolution Analytical Electron Microscope
 JEM-ARM300F GRAND ARM Atomic Resolution Electron Microscope
 JEM-2200FS Field Emission Electron Microscope
 JEM-F200 Multi-purpose Electron Microscope
 JEM-2100F Field Emission Electron Microscope
 JEM-2100 Plus Electron Microscope
 JEM-2800 High Throughput Electron Microscope
 JEM-1400Plus Electron Microscope
 JED-2300T Energy Dispersive X-ray Spectrometer
 EM-05500TGP TEM Tomograph System
Scanning Electron Microscopes (SEMs)
 JSM-7800F Schottky Field Emission Scanning Electron Microscope
 JSM-7200F Schottky Field Emission Scanning Electron Microscope
 JSM-7610F Schottky Field Emission Scanning Electron Microscope
 JSM-7500F Field Emission Scanning Electron Microscope
 JSM-7100F Schottky Field Emission Scanning Electron Microscope
 JSM-IT300 Scanning Electron Microscope
 JSM-6510 Series Scanning Electron Microscope
 JASM-6200 ClairScope Atmospheric Pressure Scanning Electron
Microscope
 JSM-6010PLUS/LA InTouchScope Multiple touch panel scanning
electron microscope
 JCM-6000Plus Versatile Benchtop SEM
 JED-2300/2300F Energy dispersive X-ray Analyzer
 miXcroscopy Linked Optical & Scanning Electron Microscopy System
 Serial Block-face SEM JSM-7100F・7800F/Gatan 3View2XP
MultiBeam Systems (SEM-FIB)
 JIB-4601F Multi Beam System
 JIB-4501 Multi Beam SEM-FIB System
 JIB-4000 Focused Ion Beam Milling & Imaging System
186
MICROSCOPY MARKET – GLOBAL FORECAST TO 2021
© MarketsandMarkets
11.10.3 RECENT DEVELOPMENTS
Month & Year Approach Description
January 2016 New Product Launch
JEOL Ltd. launched JEM-F200, a multi-purpose transmission
electron microscope. JEM-F200 offers features such as quad-
lens condenser system, advanced scan system, Pico stage
drive, and dual SDD.
November 2016 New Product Launch
JEOL Ltd. unveiled its scanning electron microscope, JSM-
IT100 InTouchScope. This product features a compact design,
space-efficient configuration, easy-to-use software interface,
and EDS functions such as area analysis and line scans.
August 2015 New Product Launch
JEOL Ltd. introduced JSM-7200F, a field emission scanning
electron microscope. JSM-7200F utilizes the JEOL proprietary
in-lens Schottky Plus technology that allows high resolution at
low accelerating voltages.
August 2015 New Product Launch
JEOL Ltd. introduced a benchtop scanning electron microscope,
JCM-6000Plus NeoScope, equipped with high-sensitivity
semiconductor detector, high-vacuum functionality, and
secondary electron detector. This microscope offers a sleek
exterior design, high-image quality, user-friendly interface with
touch panel, and automated function for easy operation.
August 2014 Collaboration
JEOL collaborated with Oxford University (U.K.), Johnson
Matthey (U.K.), and Diamond Light Source (U.K.), to establish a
materials characterization facility at the Harwell Science and
Innovation Campus.
July 2014 New Product Launch
JEOL launched the new JEM-ARM300F atomic resolution
electron microscope. This product is equipped with a 300kV
atomic resolution and aberration corrector. This helped the
company to strengthen its market presence.
October 2013 Partnership
JEOL partnered with Gatan, Inc. (U.S.) to Serial Block Face
imaging for SEM (SBFSEM) by integrating Gatan's 3View2.XP
system on its JSM-7100F FE-SEM.
September 2013 New Product Launch
JEOL introduced the Scanning Electron Microscope JSM-IT300
series. This product is designed with a user interface and can
be applied to research, material testing/assessment/defect
analysis, quality assurance, and analytical tests.
April 2013 New Product Launch
JEOL launched MiXcroscopy, a new correlative microscope
system that is a combination of optical microscopy and
scanning electron microscopy. The company designed
MiXcroscopy in collaboration with Nikon Corporation (Japan).
This has fortified the company’s microscopy portfolio and
strengthened its position in the market.
Source: Press Releases
187
MICROSCOPY MARKET – GLOBAL FORECAST TO 2021
© MarketsandMarkets
11.11 HITACHI HIGH-TECHNOLOGIES CORPORATION
11.11.1 BUSINESS OVERVIEW
Hitachi High-Technologies Corporation, a subsidiary of Hitachi, Ltd., was established in 2001. It has
headquarters in Tokyo, Japan. The company offers products through five distinct segments̶—Science and
Medical Systems, Electronic Device Systems, Fine Technology Systems, Industrial and IT Systems, and
Advanced Industrial Products. Hitachi-High Technologies Corporation was formed through the merger of
three companies—The Instruments Group of Hitachi Ltd, the Semiconductor Manufacturing Equipment
Group, and the Nissei Sangyo Co. Ltd.; Hitachi Electronics Engineering Co., Ltd. merged with this
organization in 2004.
The Electronic Devices Systems segment carries out the microscopy business. The company operates in
Japan, North America, Europe, Asia, the Middle East, and Oceania.
FIGURE 62 HITACHI HIGH-TECHNOLOGIES CORPORATION: COMPANY SNAPSHOT
*Note: The total of the business revenue mix is more than 100% due to eliminations.
Source: Company Website and Annual Reports
Founded: 2001
Headquarters: Tokyo, Japan
No. of Employees: 10,504
Revenue: USD 5,591.7 Million
R&D Expenditure: USD 179.2 Million
Ownership: Public
COMPANY AT A GLANCE - 2015
GEOGRAPHIC REVENUE MIX BUSINESS REVENUE MIX
RECENT FINANCIALS
40.7%
34.8%
14.0%
9.4%
1.1%
Japan
Asia
Europe
North America
Others
40.4%
28.0%
16.3%
12.8%
2.3% 0.2%
Advanced Industrial Products
Science and Medical Systems
Electronic Device Systems
Industrial and IT Systems
Fine Technology Systems
Others
6,008.0 5,183.8 5,591.7
3.2% 3.2% 3.2%
2.5%
3.0%
3.5%
4.0%
4.5%
5.0%
4,600
4,800
5,000
5,200
5,400
5,600
5,800
6,000
6,200
2014 2015 2016
R&DExpenditure(%)
TotalRevenue(USDMillion)
188
MICROSCOPY MARKET – GLOBAL FORECAST TO 2021
© MarketsandMarkets
11.11.2 PRODUCTS OFFERED
Category Product
Transmission Electron Microscopes
 Field Emission Transmission Electron Microscope HF-3300 System
 Transmission Electron Microscope H-9500
 Hitachi Spherical Aberration Corrected STEM/SEM HD-2700
 Transmission Electron Microscope HT7700
Focused Ion Beam Systems
 Focused Ion Beam System FB2000
 Focused Ion & Electron Beam System nanoDUE’T NB5000
 Micro-Sampling System
 3D Analysis Holder
 Real-time 3D Analytical FIB-SEM NX9000
 CAD Navigation System Navigation System for Failure Analysis (NASFA)
 Focused Ion and Electron Beam System & Triple Beam System NX2000
 Focused Ion Beam System MI4050
Field Emission Scanning Electron
Microscope
 Ultra-high Resolution Scanning Electron Microscope Series
 Schottky Field Emission Scanning Electron Microscope SU5000
 Analytical UHR Schottky Emission Scanning Electron Microscope Series
 Ultra-high Resolution Scanning Electron Microscope SU9000
SEM
 Scanning Electron Microscope SU3500
 Scanning Electron Microscope S-3700N
 Scanning Electron Microscope SU1510
 Scanning Electron Microscope FlexSEM 1000
Tabletop Microscopes
 Tabletop Microscope TM3030 Series
 Energy Dispersive X-ray Spectrometer Quantax70
 Optional Accessory for Tabletop Microscope TM3030/TM3000 3D-VIEW
 Energy Dispersive X-Ray Spectrometers AZtecOne /AZtecOneGO
Nano-Probing System
 Electron Beam Absorbed Current (EBAC) Characterization System nanoEBAC
NE4000
AFM
 Probe Station AFM5000II/Real Tunell
 Scanning Probe Microscope AFM5500M
 General-purpose Small Unit AFM5100N
 Environmental Control Unit AFM5300E
189
MICROSCOPY MARKET – GLOBAL FORECAST TO 2021
© MarketsandMarkets
11.11.3 RECENT DEVELOPMENTS
Month & Year Approach Description
April 2016 New Product Launch
Hitachi High-Technologies Corporation launched the FlexSEM 1000
scanning electron microscope (SEM). The new compact size scanning
electron microscope offers high-resolution, high-throughput imaging,
and user-friendly design with automated functions.
March 2016 New Product Launch
Hitachi High-Tech Science Corporation, a subsidiary of Hitachi High-
Technologies Corporation, introduced the AFM5500M scanning
probe microscope (SPM). The product offers accuracy in
measurement and is more suitable for nano-scale fundamental
research, quality control, and industrial instrumentation field.
August 2014 New Product Launch
Hitachi High-Tech Science Corporation, an affiliated company of
Hitachi High-Technologies Corporation, launched AFM5000II, a
scanning probe microscope (SPM) controller, and the PS3500DDII, a
sequential high-resolution ICP optical emission spectrometer.
August 2014 New Product Launch
Hitachi High-Technologies Corporation launched the TM3030Plus, a
new tabletop electron microscope. This new microscope is equipped
with a highly sensitive detector to observe secondary electron images
under low-vacuum conditions. As of September 2014, the company
had shipped over 2,700 tabletop microscopes.
July 2014 New Product Launch
Hitachi High-Technologies Corporation launched the SU5000, a
Schottky field emission scanning electron microscope. This product is
equipped with a new user interface and the EM Wizard, and has a
maximum power current of 200nA.
May 2013 New Product Launch
Hitachi High-Technologies Corporation launched the SU8200, a field
emission-scanning electron microscope (FE-SEM). This microscope is
characterized by a novel cold field emission (CFE) gun. This launch
has fortified the company’s microscopy portfolio and strengthened its
position in the market.
May 2013 New Product Launch
Hitachi High-Technologies Corporation launched the TM3030, a
tabletop microscope that can provide high-resolution images. This
has extended the company’s portfolio of tabletop microscopes.
April 2013 Expansion
Hitachi High-Technologies established Hitachi High-Technologies
India Private Limited (Hitachi High-Tech India) in Haryana, India. This
new subsidiary mainly focuses on the sale of industrial-use
equipment, industrial materials, electronic materials and software,
and related services. This will help the company increase sales in the
Asia-Pacific region.
Source: Press Releases
190
MICROSCOPY MARKET – GLOBAL FORECAST TO 2021
© MarketsandMarkets
12 APPENDIX
12.1 INSIGHTS OF INDUSTRY EXPERTS
The global microscopy market is expected to grow at a CAGR of 7% to 8% from 2016 to
2021.
Super-resolution microscopy is the upcoming trend in the global microscopy market.
Emerging markets such as China, India, Brazil, and the Middle East offer significant
growth opportunities for players in the microscopy market.
191
MICROSCOPY MARKET – GLOBAL FORECAST TO 2021
© MarketsandMarkets
12.2 DISCUSSION GUIDE
Q. 1. What are your views on the growth perspective of the global microscopy market? What is the current scenario of
the market and at what rate is it expected to grow in the coming five years?
Primary’s Viewpoint: _________________________________________________________________
Q. 2. Kindly provide the market sizes as well as projected growth rates of the following regional segments and their
respective countries to the microscopy market in 2016.
Region Market Size (%), 2016
CAGR%
(2016–2021)
North America
 U.S.
 Canada
Europe
 Germany
 U.K.
 France
 Rest of Europe (RoE)
Asia-Pacific
Rest of the World (RoW)
 Brazil
 Mexico
 Argentina
 Rest of Latin America
Primary’s Viewpoint: ________________________________________________________________
192
MICROSCOPY MARKET – GLOBAL FORECAST TO 2021
© MarketsandMarkets
Q. 3. Kindly provide the market sizes as well as projected growth rates of the following product segments of the global
microscopy market. Which segment is expected to grow at the fastest rate and why? (Kindly validate the market
segmentation and let me know if there are other product segments or if there is any overlap between these
segments)
Product Market Share (%), 2016
CAGR%
(2016–2021)
Optical Microscopes
 Fluorescence Microscopes
 Super-resolution Microscopes
Confocal Microscopes
 Spinning Disk Confocal Microscopes
 Multiphoton Confocal Microscopes
Electron Microscopes
 Transmission Electron Microscopes
 Scanning Electron Microscopes
Scanning Probe Microscopes
 Scanning Tunneling Microscopes
 Atomic Force Microscopes
 Near-field Scanning Optical Microscopes
Primary’s Viewpoint: _________________________________________________________________
Q. 4. Kindly provide the market sizes as well as the projected growth rates of the following application segments of the
global microscopy market. What is the key factor that will drive the fastest-growing segment of the market in the
next five years? (Kindly validate the market segmentation and let me know if there are other applications or if there
is any overlap between these segments)
Application Market Share (%), 2016
CAGR%
(2016–2021)
Semiconductors
Life Sciences
Material Sciences
Nanotechnology
Primary’s Viewpoint: _________________________________________________________________
193
MICROSCOPY MARKET – GLOBAL FORECAST TO 2021
© MarketsandMarkets
Q. 5. Kindly provide the market sizes as well as the projected growth rates of the following end-user segments of the
global microscopy market. What is the key factor that will drive the fastest-growing end-user segment of the
market in the next five years? (Kindly validate the market segmentation and let me know if there are other end
users or if there is any overlap between these segments)
End User Market Share (%), 2016
CAGR%
(2016–2021)
Academic Institutes
Industries (biotechnology and pharmaceutical,
semiconductor, textile, mining, and natural
resources industries)
Other End Users (Government Research
Institutions and Private Laboratories)
Primary’s Viewpoint: _________________________________________________________________
Q. 6. What are the market shares of the following key companies in the global microscopy market? (Kindly validate the
key companies and let me know if there are any other major companies in this market)
Company Name Market Share (%), 2015
Carl Zeiss
Leica Microsystems
Nikon Corporation
Olympus
FEI Co.
Primary’s Viewpoint: _________________________________________________________________
Q. 7. Please provide your insights on the key strengths, weaknesses, opportunities, and threats for the key companies
mentioned in the table below? According to you, which company will win the market share race in the next five
years and why?
Company Name Strength Weakness Opportunity Threat
Carl Zeiss
Leica Microsystems
Nikon Corporation
Olympus
FEI Co.
Primary’s Viewpoint: _________________________________________________________________
194
MICROSCOPY MARKET – GLOBAL FORECAST TO 2021
© MarketsandMarkets
Q. 8. Kindly validate the drivers, restraints, opportunities, and challenges in the global microscopy market and let me
know if there are any other factors affecting this market?
Parameter
Drivers
 Rising global focus on nanotechnology
 Government support and corporate funding
 Technological advancements
Restraints
 High cost of advanced microscopes
 Implementation of excise tax by the U.S. government
 Heavy custom duty on medical devices
Opportunities
 Emerging markets (China, Brazil, India, and the Middle East)
 New application areas such as quantum dots and optogenetics
Challenges
 Sample preparation
 Requirement of a high degree of technical expertise
Primary’s Viewpoint: _________________________________________________________________
Q. 9. What are the upcoming products that will have a significant impact on the market in the future?
Primary’s Viewpoint: _________________________________________________________________
Q. 10. What will be the revenue pockets for the market in the next five years?
Primary’s Viewpoint: ________________________________________________________________
Q. 11. How do you see your company’s position in this market in the next five years?
Primary’s Viewpoint: _________________________________________________________________
195
MICROSCOPY MARKET – GLOBAL FORECAST TO 2021
© MarketsandMarkets
12.3 OTHER DEVELOPMENTS
Month & Year Approach Description
May 2016 Product Enhancement
Bruker Corporation launched SENTERRA II, a compact research
grade confocal multi laser Raman microscope. SENTERRA II is the
advanced version of SENTERRA with novel features such as
compact size, easy to use interface, and higher resolution.
SENTERRA II has wide array of applications which includes material
science, pharmaceutical and novel nano-materials, life science,
forensics, art, and geology. This product launch will extend the
company’s microscopic portfolio in the market.
April 2016 New Product Launch
Carl Zeiss launched ZEISS LSM 880, a confocal laser scanning
microscope for material science and failure analysis. The product
comprises of the confocal fluorescence and other contrasting
techniques which enables high-precision examination of
nanomaterials, metals, polymers, and semiconductors with
maximum information content. The product also offers precise
capture of 3D topography and the investigation of nanometer-scaled
structures. This launch will help the company to strengthen its
confocal laser scanning microscope portfolio.
April 2016 Product Enhancement
Olympus Corporation launched FLUOVIEW FV3000 and FV3000RS
confocal laser scanning microscopes series, an enhancement in the
FV1200 series. The updated version includes features such as high
speed, high-resolution, three-dimensional images, and high
sensitivity that capture light even from dim samples. The series also
offers high-resolution images for fast, accurate imaging of biological
samples. With this launch company will strengthen confocal laser
scanning microscopes portfolio.
April 2016 New Product Launch
Hitachi High-Technologies Corporation launched scanning electron
microscope (SEM), FlexSEM 1000. The new compact size scanning
electron microscope offers high resolution, high-throughput imaging,
and user friendly design with automated functions.
March 2016 New Product Launch
Hitachi High-Tech Science Corporation a subsidiary of Hitachi High-
Technologies Corporation introduced AFM5500M scanning probe
microscope (SPM). The product offers accuracy in measurement and
is more suitable for nano-scale fundamental research, quality
control, and industrial instrumentation field.
January 2016 Product Enhancement
Bruker’s Nano Surfaces Division introduced MultiMode 8-HR Atomic
Force Microscope (AFM) replacing the successor model, MultiMode
platform. MultiMode 8-HR offers enhanced capabilities like high
speed and higher resolution imaging for nanomechanics. With this
launch the company enhanced its visibility in the highly competitive
microscopy market.
January 2016 New Product Launch
Carl Zeiss launched Smartproof 5, a widefield confocal microscope
for industrial applications in quality assurance and quality control
departments, production environments, and research and
development labs. The microscope offers 3D reconstructions and
roughness measurements for a wide range of work piece surfaces.
January 2016 Product Enhancement
Carl Zeiss introduced EISS Xradia Versa with FPX, an extension for
the ZEISS Xradia Versa 500-series of 3D X-ray microscopes. ZEISS
FPX enhances image quality and improves workflow which is useful
196
MICROSCOPY MARKET – GLOBAL FORECAST TO 2021
© MarketsandMarkets
Month & Year Approach Description
in the industrial development and academic research to examine
large samples.
January 2016 Product Enhancement
Olympus Corporation unveiled BX53M/BXFM system microscope.
BX53M/BXFM system microscope is an enhanced version of BXiS
with the additional and improved features such as aperture
adjustment and switching between different observation methods.
January 2016 New Software Launch
Olympus Corporation presented OLYMPUS Stream V2.1 software.
The new software enables the instant MIA function for building
composite panorama images. This launch helped the company to
strengthen its software portfolio.
January 2016 New Product Launch
Olympus Corporation launched new units for SZX series of stereo
microscopes; SZX2-LTTR ergonomic long tilting trinocular and SZX2-
EEPA extendable eye point adjuster. The new launch helped to
increase productivity and reduce the fatigue associated with
microscope use.
January 2016 New Product Launch
JEOL Ltd. launched JEM-F200, a multi-purpose transmission
electron microscope. JEM-F200 offers features such as quad-lens
condenser system, advanced scan system, Pico stage drive, dual
SDD and environment friendly with ECO mode energy saving system.
September 2015 New Product Launch
Oxford Instruments Asylum Research launched Cypher ES Polymer
Edition, an atomic force microscope optimized for polymer research.
The product offers highest resolution, fast scanning, heating, and
the most comprehensive suite of nanomechanical characterization
tools. Cypher ES polymer is useful for polymer and material science
applications.
August 2015 New Product Launch
Bruker Corporation launched multipoint scanning confocal
microscope; Opterra II, which symbolizes the next generation of
quantitative live-cell microscopes. Opterra II includes features such
as high speed and resolution, illumination uniformity, low photo-
toxicity, and photo-bleaching capabilities.
August 2015 New Product Launch
JEOL Ltd. introduced JSM-7200F, a field emission scanning electron
microscope. JSM-7200F utilizes JEOL proprietary in-lens Schottky
Plus technology that allows high resolution at low accelerating
voltages.
August 2015 New Product Launch
JEOL Ltd. introduced benchtop scanning electron microscope, JCM-
6000Plus NeoScope, equipped with high-sensitivity semiconductor
detector, high-vacuum functionality, and secondary electron
detector. This microscope offers sleek exterior design, high image
quality, user friendly interface with touch panel, and automated
function for easy operation.
July 2015 New Product Launch
Leica Microsystems launched Leica DM4 B and Leica DM6 B, an
upright research microscopes series. The series has wide
application in life science research, laser microdissection,
neurosciences and evolutionary biology, materials science, and
materials analysis.
May 2015 New Product Launch
Bruker Corporation introduced Contour Elite 3D Optical
Microscopes, a fully integrate high-definition microscope with three-
dimensional (3D) optical metrology functionality. With the features
like high-speed operation, accuracy, repeatability, and imaging and
197
MICROSCOPY MARKET – GLOBAL FORECAST TO 2021
© MarketsandMarkets
Month & Year Approach Description
display advantage it is useful to top-level research and development
and production QC facilities. With this launch the company
strengthened its optical microscopes portfolio.
April 2015 New Product Launch
ZEISS introduced ZEISS GeminiSEM and ZEISS Sigma– two product
line of field emission scanning electron microscopes (FE-SEMs) with
enhanced Gemini technology. The ZEISS GeminiSEM family provides
high contrast and low voltage images from any sample. In addition,
the ZEISS Sigma microscopes offer high quality imaging and
advanced analytical microscopy. Both the product has wide range of
applications in research, industrial labs, and imaging facilities. The
proven Gemini design offers efficient detection, high resolution, and
ease-of-use.
April 2015 New Product Launch
Leica Microsystems launched the Leica DVM6 digital microscope.
Leica DVM6 offers Integrated illumination options and PlanApo-
corrected optics ensure high quality images. The product has wide
applications in inspection, analysis, and measurement in quality
control, quality assurance, failure analysis, research and
development, and forensics.
April 2015 Product Enhancement
Olympus Corporation introduced biological microscope CX23, an
enhanced version of CX22LED. The microscope is easy to use and
thus facilitates the use of these microscopes in educational training
at various universities and other teaching laboratories.
March 2015 Product Enhancement
Nikon Corporation unveiled super resolution microscope N-STORM
4.0. N-STORM 4.0 is an enhanced version of the super resolution
microscope, N-STORM which was released in 2010. The new
enhanced product offers features such as dynamic super resolution
imaging at the nanoscale level and improvement of image quality.
This product enhancement helped the company to cater the unmet
market needs.
March 2015 New Product Launch
Leica Microsystems introduced Leica EM Cryo CLEM, a system
facilitates correlative light and electron microscopy (CLEM). CLEM
enables sample study under fluorescence light microscope and the
electron microscope and also allows rapid screening of large areas
and fast determination of regions of interest. The Leica EM Cryo
CLEM system comprises of a fluorescence light microscope with cryo
stage, cryo objective, and a cyro transfer shuttle.
March 2015 New Product Launch
Olympus Corporation launched DSX Series of digital microscopes,
the DSX510, DSX510i, and DSX110. Reliability and ease-of-use are
the key features of this series.
January 2015 New Product Launch
ZEISS introduced LSM 800, a new compact confocal laser scanning
microscope for high-end confocal imaging. ZEISS LSM 800 provides
high image quality and offers enhanced productivity and throughput,
as well as greater flexibility in live cell imaging.
December 2014 New product launch
ZEISS launched ZEISS Stemi 305 and ZEISS Stemi 508, two new
compact Greenough stereo microscopes for education, lab routine
and industrial inspection. The product offers images in true color,
3D, with high contrast and free of distortion or color fringes.
November 2014 New product launch
ZEISS introduced MultiSEM 505, a new scanning electron
microscope (SEM) featured with 61 beams working in parallel, and
198
MICROSCOPY MARKET – GLOBAL FORECAST TO 2021
© MarketsandMarkets
Month & Year Approach Description
offers an unrivaled capture speed. ZEISS MultiSEM 505 is designed
for frequent operation and fitted with the intuitive ZEN Software.
October 2014 New Product Launch
Olympus Corporation launched the STM7 Measuring Microscope.
This product can be used for efficient shape measurement of
machine parts, semiconductors, electronic components, and other
parts in industrial processes. This product launch helped the
company to offer innovative technology to its customer base.
However, this product is not available in Europe market.
October 2014 New Product Launch
Leica Microsystems introduced Leica M530 OH6 Neurosurgical
Microscope. This microscope is armed with technologies such as
advanced small angle illumination (SAI), FusionOptics, and
apochromatic optics. This launch helped the company to strengthen
its neurosurgical microscope portfolio.
October 2014 Collaboration
Carl Zeiss collaborated with University of California, Berkeley, to
support BRAIN Initiative organized by the Berkeley Brain Microscopy
Innovation Centre (BrainMIC). This BRAIN Initiative is supported by
the National Institutes of Health (NIH). This initiative aimed to
develop the company’s microscopy business by using emerging
neurotechnologies.
October 2014 New Product Launch
Olympus Corporation launched the DP27 and DP22 standalone
microscope digital cameras. These products can be used with both
biological and industrial microscopes. This product launch helped
the company to further expand its product portfolio.
September 2014 New Product Launch
Bruker Corporation introduced Innova-IRIS, the first guaranteed Tip-
enhanced Raman Spectroscopy (TERS) system designed to
accelerate the adoption of nano-Raman spectroscopy research.
Innova-IRIS is a combination of TERS probes based on high-contrast
tuning-fork with nano-Raman spectroscopy and high-performance
Atomic Force Microscopy (AFM) capabilities. This launch enables the
company to provide technologically advanced products to its
customers.
September 2014 Agreement
Carl Zeiss signed an agreement with Howard Hughes Medical
Institute (U.S.) to commercialize the Bessel beam plane illumination
microscopy, also known as lattice light sheet microscopy. This
technique offers high-speed 3D fluorescence imaging of living
cellular and multicellular specimens.
September 2014 New Product Launch
Leica Microsystems introduced Leica Application Suite X (LAS X)
imaging software in the life sciences segment for all widefield,
confocal, and super-resolution microscopes. This software is
equipped with a basic version known as LAS X Core. This launch
strengthened the company’s microscope software portfolio.
September 2014 New Product Launch
Leica Microsystems introduced Leica M844 and Leica M822
ophthalmology microscopes with TrueVision 3D visualization,
recording, and editing technologies. These microscopes help
surgeons and researchers in anterior and posterior surgical
techniques.
September 2014 New Product Launch
Leica Microsystems launched Leica DMi8 inverted microscope. The
microscope is equipped with additional features such as incident
illumination port, infinity port, and laser systems. This advanced
199
MICROSCOPY MARKET – GLOBAL FORECAST TO 2021
© MarketsandMarkets
Month & Year Approach Description
product launch helped the company to strengthen its portfolio for
inverted research microscopes.
September 2014 Product Development
Olympus Corporation developed its FV-OSR super-resolution
technology. This product can be combined with the FV10-OSRASW
biological confocal laser scanning microscope. This development
helped the company to strengthen its customer base.
September 2014 New Product Launch
FEI introduced the Helios NanoLab G3 DualBeam, a combination of
electron and ion optics microscopy, which comes in two different
workflow-specific configurations for material science research. This
product expanded FEI’s transmission electron microscope (TEM)
portfolio.
September 2014 New Product Launch
FEI Co. unveiled the new Teneo VolumeScope (VS) scanning electron
microscope (SEM), a fully integrated 3D volume imaging solution.
This product is equipped with VolumeScope, an in-chamber
microtome and proprietary analytical software.
August 2014 New Product Launch
Hitachi High-Technologies Corporation launched the TM3030Plus, a
new tabletop electron microscope. This new microscope is equipped
with a highly sensitive detector to observe secondary electron
images under low-vacuum conditions. As of September 2014, the
company has shipped over 2,700 Tabletop Microscopes.
August 2014 New Product Launch
Asylum Research, an Oxford Instruments company, launched AM-FM
Viscoelastic Mapping Mode, a new nanomechanical imaging
technique. This technique is a combination of quantitative abilities
of normal tapping mode (AM) with high-sensitivity frequency
modulation mode (FM). This launch strengthened the company’s
NanomechPro toolkit product line.
August 2014 New Product Launch
Hitachi High-Tech Science Corporation, an affiliated company of
Hitachi High-Technologies Corporation, launched AFM5000II, a
Scanning Probe Microscope (SPM) controller, and the PS3500DDII,
a sequential high-resolution ICP Optical Emission Spectrometer.
July 2014 New Product Launch
Bruker Corporation unveiled Inspire, its first integrated scanning
probe microscopy (SPM) infrared system. This product is the
integration of four technologies, namely, infrared scattering,
scanning near-field optical microscope (sSNOM) optics, point-and-
click alignment, and PeakForce Tapping. This launch helped the
company to build its position in the emerging microscopy market.
July 2014 New Product Launch
Carl Zeiss introduced LSM 880 with Airyscan, a new confocal
microscope. This microscope is equipped with increased sensitivity,
resolution, and speed, leading to improved quantitative imaging and
productivity. This launch helped the company to strengthen its
market share and provide technologically developed solutions to its
customers.
July 2014 New Product Launch
Leica Microsystems launched the new Leica LMD software V7.5.1.
The software is equipped with features such as extended toolbox for
shape definition, improved AVC software, remote navigation, and
extension of time lapse. This advanced product launch helped the
company to strengthen its portfolio of software solutions.
July 2014 New Product Launch
Leica Microsystems launched the new Leica Planapo 2.0x CORR
objective for the Leica M series stereo microscope. The system can
200
MICROSCOPY MARKET – GLOBAL FORECAST TO 2021
© MarketsandMarkets
Month & Year Approach Description
be used for imaging in aqueous solutions and provides users with
sharp specimen visualization. This advanced product launch helped
the company to strengthen its stereo microscope portfolio.
July 2014 New Product Launch
FEI Co. launched two new products, namely, the Helios plasma
focused ion beam (PFIB) DualBeam and Teneo scanning electron
microscope (SEM). These products can provide faster analyses in
metal research.
July 2014 New Product Launch
JEOL launched the new JEM-ARM300F atomic resolution electron
microscope. This product is equipped with a 300kV atomic
resolution and aberration corrector. This helped the company to
strengthen its market presence.
July 2014 New Product Launch
Hitachi High-Technologies Corporation launched the SU5000, a
Schottky field emission scanning electron microscope. This product
is equipped with a new user interface, the EM Wizard, and has a
maximum power current of 200nA.
July 2014 New Product Launch
FEI Co. launched two new products, namely, a new phase plate
solution and the Titan Halo transmission electron microscope (TEM).
These two products are based on cryo-electron microscopy
applications and enable analysis of 3D structure of molecules and
molecular complexes.
June 2014 New Product Launch
Leica Microsystems introduced a new software platform - Leica
Application Suite Advanced Fluorescence (LAS AF). This platform is
used in widefield and confocal microscopy (v4.0) for advanced life
science research. This product launch helped the company to
strengthen its portfolio of software solutions.
June 2014 New Product Launch
Leica Microsystems launched the new Leica DMi1, an inverted
microscope. The microscope is armed with LED illumination which
delivers constant color temperature.
June 2014 Partnership
Leica Microsystems partnered with its distributors in Turkey, Mikro-
Optik Tıbbi Malzeme Ithalat Ihracat ve Ticaret Limited and
Gantenbein Ticaret Mürsel Gelincik ve Ortağı Adi Komandit Sirketi.
This partnership will help the company strengthen its market
presence in Turkey.
June 2014 Collaboration
FEI Co. collaborated with the metal labs at The University of
Manchester's Electron Microscopy Centre in the School of Materials.
This collaboration is aimed for steel and non-ferrous alloy research.
May 2014 New Product Launch
Nikon launched the DS-Ri2 Microscope Camera and DS-Qi2
Monochrome Microscope Camera. These products are equipped
Nikon’s FX-format CMOS sensor.
May 2014 New Product Launch
Leica Microsystems along with Med X Change, Inc. (U.S.) launched
the new EvolutionHD 2D Medical Video Recorder (EVO). The
recorder delivers surgical content automatically to Apple iPad and
iPhone devices and provides high-definition video recording. This
launch helped the company to provide advanced technologies to its
customers.
May 2014 Product Development
Leica Microsystems released Leica M320 F12, a clinic ear, nose,
and throat (ENT) surgical microscope, with additional features of
multifocal objective lens and a fully integrated HD 1080p camera.
This product development helped surgeons to improve the efficiency
201
MICROSCOPY MARKET – GLOBAL FORECAST TO 2021
© MarketsandMarkets
Month & Year Approach Description
at point of care. This launch strengthened the company’s product
portfolio of surgical microscopes.
May 2014 Product Enhancement
Leica Microsystems unveiled Leica M320 F12 and Leica M720 OH5,
for ear, nose, and throat (ENT) surgeries, at Combined
Otolaryngology Spring Meetings (COSM). The M320 F12 is equipped
with new Leica M320 MultiFoc objective lens, whereas, M720 OH5
is equipped with integrated TrueVision 3D technology. This launch
helped the company to strengthen its surgical microscope portfolio.
May 2014 Product Enhancement
Leica Microsystems introduced the new version of Leica Steel Expert
2.0 software. This software is used for quick quality control
upgradation in steel processing and manufacturing. This enhanced
product helped the company to provide advanced technology-based
products to its customers.
May 2014 New Product Launch
Leica Microsystems launched the new Leica TCS SP8 STED 3X,
super-resolution system. The system’s main feature is its stimulated
emission depletion (STED) technology. This product launch helped
the company to strengthen its microscopy portfolio.
April 2014 New Product Launch
Nikon expanded its stereo microscope portfolio by introducing new
products, namely, the SMZ1270, the SMZ1270i, and the SMZ800N.
Of these, the SMZ1270 and SMZ1270i are equipped with new WF
series objectives and offer highest-in-class zoom ratio. This product
launch helped the company to strengthen its market share.
April 2014 Product Enhancement
Leica Microsystems introduced the new enhanced versions of Leica
DM100 and Leica DM300 Educational Microscopes. These products
are now equipped with new high-performance achromat objectives,
ISO-labeled plan achromat objectives, new open monocular tubes,
and improved optical correction for binocular tubes. This product
enhancement helped the company strengthen its product portfolio
by unveiling microscopes with the latest technologies for its
customers.
April 2014 Partnership
Leica Microsystems extended its alliance with TrueVision 3D
Surgical (U.S.). This partnership resulted in the integration of
TrueVision’s 3D technology with Leica’s ophthalmic microscopes.
This extended partnership enhanced Leica’s existing ophthalmic
microscope product line.
April 2014 New Product Launch
Asylum Research introduced its new MFP-3D Infinity atomic force
microscope (AFM), with new nanomechanical measurement
capabilities. This launch benefited the company in the expansion of
the MFP-3D AFM portfolio.
March 2014 New Product Launch
Carl Zeiss introduced ZEISS Primotech, a new imaging system for
material analysis, at the Laser World of Photonics China 2014 trade
show. This microscope is equipped with integrated camera and can
quickly and reproducibly analyze products. This launch helped the
company expand its product portfolio.
March 2014 New Product Launch
Leica Microsystems introduced the new Leica EM AFS2 Remote
Monitoring Solution. This solution enabled remote monitoring of a
freeze substitution program running on a Leica EM AFS2 unit. Such
technologically advanced solutions aid the company to provide its
customers with valuable solutions, and ultimately strengthen its
202
MICROSCOPY MARKET – GLOBAL FORECAST TO 2021
© MarketsandMarkets
Month & Year Approach Description
customer base.
February 2014 New Product Launch
Leica Microsystems introduced Leica DCM8, a 3D surface metrology
solution. This solution is equipped with interferometric optical and
confocal profiler and provides experience of both technologies
needed for surface analysis of materials. This new product launch
helped the company to strengthen its confocal microscopy portfolio.
February 2014 New Product Launch
Leica Microsystems introduced Leica EM TIC 3X which can be used
for the cross section of any material. This product uses the ion beam
etching technique for scanning electron microscope (SEM)
microstructure analysis. This new launch helped the company to
strengthen its scanning electron microscopy portfolio.
January 2014 New Product Launch
Asylum Research unveiled the new atomic force microscope
technique, namely, Scanning Microwave Impedance Microscopy
(sMIM). This new AFM technique enables nanoscale mapping of
permittivity and conductivity with unprecedented sensitivity and
resolution on any material including conductors, semiconductors,
and insulators. This launch strengthened the company’s MFP-3D
and Cypher AFMs portfolio and provided it a competitive edge in the
market.
December 2013 New Product Launch
Bruker Corporation introduced Opterra Multipoint Scanning Confocal
Microscope at the American Society for Cell Biology Annual Meeting
2013. This microscope is used for the betterment of resolution and
fast confocal imaging of live cell preparations. The launch
strengthened the company’s product portfolio and provided flexible
optical workstations to its end users.
December 2013 New Product Launch
Bruker Corporation launched ContourSP 3D optical microscope to
measure each layer of the printed circuit board (PCB) panels during
production. This launch extended the company’s product offerings
for metrology systems.
December 2013 New Product Launch
Leica Microsystems introduced Steel Expert 2.0 software, for non-
metallic inclusion analysis in steel alloys. This software is used to
identify samples for non-metallic inclusions using automatic steel
inclusion rating programs, which provides fast, accurate, and
reproducible purity measurements in steel. This launch helped the
company strengthen its product portfolio.
November 2013 New Product Launch
Nikon Corp. launched the new Ti-LAPP System, a laser application
system. This system is featured with various combinations of
multiple epi-fluorescence modules, with high flexibility, high
expandability, an auto-alignment function to simplify TIRF
observations, and a DMD Module that offers a variety of photo
stimulation patterns.
November 2013 Agreement
Carl Zeiss granted a license for patents to Lumencor, Inc. (U.S.) for
LED fluorescence excitation used in microscopy. This agreement
benefited Zeiss to increase its market share in the U.S. market.
November 2013 New Product Launch
Asylum Research introduced blueDrive Photothermal Excitation, a
technology for the Asylum’s Cypher AFM (AFMs) family. This
technology is simple, stable, and enables accurate tapping mode
imaging. This launch extended the company’s product portfolio in
the microscopy market.
203
MICROSCOPY MARKET – GLOBAL FORECAST TO 2021
© MarketsandMarkets
Month & Year Approach Description
November 2013 Product Development
Leica Microsystems released Laser Microdissection Software
Version 7.4. This software has features such as Leica laser screw,
image overlay, and lasing within fluorescence. This development
helped the company to maintain its position in the market by
offering products with latest technologies in the microscopy market.
November 2013 New Product Launch
Carl Zeiss unveiled Photoactivated Localization Microscopy (PALM)
in 3D as a new technology for 3D super-resolution microscopy at the
Society for Neuroscience Annual Meeting in California. This launch
helped the company expand its 3D microscopy portfolio.
October 2013 New Product Launch
FEI Co. introduced the Tecnai Femto ultrafast electron microscope
(UEM). This product was first installed by the University of Minnesota
in November 2013. This helped the company to become one of the
innovative companies in the microscopy market.
October 2013 Partnership
JEOL partnered with Gatan, Inc. (U.S.), to encourage the technique
of the Serial Block Face SEM (SBFSEM) by integrating Gatan's
3View2.XP system on its JSM-7100F FE-SEM.
October 2013 New Product Launch
FEI Co. introduced ExSolve, a high-throughput sample preparation
workflow for transmission electron microscopy (TEM) analysis. This
product enables site-specific TEM lamella preparation, giving
semiconductor manufacturers more information than conventional
approaches.
September 2013 New Product Launch
JEOL introduced the Scanning Electron Microscope JSM-IT300
series. This product is designed with a user interface and can be
applied to research, material testing/assessment/defect analysis,
quality assurance, and analytical tests.
September 2013 New Product Launch
Bruker Corporation launched the new LumiMap
Electroluminescence System for control of epi process quality. This
product provides reliable electrical and optical epi wafer
measurements.
September 2013 New Product Launch
Carl Zeiss unveiled Gemini I VP (Variable Pressure) Focused Ion
Beam (FIB) Column and Gemini II Column. These two products
enable fast and precise material processing in 3D nanotomography
and nanofabrication. This launch helped the company to strengthen
its scanning electron microscope (SEM) portfolio.
September 2013 New Product Launch
Asylum Research introduced Contact Resonance Viscoelastic
Mapping Mode technique. This new technique enables high-
resolution, quantitative imaging particularly suited for characterizing
moderate-to-high modulus materials. This launch helped the
company to augment its current product offerings in NanomechPro
Toolkit.
August 2013 New Product Launch
Carl Zeiss introduced the new ZEISS Xradia 810 Ultra, an X-ray
microscopy (XRM) solution that increases throughput for 3D imaging
at the nanoscale by up to 10 times. This launch expanded the
company’s product offerings in the microscopy business.
August 2013 New Product Launch
Carl Zeiss unveiled the next-generation EVO series for scanning
electron microscope for material and life science applications. The
EVO series reduces workflow from 400 steps to 15 steps. This
launch helped the company to broaden its product offerings and to
increase its customer base.
204
MICROSCOPY MARKET – GLOBAL FORECAST TO 2021
© MarketsandMarkets
Month & Year Approach Description
August 2013 New Product Launch
FEI Co. launched three new TEMs, namely, the Metrios TEM, the
Talos TEM, and the Titan Themis TEM. These three new microscopes
can perform efficiently and effectively in the semiconductor
manufacturing, material and life sciences, and atomic-scale
measurement applications.
August 2013 New Product Launch
Asylum Research unveiled the new GetReal Automated Probe
Calibration feature for the atomic force microscope (AFM). This
technology enables consistent and accurate results, and
strengthened the company’s position in the microscopy market.
July 2013 New Product Launch
FEI Co. unveiled two new DualBeam systems, namely, Scios
DualBeam and Helios NanoLab 660 DualBeam. Both systems are
specially designed for imaging materials.
June 2013 New Product Launch
FEI co. introduced the Helios NanoLab 1200AT, a new DualBeam
system. This system is equipped with an automated front-opening
universal pod (FOUP) loader.
June 2013 Collaboration
FEI Co. collaborated with the University of Oklahoma to establish the
FEI-OU Pore Scale Characterization Laboratory at the Mewborne
School of Petroleum and Geological Engineering (MPGE). The
collaboration agreement includes FEI's Helios NanoLab 650
DualBeam and QEMSCAN automated mineralogy tool for evaluation
of organic particles.
May 2013 New Product Launch
Nikon launched two research stereo microscopes, the SMZ25
motorized epi-fluorescence set and the SMZ18 episcopic plain stand
set. These products are equipped with large zoom range and
enhanced epi-fluorescence imaging.
May 2013 New Product Launch
Asylum Research launched the new MFP-3D Origin atomic force
microscope (AFM). The technology has superior performance and is
affordable as compared to the existing technologies in the AFM
portfolio. This new launch helped the company extend its range of
AFMs and strengthened its position in this market.
May 2013 New Product Launch
Hitachi High-Technologies Corporation launched the SU8200, a
Field Emission-Scanning Electron Microscopes (FE-SEM). This
microscope is characterized by a novel cold field emission (CFE)
gun. This fortified the company’s microscopy portfolio and
strengthened its position in the market.
May 2013 New Product Launch
Hitachi High-Technologies Corporation launched the TM3030, a
tabletop microscope that can provide high-resolution images. This
extended the company’s portfolio of tabletop microscopes.
May 2013 New Product Launch
Olympus Corporation launched the LEXT OLS4100 3D, a measuring
laser microscope, equipped for performing 3D observations and
measurements of surface features on microelectronic devices.
April 2013 Product Enhancement
Bruker Corporation developed its PeakForce Tapping technology to
form Dimension Edge-Scan Asyst platform. This product is an
expansion of the proprietary PeakForce Tapping technology. This
modified tool helped the company to provide advanced
technological solutions to its customers.
April 2013 New Product Launch
JEOL launched a new correlative microscope system, ‘MiXcroscopy’,
a combination of optical microscopy and scanning electron
205
MICROSCOPY MARKET – GLOBAL FORECAST TO 2021
© MarketsandMarkets
Month & Year Approach Description
microscopy. The company designed MiXcroscopy in collaboration
with Nikon Corporation (Japan). This has fortified the company’s
microscopy portfolio and strengthened its position in the market.
April 2013 Partnership
Bruker Corporation partnered with the University of Manchester’s
National Graphene Institute (NGI), a leader in graphene research, to
provide its Dimension FastScan Atomic Force Microscope (AFM).
This partnership leveraged Bruker’s expertise in the microscopy
segment.
March 2013 New Product Launch
Bruker Corporation launched new products at Pittcon 2013, an
annual conference and exposition for laboratory science. The
launched products include ContourGT-K 3D optical microscope and
SkyScan 1272, a high-resolution X-ray micro-CT 3D microscope. At
the Pittcon 2013, the company unveiled various new products to
mark its presence in the microscopy market.
March 2013 New Product Launch
Olympus Corporation unveiled a series of IX3 series units and the
cellSens V1.8 imaging software for inverted microscopes. The IX3
series units efficiently work with the upgraded version of Olympus'
cellSens V1.8 microscope imaging software.
March 2013 New Product Launch
FEI Co. released a new combined scanning electron microscope
(SEM) and X-ray spectrometer, the ASPEX CleanCHK analyzer. This
product is equipped with an automated electron beam-based
particulate contamination monitor.
Source: Press Releases
206
MICROSCOPY MARKET – GLOBAL FORECAST TO 2021
© MarketsandMarkets
12.4 KNOWLEDGE STORE: MARKETSANDMARKETS’ SUBSCRIPTION
PORTAL
Knowledge Store contains MarketsandMarkets’ unique market insights. As a subscriber you have access
to all of the published titles and any new ones added over the course of the subscription period. You can
subscribe to specific number of reports or domains of your interest.
Knowledge Store enables you to:
 View & download all subscribed reports from a single, online platform
 Contact our analysts to answer any questions related to our reports or request a custom
research
 Share comments on specific reports with the other users of your organization
 Suggest titles/topics to our research teams that you would like us to cover in our future reports
 Identify reports published on the high growth markets within your industry
Get started now by requesting a demo and learning more about Knowledge store - www.mnmks.com
MARKETSANDMARKETS KNOWLEDGE STORE SNAPSHOT
207
MICROSCOPY MARKET – GLOBAL FORECAST TO 2021
© MarketsandMarkets
MARKETSANDMARKETS KNOWLEDGE STORE: HEALTHCARE INDUSTRY SNAPSHOT
208
MICROSCOPY MARKET – GLOBAL FORECAST TO 2021
© MarketsandMarkets
12.5 INTRODUCING RT: REAL-TIME MARKET INTELLIGENCE
Revenue Tree (RT) is an interactive platform that systematically helps users enhance revenues by
identifying high-potential growth markets and tracking them on a real-time basis, at a competitive,
customer-centric, and ecosystem level.
The in-built intelligence of the tool auto-identifies competitors, allied markets, market values, and
customers, and helps users identify tangible hotspots of revenue growth, both in existing and new markets.
The unique feature of RT is the ecosystem, which is linked across a wide range of industries and markets.
Features and Benefits of RT:
 Visual presentation of market data
 Real-time information on market trends and developments
 Information specific to an application, type, or geography
 Competitive intelligence (by tracking developments of major companies)
 Forward integration in the value chain to find potential clients
 Comparison of two or more markets
Value Chain
209
MICROSCOPY MARKET – GLOBAL FORECAST TO 2021
© MarketsandMarkets
Market Dashboard
12.6 AVAILABLE CUSTOMIZATIONS
With the given market data, MarketsandMarkets offers customizations as per the company’s specific
needs. The following customization options are available for the report:
Geographical Analysis
 Further breakdown of the Asia-Pacific microscopy market into India, China, and Rest of Asia-
Pacific
Company Information
 Detailed analysis and profiling of additional market companies (Up to five)
 Market by volume
210
MICROSCOPY MARKET – GLOBAL FORECAST TO 2021
© MarketsandMarkets
12.7 RELATED REPORTS
Sr. No. Report Title Published Date
1
EUROPEAN MICROSCOPY MARKET
By Product (Optical (Fluorescence, Super-Resolution), Confocal, Electron (Transmission),
Scanning (AFM)), Application (Semiconductor, Life Science, Nanotechnology), End User
(Academic Institute, Industries) - Forecast to 2020
http://www.marketsandmarkets.com/Market-Reports/european-microscopy-market-
9816453.html
May 2015
2
PROTEIN LABELING MARKET
By Product (Reagents, Kits, & Services), Labeling Method (In Vitro Labeling, In Vivo
Labeling), Application (Cell-Based Assay, Fluorescence Microscopy, Immunological
Technique), & Region - Global Forecast to 2020
http://www.marketsandmarkets.com/Market-Reports/protein-labeling-market-
16300533.html
December 2015
211
MICROSCOPY MARKET – GLOBAL FORECAST TO 2021
© MarketsandMarkets
Disclaimer: MarketsandMarkets strategic analysis services are limited publications containing valuable
market information provided to a select group of customers in response to orders. Our customers
acknowledge, when ordering, that MarketsandMarkets strategic analysis services are for our customers’
internal use and not for general publication or disclosure to third parties. Quantitative market information is
based primarily on interviews and therefore, is subject to fluctuation.
MarketsandMarkets does not endorse any vendor, product or service depicted in its research publications.
MarketsandMarkets strategic analysis publications consist of the opinions of MarketsandMarkets' research
and should not be construed as statements of fact. MarketsandMarkets disclaims all warranties, expressed
or implied, with respect to this research, including any warranties of merchantability or fitness for a particular
purpose.
MarketsandMarkets takes no responsibility for any incorrect information supplied to us by manufacturers or
users.
All trademarks, copyrights and other forms of intellectual property belong to their respective owners and may
be protected by copyright. Under no circumstance may any of these be reproduced in any form without the
prior written agreement of their owner.
No part of this strategic analysis service may be given, lent, resold or disclosed to non-customers without
written permission.
Reproduction and/or transmission in any form and by any means including photocopying, mechanical,
electronic, recording or otherwise, without the permission of the publisher is prohibited.
For information regarding permission, contact:
Tel: 1-888-600-6441
Email: sales@marketsandmarkets.com

Numbers Game - The Future of Commercial labs

  • 2.
    2 MICROSCOPY MARKET –GLOBAL FORECAST TO 2021 © MarketsandMarkets MarketsandMarkets is a global market research and consulting company. It is World’s No. 2 in terms of premium market research studies published annually. Serving as a business intelligence partner to Fortune 500 companies across the world, it provides multi-client reports, company profiles, databases, and custom research services. MarketsandMarkets covers seventeen industry verticals, including advanced materials, aerospace and defense, agriculture, automotive and transportation, biotechnology, building and construction, chemicals, energy and power, food and beverages, industrial automation, medical devices, mining, minerals and metals, packaging, pharmaceuticals, semiconductor and electronics, and telecommunications and IT. Copyright © 2016 MarketsandMarkets All Rights Reserved. This document contains highly confidential information and is the sole property of MarketsandMarkets. No part of it may be circulated, copied, quoted, or otherwise reproduced without the written approval of MarketsandMarkets.
  • 3.
    3 MICROSCOPY MARKET –GLOBAL FORECAST TO 2021 © MarketsandMarkets TABLE OF CONTENTS 1 INTRODUCTION........................................................................................................ 20 1.1 OBJECTIVES OF THE STUDY...........................................................................................................20 1.2 MARKET DEFINITION.....................................................................................................................20 1.3 MARKET SCOPE............................................................................................................................21 1.3.1 MARKETS COVERED.......................................................................................................21 1.3.2 YEARS CONSIDERED FOR THE STUDY..............................................................................21 1.4 CURRENCY...................................................................................................................................22 1.5 LIMITATIONS ................................................................................................................................22 1.6 STAKEHOLDERS...........................................................................................................................22 2 RESEARCH METHODOLOGY...................................................................................... 23 2.1 MARKET SIZE ESTIMATION............................................................................................................25 2.2 MARKET BREAKDOWN AND DATA TRIANGULATION........................................................................27 2.2.1 KEY DATA FROM SECONDARY SOURCES.........................................................................28 2.2.2 KEY DATA FROM PRIMARY SOURCES..............................................................................28 2.2.2.1 Key industry insights..........................................................................................29 2.3 ASSUMPTIONS.............................................................................................................................30 3 EXECUTIVE SUMMARY.............................................................................................. 31 3.1 CURRENT SCENARIO ....................................................................................................................32 3.2 FUTURE OUTLOOK ........................................................................................................................32 3.3 CONCLUSION...............................................................................................................................36 4 PREMIUM INSIGHTS ................................................................................................ 37 4.1 MICROSCOPY MARKET SNAPSHOT, 2016 VS 2021.......................................................................37 4.2 MICROSCOPY MARKET, BY PRODUCT............................................................................................38 4.3 MICROSCOPY MARKET, BY REGION ..............................................................................................39 4.4 MICROSCOPY MARKET, BY APPLICATION ......................................................................................39 4.5 MICROSCOPY MARKET, BY END USER...........................................................................................40 4.6 LIFE CYCLE ANALYSIS, BY REGION ................................................................................................40 5 MARKET OVERVIEW.................................................................................................. 41 5.1 INTRODUCTION ............................................................................................................................42 5.2 MARKET DYNAMICS......................................................................................................................42 5.2.1 DRIVERS........................................................................................................................43 5.2.1.1 Rising focus on nanotechnology.........................................................................43 5.2.1.2 Favorable government and corporate funding for research and development.....................................................................................................43 5.2.1.3 Technological advancements.............................................................................44
  • 4.
    4 MICROSCOPY MARKET –GLOBAL FORECAST TO 2021 © MarketsandMarkets 5.2.2 RESTRAINTS...................................................................................................................44 5.2.2.1 High cost of advanced microscopes ...................................................................44 5.2.2.2 Implementation of excise tax by the U.S. government .........................................45 5.2.2.3 Heavy custom duty on medical devices...............................................................45 5.2.3 OPPORTUNITIES.............................................................................................................45 5.2.3.1 Emerging markets .............................................................................................45 5.2.3.2 New application areas such as quantum dots and optogenetics..........................45 5.2.3.3 Integration of microscopy with spectroscopy ......................................................46 5.2.4 CHALLENGES.................................................................................................................46 5.2.4.1 Sample preparation...........................................................................................46 5.2.4.2 Requirement of a high degree of technical expertise...........................................46 6 MICROSCOPY MARKET, BY PRODUCT....................................................................... 47 6.1 INTRODUCTION ............................................................................................................................48 6.2 ELECTRON MICROSCOPES ...........................................................................................................49 6.2.1 TRANSMISSION ELECTRON MICROSCOPES (TEM)...........................................................52 6.2.2 SCANNING ELECTRON MICROSCOPES (SEM)..................................................................53 6.3 OPTICAL MICROSCOPES...............................................................................................................54 6.3.1 FLUORESCENCE MICROSCOPES ....................................................................................58 6.3.1.1 Total Internal Reflection Fluorescence Microscopy (TIRF)....................................59 6.3.1.2 Fluorescence Resonance Energy Transfer (FRET).................................................59 6.3.1.3 Fluorescence Recovery After Photo-Bleaching (FRAP).........................................59 6.3.1.4 Fluorescence Lifetime Imaging Microscopy (FLIM)..............................................59 6.3.2 SUPER-RESOLUTION MICROSCOPES..............................................................................59 6.3.2.1 Stochastic Optical Reconstruction Microscopy (STORM).....................................60 6.3.2.2 Structured Illumination Microscopy (SIM) ..........................................................60 6.3.2.3 Stimulated Emission Depletion Microscopy (STED).............................................60 6.3.2.4 Coherent Anti-Strokes Raman Scattering Microscopy (CARS)..............................60 6.3.2.5 Photo-Activated Localization Microscopy (PALM) ...............................................60 6.3.2.6 Reversible Saturable Optical Fluorescence Transitions (RESOLFT).......................60 6.4 CONFOCAL MICROSCOPES...........................................................................................................62 6.4.1 MULTI-PHOTON CONFOCAL MICROSCOPES....................................................................64 6.4.2 SPINNING DISK CONFOCAL MICROSCOPES....................................................................65 6.5 SCANNING PROBE MICROSCOPES (SPM) .....................................................................................65 6.5.1 SCANNING TUNNELING MICROSCOPES (STM) ................................................................69 6.5.2 ATOMIC FORCE MICROSCOPES (AFM) ............................................................................70 6.5.3 NEAR-FIELD SCANNING OPTICAL MICROSCOPES (NSOM)...............................................71
  • 5.
    5 MICROSCOPY MARKET –GLOBAL FORECAST TO 2021 © MarketsandMarkets 7 MICROSCOPY MARKET, BY APPLICATION.................................................................. 72 7.1 INTRODUCTION ............................................................................................................................73 7.2 SEMICONDUCTORS......................................................................................................................74 7.3 LIFE SCIENCES.............................................................................................................................78 7.4 MATERIAL SCIENCES....................................................................................................................82 7.5 NANOTECHNOLOGY......................................................................................................................85 8 MICROSCOPY MARKET, BY END USER...................................................................... 89 8.1 INTRODUCTION ............................................................................................................................90 8.2 ACADEMIC INSTITUTES.................................................................................................................91 8.3 INDUSTRIES.................................................................................................................................95 8.4 OTHER END USERS (GOVERNMENT RESEARCH INSTITUTIONS AND PRIVATE LABORATORIES)...........................................................................................................................98 9 MICROSCOPY MARKET, BY REGION........................................................................ 101 9.1 INTRODUCTION ..........................................................................................................................102 9.2 NORTH AMERICA........................................................................................................................104 9.2.1 U.S. .............................................................................................................................108 9.2.2 CANADA.......................................................................................................................110 9.3 EUROPE.....................................................................................................................................113 9.3.1 GERMANY....................................................................................................................118 9.3.2 THE U.K........................................................................................................................120 9.3.3 FRANCE .......................................................................................................................122 9.3.4 REST OF EUROPE (ROE)................................................................................................124 9.4 ASIA-PACIFIC.............................................................................................................................126 9.5 REST OF THE WORLD (ROW)........................................................................................................130 9.5.1 BRAZIL.........................................................................................................................133 9.5.2 MEXICO .......................................................................................................................136 9.5.3 ARGENTINA..................................................................................................................139 9.5.4 REST OF LATIN AMERICA (ROLA)...................................................................................142 10 COMPETITIVE LANDSCAPE ..................................................................................... 145 10.1 OVERVIEW..................................................................................................................................146 10.2 MARKET ANALYSIS.....................................................................................................................147 10.3 BATTLE FOR MARKET SHARE: NEW PRODUCT LAUNCHES IS THEKEY GROWTH STRATEGY ADOPTED BY MARKET COMPANIES.............................................................................................149 10.4 NEW PRODUCT LAUNCHES .........................................................................................................150 10.5 AGREEMENTS, PARTNERSHIPS, AND COLLABORATIONS .............................................................151 10.6 ACQUISITIONS............................................................................................................................152 10.7 EXPANSIONS..............................................................................................................................153
  • 6.
    6 MICROSCOPY MARKET –GLOBAL FORECAST TO 2021 © MarketsandMarkets 11 COMPANY PROFILES.............................................................................................. 154 11.1 INTRODUCTION ..........................................................................................................................154 11.2 BRUKER CORPORATION .............................................................................................................155 11.2.1 BUSINESS OVERVIEW...................................................................................................155 11.2.2 PRODUCTS OFFERED....................................................................................................156 11.2.3 RECENT DEVELOPMENTS..............................................................................................157 11.2.4 MNM VIEW...................................................................................................................158 11.3 LEICA MICROSYSTEMS GMBH ....................................................................................................159 11.3.1 BUSINESS OVERVIEW...................................................................................................159 11.3.2 PRODUCTS OFFERED....................................................................................................160 11.3.3 RECENT DEVELOPMENTS..............................................................................................162 11.3.4 MNM VIEW...................................................................................................................163 11.4 CARL ZEISS AG...........................................................................................................................164 11.4.1 BUSINESS OVERVIEW...................................................................................................164 11.4.2 PRODUCTS OFFERED....................................................................................................165 11.4.3 RECENT DEVELOPMENTS..............................................................................................166 11.4.4 MNM VIEW...................................................................................................................168 11.5 NIKON CORPORATION ................................................................................................................169 11.5.1 BUSINESS OVERVIEW...................................................................................................169 11.5.2 PRODUCTS OFFERED....................................................................................................170 11.5.3 RECENT DEVELOPMENTS..............................................................................................171 11.5.4 MNM VIEW...................................................................................................................172 11.6 FEI CO........................................................................................................................................173 11.6.1 BUSINESS OVERVIEW...................................................................................................173 11.6.2 PRODUCTS OFFERED....................................................................................................174 11.6.3 RECENT DEVELOPMENTS..............................................................................................175 11.6.4 MNM VIEW...................................................................................................................176 11.7 OLYMPUS CORPORATION ...........................................................................................................177 11.7.1 BUSINESS OVERVIEW...................................................................................................177 11.7.2 PRODUCTS OFFERED....................................................................................................178 11.7.3 RECENT DEVELOPMENTS..............................................................................................178 11.8 ASYLUM RESEARCH (OXFORD INSTRUMENTS) ............................................................................180 11.8.1 BUSINESS OVERVIEW...................................................................................................180 11.8.2 PRODUCTS OFFERED....................................................................................................181 11.8.3 RECENT DEVELOPMENTS..............................................................................................181 11.9 DANISH MICRO ENGINEERING....................................................................................................183 11.9.1 BUSINESS OVERVIEW...................................................................................................183 11.9.2 PRODUCTS OFFERED....................................................................................................183 11.9.3 RECENT DEVELOPMENTS..............................................................................................183
  • 7.
    7 MICROSCOPY MARKET –GLOBAL FORECAST TO 2021 © MarketsandMarkets 11.10 JEOL LTD. ...................................................................................................................................184 11.10.1 BUSINESS OVERVIEW...................................................................................................184 11.10.2 PRODUCTS OFFERED....................................................................................................185 11.10.3 RECENT DEVELOPMENTS..............................................................................................186 11.11 HITACHI HIGH-TECHNOLOGIES CORPORATION ............................................................................187 11.11.1 BUSINESS OVERVIEW...................................................................................................187 11.11.2 PRODUCTS OFFERED....................................................................................................188 11.11.3 RECENT DEVELOPMENTS..............................................................................................189 12 APPENDIX.............................................................................................................. 190 12.1 INSIGHTS OF INDUSTRY EXPERTS ...............................................................................................190 12.2 DISCUSSION GUIDE ...................................................................................................................191 12.3 OTHER DEVELOPMENTS..............................................................................................................195 12.4 KNOWLEDGE STORE: MARKETSANDMARKETS’ SUBSCRIPTION PORTAL.......................................206 12.5 INTRODUCING RT: REAL-TIME MARKET INTELLIGENCE.................................................................208 12.6 AVAILABLE CUSTOMIZATIONS.....................................................................................................209 12.7 RELATED REPORTS.....................................................................................................................210
  • 8.
    8 MICROSCOPY MARKET –GLOBAL FORECAST TO 2021 © MarketsandMarkets LIST OF TABLES TABLE 1 GLOBAL MICROSCOPY MARKET SIZE, BY PRODUCT, 2014–2021 (USD MILLION) 48 TABLE 2 ELECTRON MICROSCOPES MARKET SIZE, BY TYPE, 2014-2021 (USD MILLION) 49 TABLE 3 ELECTRON MICROSCOPES MARKET SIZE, BY REGION, 2014-2021 (USD MILLION) 50 TABLE 4 NORTH AMERICA: ELECTRON MICROSCOPES MARKET SIZE, BY COUNTRY, 2014–2021 (USD MILLION) 50 TABLE 5 EUROPE: ELECTRON MICROSCOPES MARKET SIZE, BY COUNTRY/REGION, 2014–2021 (USD MILLION) 51 TABLE 6 ROW: ELECTRON MICROSCOPES MARKET SIZE, BY COUNTRY/REGION, 2014–2021 (USD MILLION) 51 TABLE 7 TRANSMISSION ELECTRON MICROSCOPES MARKET SIZE, BY REGION, 2014-2021 (USD MILLION) 52 TABLE 8 ROW: TRANSMISSION ELECTRON MICROSCOPES MARKET SIZE, BY COUNTRY/REGION, 2014–2021 (USD MILLION) 52 TABLE 9 SEM MARKET SIZE, BY REGION, 2014-2021 (USD MILLION) 53 TABLE 10 ROW: SEM MARKET SIZE, BY COUNTRY/REGION, 2014-2021 (USD MILLION) 53 TABLE 11 OPTICAL MICROSCOPES MARKET SIZE, BY TYPE, 2014-2021 (USD MILLION) 55 TABLE 12 OPTICAL MICROSCOPES MARKET SIZE, BY REGION, 2014-2021 (USD MILLION) 56 TABLE 13 NORTH AMERICA: OPTICAL MICROSCOPES MARKET SIZE, BY COUNTRY, 2014–2021 (USD MILLION) 56 TABLE 14 EUROPE: OPTICAL MICROSCOPES MARKET SIZE, BY COUNTRY/REGION, 2014–2021 (USD MILLION) 57 TABLE 15 ROW: OPTICAL MICROSCOPES MARKET SIZE, BY COUNTRY/REGION, 2014–2021 (USD MILLION) 57 TABLE 16 FLUORESCENCE MICROSCOPES MARKET SIZE, BY REGION, 2014–2021 (USD MILLION) 58 TABLE 17 ROW: FLUORESCENCE MICROSCOPES MARKET SIZE, BY COUNTRY/REGION, 2014–2021 (USD MILLION) 58 TABLE 18 SUPER-RESOLUTION MICROSCOPES MARKET SIZE, BY REGION, 2014–2021 (USD MILLION) 61 TABLE 19 ROW: SUPER-RESOLUTION MICROSCOPES MARKET SIZE, BY COUNTRY/REGION, 2014–2021 (USD MILLION) 61 TABLE 20 CONFOCAL MICROSCOPES MARKET SIZE, BY REGION, 2014-2021 (USD MILLION) 63 TABLE 21 NORTH AMERICA: CONFOCAL MICROSCOPES MARKET SIZE, BY COUNTRY, 2014–2021 (USD MILLION) 63 TABLE 22 EUROPE: CONFOCAL MICROSCOPES MARKET SIZE, BY COUNTRY/REGION, 2014–2021 (USD MILLION) 64 TABLE 23 ROW: CONFOCAL MICROSCOPES MARKET SIZE, BY COUNTRY/REGION, 2014–2021 (USD MILLION) 64 TABLE 24 SPM MARKET SIZE, BY TYPE, 2014-2021 (USD MILLION) 66 TABLE 25 SPM MARKET SIZE, BY REGION, 2014-2021 (USD MILLION) 67 TABLE 26 NORTH AMERICA: SPM MARKET SIZE, BY COUNTRY, 2014–2021 (USD MILLION) 67 TABLE 27 EUROPE: SPM MARKET SIZE, BY COUNTRY/REGION, 2014–2021 (USD MILLION) 67 TABLE 28 ROW: SPM MARKET SIZE, BY COUNTRY/REGION, 2014–2021 (USD MILLION) 68 TABLE 29 STM MARKET SIZE, BY REGION, 2014-2021 (USD MILLION) 69 TABLE 30 ROW: STM MARKET SIZE, BY COUNTRY/REGION, 2014–2021 (USD MILLION) 69
  • 9.
    9 MICROSCOPY MARKET –GLOBAL FORECAST TO 2021 © MarketsandMarkets TABLE 31 AFM MARKET SIZE, BY REGION, 2014-2021 (USD MILLION) 70 TABLE 32 ROW: AFM MARKET SIZE, BY COUNTRY/REGION, 2014–2021 (USD MILLION) 70 TABLE 33 NSOM MARKET SIZE, BY REGION, 2014-2021 (USD MILLION) 71 TABLE 34 ROW: NSOM MARKET SIZE, BY COUNTRY/REGION, 2014–2021 (USD MILLION) 71 TABLE 35 GLOBAL MICROSCOPY MARKET SIZE, BY APPLICATION, 2014–2021 (USD MILLION) 73 TABLE 36 MICROSCOPY MARKET SIZE FOR SEMICONDUCTORS, BY REGION, 2014–2021 (USD MILLION) 75 TABLE 37 NORTH AMERICA: MICROSCOPY MARKET SIZE FOR SEMICONDUCTORS, BY COUNTRY, 2014–2021 (USD MILLION) 75 TABLE 38 EUROPE: MICROSCOPY MARKET SIZE FOR SEMICONDUCTORS, BY COUNTRY/REGION, 2014–2021 (USD MILLION) 76 TABLE 39 ROW: MICROSCOPY MARKET SIZE FOR SEMICONDUCTORS, BY COUNTRY/REGION, 2014–2021 (USD MILLION) 76 TABLE 40 MICROSCOPY MARKET SIZE FOR SEMICONDUCTORS, BY PRODUCT, 2014–2021 (USD MILLION) 77 TABLE 41 MICROSCOPY MARKET SIZE FOR LIFE SCIENCES, BY REGION, 2014–2021 (USD MILLION) 79 TABLE 42 NORTH AMERICA: MICROSCOPY MARKET SIZE FOR LIFE SCIENCES, BY COUNTRY, 2014–2021 (USD MILLION) 80 TABLE 43 EUROPE: MICROSCOPY MARKET SIZE FOR LIFE SCIENCES, BY COUNTRY/REGION, 2014–2021 (USD MILLION) 80 TABLE 44 ROW: MICROSCOPY MARKET SIZE FOR LIFE SCIENCES, BY COUNTRY, 2014–2021 (USD MILLION) 81 TABLE 45 MICROSCOPY MARKET SIZE FOR LIFE SCIENCES, BY PRODUCT, 2014–2021 (USD MILLION) 81 TABLE 46 MICROSCOPY MARKET SIZE FOR MATERIAL SCIENCES, BY REGION, 2014–2021 (USD MILLION) 82 TABLE 47 NORTH AMERICA: MICROSCOPY MARKET SIZE FOR MATERIAL SCIENCES, BY COUNTRY, 2014–2021 (USD MILLION) 82 TABLE 48 EUROPE: MICROSCOPY MARKET SIZE FOR MATERIAL SCIENCES, BY COUNTRY/REGION, 2014–2021 (USD MILLION) 83 TABLE 49 ROW: MICROSCOPY MARKET SIZE FOR MATERIAL SCIENCES, BY COUNTRY/REGION, 2014–2021 (USD MILLION) 84 TABLE 50 MICROSCOPY MARKET SIZE FOR MATERIAL SCIENCES, BY PRODUCT, 2014–2021 (USD MILLION) 84 TABLE 51 MICROSCOPY MARKET SIZE FOR NANOTECHNOLOGY, BY REGION, 2014–2021 (USD MILLION) 85 TABLE 52 NORTH AMERICA: MICROSCOPY MARKET SIZE FOR NANOTECHNOLOGY, BY COUNTRY, 2014–2021 (USD MILLION) 86 TABLE 53 EUROPE: MICROSCOPY MARKET SIZE FOR NANOTECHNOLOGY, BY COUNTRY/REGION, 2014–2021 (USD MILLION) 86 TABLE 54 ROW: MICROSCOPY MARKET SIZE FOR NANOTECHNOLOGY, BY COUNTRY/REGION, 2014–2021 (USD MILLION) 87 TABLE 55 MICROSCOPY MARKET SIZE FOR NANOTECHNOLOGY, BY PRODUCT, 2014–2021 (USD MILLION) 88 TABLE 56 MICROSCOPY MARKET SIZE, BY END USER, 2014–2021 (USD MILLION) 90 TABLE 57 MICROSCOPY MARKET SIZE FOR ACADEMIC INSTITUTES, BY REGION, 2014–2021 (USD MILLION) 93 TABLE 58 NORTH AMERICA: MICROSCOPY MARKET SIZE FOR ACADEMIC INSTITUTES, BY COUNTRY, 2014–2021 (USD MILLION) 93
  • 10.
    10 MICROSCOPY MARKET –GLOBAL FORECAST TO 2021 © MarketsandMarkets TABLE 59 EUROPE: MICROSCOPY MARKET SIZE FOR ACADEMIC INSTITUTES, BY COUNTRY/REGION, 2014–2021 (USD MILLION) 94 TABLE 60 ROW: MICROSCOPY MARKET SIZE FOR ACADEMIC INSTITUTES, BY COUNTRY/REGION, 2014 –2021 (USD MILLION) 94 TABLE 61 MICROSCOPY MARKET SIZE FOR INDUSTRIES, BY REGION, 2014–2021 (USD MILLION) 96 TABLE 62 NORTH AMERICA: MICROSCOPY MARKET SIZE FOR INDUSTRIES, BY COUNTRY, 2014–2021 (USD MILLION) 96 TABLE 63 EUROPE: MICROSCOPY MARKET SIZE FOR INDUSTRIES, BY COUNTRY/REGION, 2014–2021 (USD MILLION) 97 TABLE 64 ROW: MICROSCOPY MARKET SIZE FOR INDUSTRIES, BY COUNTRY/REGION, 2014–2021 (USD MILLION) 97 TABLE 65 MICROSCOPY MARKET SIZE FOR OTHER END USERS, BY REGION, 2014–2021 (USD MILLION) 99 TABLE 66 NORTH AMERICA: MICROSCOPY MARKET SIZE FOR OTHER END USERS, BY COUNTRY, 2014 –2021 (USD MILLION) 99 TABLE 67 EUROPE: MICROSCOPY MARKET SIZE FOR OTHER END USERS, BY COUNTRY/REGION, 2014 –2021 (USD MILLION) 100 TABLE 68 ROW: MICROSCOPY MARKET SIZE FOR OTHER END USERS, BY COUNTRY/REGION, 2014–2021 (USD MILLION) 100 TABLE 69 MICROSCOPY MARKET SIZE, BY REGION, 2014–2021 (USD MILLION) 103 TABLE 70 NORTH AMERICA: MICROSCOPY MARKET SIZE, BY PRODUCT, 2014-2021 (USD MILLION) 106 TABLE 71 NORTH AMERICA: OPTICAL MICROSCOPES MARKET SIZE, BY TYPE, 2014-2021 (USD MILLION) 106 TABLE 72 NORTH AMERICA: ELECTRON MICROSCOPES MARKET SIZE, BY TYPE, 2014-2021 (USD MILLION) 106 TABLE 73 NORTH AMERICA: SPM MARKET SIZE, BY TYPE, 2014-2021 (USD MILLION) 107 TABLE 74 NORTH AMERICA: MICROSCOPY MARKET SIZE, BY APPLICATION, 2014-2021 (USD MILLION) 107 TABLE 75 NORTH AMERICA: MICROSCOPY MARKET SIZE, BY END USER, 2014-2021 (USD MILLION) 108 TABLE 76 NORTH AMERICA: MICROSCOPY MARKET SIZE, BY COUNTRY, 2014-2021 (USD MILLION) 108 TABLE 77 U.S.: MICROSCOPY MARKET SIZE, BY PRODUCT, 2014-2021 (USD MILLION) 109 TABLE 78 U.S.: MICROSCOPY MARKET SIZE, BY APPLICATION, 2014-2021 (USD MILLION) 110 TABLE 79 U.S.: MICROSCOPY MARKET SIZE, BY END USER, 2014-2021 (USD MILLION) 110 TABLE 80 CANADA: MICROSCOPY MARKET SIZE, BY PRODUCT, 2014-2021 (USD MILLION) 111 TABLE 81 CANADA: MICROSCOPY MARKET SIZE, BY APPLICATION, 2014-2021 (USD MILLION) 111 TABLE 82 CANADA: MICROSCOPY MARKET SIZE, BY END USER, 2014-2021 (USD MILLION) 112 TABLE 83 EUROPE: MICROSCOPY MARKET SIZE, BY PRODUCT, 2014-2021 (USD MILLION) 115 TABLE 84 EUROPE: OPTICAL MICROSCOPES MARKET SIZE, BY TYPE, 2014-2021 (USD MILLION) 116 TABLE 85 EUROPE: ELECTRON MICROSCOPES MARKET SIZE, BY TYPE, 2014-2021 (USD MILLION) 116 TABLE 86 EUROPE: SPM MARKET SIZE, BY TYPE, 2014-2021 (USD MILLION) 116 TABLE 87 EUROPE: MICROSCOPY MARKET SIZE, BY APPLICATION, 2014-2021 (USD MILLION) 117 TABLE 88 EUROPE: MICROSCOPY MARKET SIZE, BY END USER, 2014-2021 (USD MILLION) 117
  • 11.
    11 MICROSCOPY MARKET –GLOBAL FORECAST TO 2021 © MarketsandMarkets TABLE 89 EUROPE: MICROSCOPY MARKET SIZE, BY COUNTRY/REGION, 2014-2021 (USD MILLION) 117 TABLE 90 GERMANY: MICROSCOPY MARKET SIZE, BY PRODUCT, 2014-2021 (USD MILLION) 118 TABLE 91 GERMANY: MICROSCOPY MARKET SIZE, BY APPLICATION, 2014-2021 (USD MILLION) 119 TABLE 92 GERMANY: MICROSCOPY MARKET SIZE, BY END USER, 2014-2021 (USD MILLION) 120 TABLE 93 U.K.: MICROSCOPY MARKET SIZE, BY PRODUCT, 2014-2021 (USD MILLION) 121 TABLE 94 U.K.: MICROSCOPY MARKET SIZE, BY APPLICATION, 2014-2021 (USD MILLION) 121 TABLE 95 U.K.: MICROSCOPY MARKET SIZE, BY END USER, 2014-2021 (USD MILLION) 121 TABLE 96 FRANCE: MICROSCOPY MARKET SIZE, BY PRODUCT, 2014-2021 (USD MILLION) 122 TABLE 97 FRANCE: MICROSCOPY MARKET SIZE, BY APPLICATION, 2014-2021 (USD MILLION) 122 TABLE 98 FRANCE: MICROSCOPY MARKET SIZE, BY END USER, 2014-2021 (USD MILLION) 123 TABLE 99 ROE: MICROSCOPY MARKET SIZE, BY PRODUCT, 2014-2021 (USD MILLION) 124 TABLE 100 ROE: MICROSCOPY MARKET SIZE, BY APPLICATION, 2014-2021 (USD MILLION) 125 TABLE 101 ROE: MICROSCOPY MARKET SIZE, BY END USER, 2014-2021 (USD MILLION) 125 TABLE 102 ASIA-PACIFIC: MICROSCOPY MARKET SIZE, BY PRODUCT, 2014-2021 (USD MILLION) 128 TABLE 103 ASIA-PACIFIC: OPTICAL MICROSCOPES MARKET SIZE, BY TYPE, 2014-2021 (USD MILLION) 128 TABLE 104 ASIA-PACIFIC: ELECTRON MICROSCOPES MARKET SIZE, BY TYPE, 2014-2021 (USD MILLION) 128 TABLE 105 ASIA-PACIFIC: SPM MARKET SIZE, BY TYPE, 2014-2021 (USD MILLION) 129 TABLE 106 ASIA-PACIFIC: MICROSCOPY MARKET SIZE, BY APPLICATION, 2014-2021 (USD MILLION) 129 TABLE 107 ASIA-PACIFIC: MICROSCOPY MARKET SIZE, BY END USER, 2014-2021 (USD MILLION) 129 TABLE 108 ROW: MICROSCOPY MARKET SIZE, BY PRODUCT, 2014-2021 (USD MILLION) 130 TABLE 109 ROW: OPTICAL MICROSCOPES MARKET SIZE, BY TYPE, 2014-2021 (USD MILLION) 130 TABLE 110 ROW: ELECTRON MICROSCOPES MARKET SIZE, BY TYPE, 2014-2021 (USD MILLION) 131 TABLE 111 ROW: SPM MARKET SIZE, BY TYPE, 2014-2021 (USD MILLION) 131 TABLE 112 ROW: MICROSCOPY MARKET SIZE, BY APPLICATION, 2014-2021 (USD MILLION) 131 TABLE 113 ROW: MICROSCOPY MARKET SIZE, BY END USER, 2014-2021 (USD MILLION) 132 TABLE 114 ROW: MICROSCOPY MARKET SIZE, BY COUNTRY/REGION, 2014-2021 (USD MILLION) 133 TABLE 115 BRAZIL: MICROSCOPY MARKET SIZE, BY PRODUCT, 2014-2021 (USD MILLION) 133 TABLE 116 BRAZIL: OPTICAL MICROSCOPES MARKET SIZE, BY TYPE, 2014-2021 (USD MILLION) 134 TABLE 117 BRAZIL: ELECTRON MICROSCOPES MARKET SIZE, BY TYPE, 2014-2021 (USD MILLION) 134 TABLE 118 BRAZIL: SPM MARKET SIZE, BY TYPE, 2014-2021 (USD MILLION) 135 TABLE 119 BRAZIL: MICROSCOPY MARKET SIZE, BY APPLICATION, 2014-2021 (USD MILLION) 135 TABLE 120 BRAZIL: MICROSCOPY MARKET SIZE, BY END USER, 2014-2021 (USD MILLION) 135 TABLE 121 MEXICO: MICROSCOPY MARKET SIZE, BY PRODUCT, 2014-2021 (USD MILLION) 136 TABLE 122 MEXICO: OPTICAL MICROSCOPES MARKET SIZE, BY TYPE, 2014-2021 (USD MILLION) 137 TABLE 123 MEXICO: ELECTRON MICROSCOPES MARKET SIZE, BY TYPE, 2014-2021 (USD MILLION) 137
  • 12.
    12 MICROSCOPY MARKET –GLOBAL FORECAST TO 2021 © MarketsandMarkets TABLE 124 MEXICO: SPM MARKET SIZE, BY TYPE, 2014-2021 (USD MILLION) 137 TABLE 125 MEXICO: MICROSCOPY MARKET SIZE, BY APPLICATION, 2014-2021 (USD MILLION) 138 TABLE 126 MEXICO: MICROSCOPY MARKET SIZE, BY END USER, 2014-2021 (USD MILLION) 138 TABLE 127 ARGENTINA: MICROSCOPY MARKET SIZE, BY PRODUCT, 2014-2021 (USD MILLION) 139 TABLE 128 ARGENTINA: OPTICAL MICROSCOPES MARKET SIZE, BY TYPE, 2014-2021 (USD MILLION) 139 TABLE 129 ARGENTINA: ELECTRON MICROSCOPES MARKET SIZE, BY TYPE, 2014-2021 (USD MILLION) 140 TABLE 130 ARGENTINA: SPM MARKET SIZE, BY TYPE, 2014-2021 (USD MILLION) 140 TABLE 131 ARGENTINA: MICROSCOPY MARKET SIZE, BY APPLICATION, 2014-2021 (USD MILLION) 141 TABLE 132 ARGENTINA: MICROSCOPY MARKET SIZE, BY END USER, 2014-2021 (USD MILLION) 142 TABLE 133 ROLA: MICROSCOPY MARKET SIZE, BY PRODUCT, 2014-2021 (USD MILLION) 142 TABLE 134 ROLA: OPTICAL MICROSCOPES MARKET SIZE, BY TYPE, 2014-2021 (USD MILLION) 143 TABLE 135 ROLA: ELECTRON MICROSCOPES MARKET SIZE, BY TYPE, 2014-2021 (USD MILLION) 143 TABLE 136 ROLA: SPM MARKET SIZE, BY TYPE, 2014-2021 (USD MILLION) 144 TABLE 137 ROLA: MICROSCOPY MARKET SIZE, BY APPLICATION, 2014-2021 (USD MILLION) 144 TABLE 138 ROLA: MICROSCOPY MARKET SIZE, BY END USER, 2014-2021 (USD MILLION) 144 TABLE 139 OPTICAL MICROSCOPES MARKET RANKING, BY KEY COMPANY, 2015 147 TABLE 140 ELECTRON MICROSCOPES MARKET RANKING, BY KEY COMPANY, 2015 148 TABLE 141 CONFOCAL MICROSCOPES MARKET RANKING, BY KEY COMPANY, 2015 148 TABLE 142 SPM MARKET SHARE, BY KEY COMPANY, 2015 149 TABLE 143 NEW PRODUCT LAUNCHES, 2013–2016 150 TABLE 144 AGREEMENTS, PARTNERSHIPS, AND COLLABORATIONS, 2013–2016 151 TABLE 145 ACQUISITIONS, 2013–2016 152 TABLE 146 EXPANSIONS, 2013-2016 153
  • 13.
    13 MICROSCOPY MARKET –GLOBAL FORECAST TO 2021 © MarketsandMarkets LIST OF FIGURES FIGURE 1 RESEARCH DESIGN 23 FIGURE 2 MARKET SIZE ESTIMATION AND DATA TRIANGULATION 25 FIGURE 3 BREAKDOWN OF PRIMARY INTERVIEWS: BY COMPANY TYPE, DESIGNATION, AND REGION 26 FIGURE 4 MARKET DATA TRIANGULATION METHODOLOGY 27 FIGURE 5 MICROSCOPY MARKET SNAPSHOT, 2016 VS. 2021 31 FIGURE 6 ELECTRON MICROSCOPES PRODUCT SEGMENT TO WITNESS THE FASTEST GROWTH DURING THE FORECAST PERIOD 32 FIGURE 7 SEMICONDUCTORS TO ACCOUNT FOR THE LARGEST SHARE OF THE MICROSCOPY APPLICATIONS MARKET IN 2016 33 FIGURE 8 ACADEMIC INSTITUTES WILL BEMAJOR END USERS OF THE MICROSCOPY MARKET 34 FIGURE 9 GEOGRAPHICAL SNAPSHOT: NORTH AMERICA DOMINATED THE MICROSCOPY MARKET IN 2015 35 FIGURE 10 TECHNOLOGICAL ADVANCEMENTS AND FAVORABLE GOVERNMENT FUNDING ARE IMPORTANT GROWTH DRIVERS 37 FIGURE 11 ELECTRON MICROSCOPES TO ACCOUNT FOR THE HIGHEST SHARE IN 2016 38 FIGURE 12 ASIA-PACIFIC TO GROW AT THE HIGHEST RATE DURING THE FORECAST PERIOD 39 FIGURE 13 SEMICONDUCTORS SEGMENT TO DOMINATE THE MICROSCOPY APPLICATIONS MARKET IN 2016 39 FIGURE 14 ACADEMIC INSTITUTES FORM MAJOR END USERS OF THE MICROSCOPY MARKET 40 FIGURE 15 ASIA-PACIFIC MARKET SHOWCASES LUCRATIVE GROWTH OPPORTUNITIES 40 FIGURE 16 FAVORABLE GOVERNMENT AND CORPORATE FUNDING TO BOOST MARKET GROWTH 42 FIGURE 17 ELECTRON MICROSCOPES SEGMENT TO ACCOUNT FOR THE LARGEST SHARE OF THE MICROSCOPY MARKET, BY PRODUCT, IN 2016 48 FIGURE 18 SEM TO ACCOUNT FOR THE LARGEST SHARE OF THE ELECTRON MICROSCOPES MARKET IN 2016 49 FIGURE 19 FLUORESCENCE MICROSCOPES TO DOMINATE THE OPTICAL MICROSCOPES MARKET DURING THE FORECAST PERIOD 54 FIGURE 20 ASIA-PACIFIC TO WITNESS HIGHEST GROWTH IN THE OPTICAL MICROSCOPES MARKET DURING THE FORECAST PERIOD 55 FIGURE 21 APAC TO WITNESS HIGHEST GROWTH IN THE CONFOCAL MICROSCOPES MARKET DURING THE FORECAST PERIOD 62 FIGURE 22 STM SEGMENT TO DOMINATE THE SPM MARKET 66 FIGURE 23 BRAZIL TO ACCOUNT FOR THE LARGEST SHARE OF THE SPM MARKET IN THE ROW 68 FIGURE 24 SEMICONDUCTORS SEGMENT TO DOMINATE THE MICROSCOPY APPLICATION MARKET DURING THE FORECAST PERIOD 73 FIGURE 25 ASIA-PACIFIC TO WITNESS THE HIGHEST GROWTH RATE DURING THE FORECAST PERIOD 74 FIGURE 26 MICROSCOPY INSTRUMENTS IN LIFE SCIENCES 78 FIGURE 27 U.S. TO DOMINATE THE MICROSCOPY MARKET FOR LIFE SCIENCES IN 2016 79 FIGURE 28 GERMANY TO WITNESS THE HIGHEST GROWTH RATE IN THE EUROPEAN MICROSCOPY MARKET FOR MATERIAL SCIENCES 83 FIGURE 29 BRAZIL TO ACCOUNT FOR THE LARGEST SHARE OF THE NANOTECHNOLOGY APPLICATIONS MARKET IN ROW 87
  • 14.
    14 MICROSCOPY MARKET –GLOBAL FORECAST TO 2021 © MarketsandMarkets FIGURE 30 ACADEMIC INSTITUTES TO DOMINATE THE MICROSCOPY MARKET IN 2016 90 FIGURE 31 GROWTH IN NUMBER OF RESEARCH ACTIVITIES TO AID MARKET GROWTH FOR ACADEMIC INSTITUTES (2010–2014) 91 FIGURE 32 ASIA-PACIFIC OFFERS LUCRATIVE GROWTH OPPORTUNITIES DURING THE FORECAST PERIOD 92 FIGURE 33 NORTH AMERICA TO LEAD THE MICROSCOPY MARKET FOR INDUSTRIES DURING THE FORECAST PERIOD 95 FIGURE 34 NORTH AMERICA IS EXPECTED TO DOMINATE THE MICROSCOPY MARKET FOR OTHER END USERS 98 FIGURE 35 GEOGRAPHIC SNAPSHOT: ASIA-PACIFIC TO GROW AT THE FASTEST RATE DURING THE FORECAST PERIOD 102 FIGURE 36 ASIA-PACIFIC OFFERS SIGNIFICANT GROWTH OPPORTUNITIES FOR ALL MICROCOPY PRODUCT CATEGORIES DURING THE FORECAST PERIOD 103 FIGURE 37 NORTH AMERICA: MICROSCOPY MARKET SNAPSHOT, 2016 105 FIGURE 38 SEMICONDUCTORS APPLICATION SEGMENT TO DOMINATE THE U.S. MICROSCOPY MARKET DURING THE FORECAST PERIOD 109 FIGURE 39 ACADEMIC INSTITUTES END-USER SEGMENT TO ACCOUNT FOR THE LARGEST SHARE OF THE CANADIAN MICROSCOPY MARKET IN 2016 112 FIGURE 40 EUROPE: MICROSCOPY MARKET SNAPSHOT, 2016 114 FIGURE 41 ELECTRON MICROSCOPY TO GROW AT THE HIGHEST RATE IN THE EUROPEAN MICROSCOPY MARKET DURING THE FORECAST PERIOD 115 FIGURE 42 SEMICONDUCTORS APPLICATION SEGMENT TO ACCOUNT FOR THE LARGEST SHARE OF THE EUROPEAN MICROSCOPY MARKET IN 2016 119 FIGURE 43 ELECTRON MICROSCOPES PRODUCT SEGMENT TO GROW AT THE HIGHEST RATE IN THE U.K. MICROSCOPY MARKET 120 FIGURE 44 ACADEMIC INSTITUTES END-USER SEGMENT TO ACCOUNT FOR THE HIGHEST SHARE IN THE FRENCH MICROSCOPY MARKET IN 2016 123 FIGURE 45 NANOTECHNOLOGY TO WITNESS FASTEST GROWTH IN THE ROE MICROSCOPY MARKET DURING FORECAST PERIOD 124 FIGURE 46 ASIA-PACIFIC: MICROSCOPY MARKET SNAPSHOT, 2016 127 FIGURE 47 ACADEMIC INSTITUTES END-USER SEGMENT TO WITNESS THE HIGHEST GROWTH RATE IN THE ROW MICROSCOPY MARKET DURING THE FORECAST PERIOD 132 FIGURE 48 STM TO ACCOUNT FOR THE LARGEST SHARE OF THE SPM MARKET IN BRAZIL IN 2016 134 FIGURE 49 ELECTRON MICROSCOPES PRODUCT SEGMENT TO ACCOUNT FOR THE LARGEST SHARE OF THE MEXICAN MICROSCOPY MARKET IN 2016 136 FIGURE 50 NANOTECHNOLOGY APPLICATION SEGMENT TO OFFER LUCRATIVE GROWTH OPPORTUNITIES IN ARGENTINA DURING THE FORECAST PERIOD 141 FIGURE 51 STM TO ACCOUNT FOR THE HIGHEST SHARE IN THE SPM MARKET IN ROLA IN 2016 143 FIGURE 52 COMPANIES MAINLY PURSUED THE STRATEGY OF NEW PRODUCT LAUNCHES FROM 2013 TO JULY 2016 146 FIGURE 53 GEOGRAPHIC REVENUE MIX OF THE TOP FIVE MARKET COMPANIES IN 2015 154 FIGURE 54 BRUKER CORPORATION: COMPANY SNAPSHOT 155 FIGURE 55 DANAHER CORPORATION: COMPANY SNAPSHOT 159 FIGURE 56 CARL ZEISS AG: COMPANY SNAPSHOT 164 FIGURE 57 NIKON CORPORATION: COMPANY SNAPSHOT 169 FIGURE 58 FEI CO.: COMPANY SNAPSHOT 173 FIGURE 59 OLYMPUS CORPORATION: COMPANY SNAPSHOT 177
  • 15.
    15 MICROSCOPY MARKET –GLOBAL FORECAST TO 2021 © MarketsandMarkets FIGURE 60 OXFORD INSTRUMENTS: COMPANY SNAPSHOT 180 FIGURE 61 JEOL LTD.: COMPANY SNAPSHOT 184 FIGURE 62 HITACHI HIGH-TECHNOLOGIES CORPORATION: COMPANY SNAPSHOT 187
  • 16.
    16 MICROSCOPY MARKET –GLOBAL FORECAST TO 2021 © MarketsandMarkets LIST OF ABBREVIATIONS ABBREVIATIONS FULL FORM AFM Atomic Force Microscopy AMIIF Asociación Mexicana De Industrias De Investigación Farmacéutica APAC Asia-Pacific ARRA American Recovery & Reinvestment Act BRAIN Brain Research Through Advancing Innovative Neurotechnologies BrainMIC Berkeley Brain Microscopy Innovation Center BSI Bruker Scientific Instruments BSM Belgian Society for Microscopy CAHT Controlled Atmosphere High Temperature CARS Coherent Anti-Strokes Raman Scattering Microscopy CCD Charge-coupled Device CdSe Cadmium Selenide CFE Cold Field Emission CFI Canada Foundation for Innovation CIHR Canadian Institutes of Health Research CMOS Complementary Metal-Oxide Semiconductor CNTs Carbon Nanotubes COSM Combined Otolaryngology Spring Meetings CRADA Cooperative Research And Development Agreement CROs Contract Research Organizations DME Danish Micro Engineering DOE Department of Energy DS Digital Sight EBAC Electron Beam Absorbed Current EC European Commission EC cell Electrochemistry Cell EDX Enable Atomic-Level Dispersive X-Ray EM Electron Microscope EMC European Microscopy Congress ENT Ear, Nose, and Throat ERC European Research Council ER-C Ernst Ruska-Centre ESM Electrochemical Strain Microscopy ETEM Environmental Transmission Electron Microscope EVO Evolution hd 2D Medical Video Recorder FE-SEM Field Emission Scanning Electron Microscope
  • 17.
    17 MICROSCOPY MARKET –GLOBAL FORECAST TO 2021 © MarketsandMarkets ABBREVIATIONS FULL FORM FIB Focused Ion Beam FISH Fluorescence In Situ Hybridization FLIM Fluorescence Lifetime Imaging Microscopy FLIP Fluorescence Loss In Photobleaching FM Fluorescence Microscopy FONDECYT National Fund For Scientific and Technological Development FOUP Front-opening Universal Pod FP7 European Commission’s Seventh Framework Programme FRAP Fluorescence Recovery After Photo-Bleaching FRET Fluorescence Resonance Energy Transfer GDP Gross Domestic Product GFIS Gas Field Ion Source GSD Ground State Depletion HBP Human Brain Project ICT Information and Communication Technology IR Infrared KAUST King Abdulla University of Science and Technology LAS AF Leica Application Suite Advanced Fluorescence LAS X Leica Application Suite X LSM Laser Scanning Microscopes MAPS Modular Automated Processing System MCT Ministry of Science and Technology MEMS Microelectromechanical Systems MMM Multiphoton Multi-Point Scanning Microscopy MP Multi photon MPGE Mewborne School of Petroleum and Geological Engineering mSPIM Multidirectional Selective Plane Illumination Microscopy NAB Nanoparticle-albumin Bound NASFA Navigation System for Failure Analysis NCI National Cancer Institute NGI National Graphene Institute NIH National Institutes of Health NIHN National Institute of Health And Nutrition NINT National Institute of Nanotechnology NLO Non-linear Optics NMR Nuclear Magnetic Resonance NNI National Nanotechnology Initiative NRC National Research Council
  • 18.
    18 MICROSCOPY MARKET –GLOBAL FORECAST TO 2021 © MarketsandMarkets ABBREVIATIONS FULL FORM NSERC Natural Sciences and Engineering Research Council of Canada NSOM Near-field Scanning Optical Microscopy NSRCs Nanoscale Science Research Centers NTS Nanotechnology Systems Pty. Ltd. OAD Open Application Development OEMs Original Equipment Manufacturers OHSU Oregon Health & Science University OPO Optical Parametric Oscillator ORNL Oak Ridge National Laboratory OTD Office of Technological Development PALM Photo-activated Localization Microscopy PCB Printed Circuit Board PFIB Plasma Focused Ion Beam PFS Perfect Focus System PPACA The Patient Protection and Affordable Care Act QC Quality Control RESOFLT Reversible Saturable Optical Fluorescence Transitions RoE Rest of Europe RoLA Rest of Latin America RoW Rest of the World RT Revenue Tree SAI Small Angle Illumination SBFSEM Serial Block Face Sem SDDs Silicon-drift X-Ray Detectors SEM Scanning Electron Microscopy SFC Swept Field Confocal SII Seiko Instruments, Inc. SIM Structured Illumination Microscopy SMEs Subject Matter Experts SMEs Small and Medium-Sized Enterprises sMIM Scanning Microwave Impedance Microscopy SML Single-molecule Localization SRC Spectra Research Corporation SSIM Saturated Structured Illumination Microscopy STED Stimulated Emission Depletion Microscopy STM Scanning Tunneling Microscopy STORM Stochastic Optical Reconstruction Microscopy TEM Transmission Electron Microscopy
  • 19.
    19 MICROSCOPY MARKET –GLOBAL FORECAST TO 2021 © MarketsandMarkets ABBREVIATIONS FULL FORM TERS Tip-enhanced Raman Spectroscopy TIRF Total Internal Reflection Fluorescence Microscopy U.K. United Kingdom U.S. United States of America UCSF University of California in San Francisco UEM Ultrafast Electron Microscope UHV Ultra-high Vacuum VFM2 Variable Field Module2 VP Variable Pressure VS Volumescope VSG Visualization Sciences Group XRD X-ray Diffraction XRM X-ray Microscopy ZnS Zinc Sulfide
  • 20.
    20 MICROSCOPY MARKET –GLOBAL FORECAST TO 2021 © MarketsandMarkets 1 INTRODUCTION 1.1 OBJECTIVES OF THE STUDY  To define, describe, and forecast the global microscopy market on the basis of product, application, end user, and region  To provide detailed information regarding major factors influencing growth of the market (drivers, restraints, opportunities, industry-specific challenges, and winning imperatives)  To analyze micromarkets1 with respect to individual growth trends, future prospects, and contributions to the overall market  To analyze opportunities in the market for stakeholders and to provide details of the competitive landscape for the market leaders  To forecast the size (by value) of market segments with respect to four main regions (along with countries)—North America, Europe, Asia-Pacific, and Rest of the World  To profile key companies and comprehensively analyze their market shares and core competencies2  To track and analyze competitive developments such as mergers and acquisitions, new product developments, agreements and partnerships, and research and development activities in the microscopy market 1.2 MARKET DEFINITION Microscopes are analytical devices used to view enlarged/magnified images of small objects. The process of investigation of small (or microscopic) objects with the help of microscopes is known as microscopy. 1. Micro markets are defined as further segments and sub segments of the global microscopy market included in the report. 2. Core competencies of companies are captured in terms of their key developments, SWOT analyses, and the key strategies adopted by them to sustain their positions in the market.
  • 21.
    21 MICROSCOPY MARKET –GLOBAL FORECAST TO 2021 © MarketsandMarkets 1.3 MARKET SCOPE 1.3.1 MARKETS COVERED 1.3.2 YEARS CONSIDERED FOR THE STUDY Note: For market estimates, the calendar year has been considered, whereas, for company profiles, the fiscal year has been considered. BY END USER • Academic Institutes • Industries (Pharmaceutical and Biotechnology, Semiconductor, Natural Resources, and Material Science) • Other End Users (Government Research Institutions and Private Laboratories BY REGION • North America  U.S.  Canada • Europe  Germany  U.K.  France  Rest of Europe (RoE) • Asia-Pacific (APAC) • Rest of the World (RoW)  Brazil  Mexico  Argentina  Rest of Latin America (RoLA) BY APPLICATION • Semiconductors • Life Sciences • Material Sciences • Nanotechnology BY PRODUCT • Optical Microscopes  Fluorescence Microscopes  Super-resolution Microscopes • Electron Microscopes  Transmission Electron Microscopes  ScanningElectron Microscopes • Confocal Microscopes  Multi-photon Confocal Microscopes  SpinningDisk Confocal Microscopes • Scanning Probe Microscopes  ScanningTunneling Microscopes  Atomic Force Microscopes  Near-field ScanningOptical Microscopes GLOBAL MICROSCOPY MARKET 2014 HISTORICAL YEAR 2015 BASE YEAR 2021-p PROJECTED YEAR 2016-e–2021-p FORECAST PERIOD 2016-e ESTIMATED YEAR
  • 22.
    22 MICROSCOPY MARKET –GLOBAL FORECAST TO 2021 © MarketsandMarkets 1.4 CURRENCY The currency used in this report is USD, with market size indicated in terms of USD million.  For companies reporting their revenue in USD, the revenue numbers have been taken from their respective annual reports/SEC filings  For companies reporting their revenue in other currencies, the average annual currency conversion rates have been used for a particular year to convert the value to USD 1.5 LIMITATIONS  The market study does not cover the market in terms of volume  This study does not cover the accessories and services markets for microscopy  The market size for super-resolution microscopes and fluorescence microscopes are not covered, due to limited availability of data 1.6 STAKEHOLDERS  Academic institutes  Pharmaceutical and biotechnology industries  Semiconductor industries  Research institutes  Laboratories  Medical device suppliers  Market research and consulting firms
  • 23.
    23 MICROSCOPY MARKET –GLOBAL FORECAST TO 2021 © MarketsandMarkets 2 RESEARCH METHODOLOGY This research study involved the use of extensive secondary sources, directories, and databases such as Hoovers, Bloomberg Businessweek, Factiva, and OneSource, to identify and collect information useful for this technical, market-oriented, and commercial study of the global microscopy market. The primary sources are mainly several industry experts from core and related industries and preferred suppliers, manufacturers, distributors, service providers, reimbursement providers, technology developers, doctors, physiotherapists, alliances, standards and certification organizations from companies and organizations related to all segments of this industry’s value chain. In-depth interviews have been conducted with various primary respondents, which include key industry participants, subject matter experts (SMEs), C-level executives of important market companies, and industry consultants, to obtain and verify critical qualitative and quantitative information as well as to assess future prospects. FIGURE 1 RESEARCH DESIGN MARKET DRIVERS: • Technological advancements • Favorable government funding MARKET RESTRAINTS: • High cost of advanced microscopes • Implementation of excise tax by the U.S. government MARKET OPPORTUNITIES: • Emerging markets • New application areas • Integration of microscopy with spectroscopy MARKET CHALLENGES: • Sample preparation • Requirement of high degree of technical expertise HISTORICAL DATA FOR THE MICROSCOPY MARKET INFLUENCING FACTORS (Market Trends and Dynamics) HISTORICAL DATA OF THE MARKET MARKET SIZE & FORECAST: • By Product • By Application • By End User • By Region ARRIVE AT THE MARKET SIZE, SHARE, AND CAGR FOR THE MICROSCOPY MARKET COMPETITIVE LANDSCAPE FUNDING SCENARIO GEOGRAPHIC USAGE PATTERNS REGULATORY LANDSCAPE IMPACT ANALYSIS OF MARKET TRENDS FORECAST NEW PRODUCT LAUNCHES: More than 90 new product launches between January 2013 to July 2016
  • 24.
    24 MICROSCOPY MARKET –GLOBAL FORECAST TO 2021 © MarketsandMarkets In the secondary research process, various secondary sources have been referred to identify and collect information for this study. Secondary sources include annual reports, press releases, and investor presentations of companies, white papers, medical journals, certified publications, articles from recognized authors, gold standard and silver standard websites, disease-specific organizations, directories, and databases. Secondary research has been mainly used to obtain key information about the industry’s supply chain, its monetary chain, the total pool of key companies, market classification and segmentation according to industry trends to the bottom-most level, geographical markets, and key developments from both market- and technology-oriented perspectives. In the primary research process, various primary sources from both supply and demand sides have been interviewed to obtain qualitative and quantitative information for this report. The primary sources from the supply side include industry experts such as CEOs, vice presidents, marketing directors, technology and innovation directors, and related key executives from various leading companies and organizations operating in the microscopy market. The primary sources from the demand side include scientists, pathologists, doctors, and purchase managers of research institutes, government and private laboratories, and academic institutes. After the complete market engineering (which includes calculations for market statistics, market breakdown, market size estimations, market forecasting, and data triangulation) extensive primary research has been conducted to gather information and verify and validate the critical numbers arrived at. Primary research has been also conducted to identify segmentation types; industry trends; key companies; the competitive landscape; key market dynamics such as drivers, restraints, opportunities, challenges, burning issues, winning imperatives, industry trends, and key player strategies; and conduct the PEST analysis of the market. In the complete market engineering process, both top-down and bottom-up approaches have been extensively used, along with several data triangulation methods to perform market estimation and market forecasting for the overall market segments and sub segments listed in this report. Extensive qualitative and quantitative analysis has been performed on the complete market engineering process to list key information/insights throughout the report.
  • 25.
    25 MICROSCOPY MARKET –GLOBAL FORECAST TO 2021 © MarketsandMarkets 2.1 MARKET SIZE ESTIMATION Both top-down and bottom-up approaches have been used to estimate and validate the size of the global microscopy market and other dependent sub markets. The research methodology used to estimate the market size includes the following details:  Regional geographical markets have been determined through secondary research and added up to estimate the global market value. All percentage shares, splits, and breakdowns have been determined using secondary sources and verified through primary sources. This entire procedure includes the study of annual and financial reports of top market companies and extensive interviews for obtaining key insights from industry leaders such as CEOs, VPs, directors, and marketing executives  All possible parameters that affect the markets covered in this research study have been accounted for, viewed in extensive detail, verified through primary research, and analyzed to derive the final quantitative and qualitative data. This data is consolidated, combined with detailed inputs and analysis from MarketsandMarkets to be presented in this report FIGURE 2 MARKET SIZE ESTIMATION AND DATA TRIANGULATION Note: *Other end users include government research institutes and private laboratories As depicted in the chart, the global microscopy market has been triangulated using both bottom-up and top-down approaches. The global microscopy market has been determined from both primary interviews and secondary sources. By using the bottom-up and top-down approaches, the size of the global microscopy market has been determined by summing up the shares of various geographical regions, products, applications, and end users. GLOBAL MICROSCOPY MARKET Top-down Approach Secondary SourcesPrimary Sources APPLICATION Life Sciences Semiconductors Nanotechnology Material Sciences END USER Academic Institutes Industries Others* REGION Europe North America Asia-Pacific PRODUCT Confocal Microscopes Optical Microscopes Bottom-up Approach Scanning Probe Microscopes Electron Microscopes RoW
  • 26.
    26 MICROSCOPY MARKET –GLOBAL FORECAST TO 2021 © MarketsandMarkets FIGURE 3 BREAKDOWN OF PRIMARY INTERVIEWS: BY COMPANY TYPE, DESIGNATION, AND REGION Note: *Others include sales managers, marketing managers, and product managers Note: The C-level includes Chief Financial Officers, Chief Executive Officers, Chief Information Officers, and Chief Operating Officers *The tiers of companies are defined on the basis of their total revenue. As of 2013: Tier 1 = >USD 5 billion, Tier 2 = USD 500 million to USD 5 billion, and Tier 3 = < USD 500 million NUMBER OF PRIMARIES: BY COMPANY TYPE NUMBER OF PRIMARIES: BY DESIGNATION NUMBER OF PRIMARIES: BY REGION NUMBER OF PRIMARIES: BY TYPE 80% 20% Supply-side Demand-side 22% 45% 22% 11% Tier 1 Companies Tier 2 Companies Tier 3 Companies Consultants 10% 20% 70% C-Level Director-Level Others* 50% 10% 30% 10% North America Europe Asia-Pacific RoW
  • 27.
    27 MICROSCOPY MARKET –GLOBAL FORECAST TO 2021 © MarketsandMarkets 2.2 MARKET BREAKDOWN AND DATA TRIANGULATION After arriving at the overall market size from the market size estimation process explained above, the total market has been split into several segments and sub segments. In order to complete the overall market engineering process and arrive at the exact statistics for all segments and sub segments, the data triangulation and market breakdown procedure has been employed wherever applicable. Data has been triangulated by studying various factors and trends from both the demand and supply sides. Along with this, the market has been validated using both top-down and bottom-up approaches. FIGURE 4 MARKET DATA TRIANGULATION METHODOLOGY SECONDARYSOURCESPRIMARY SOURCES • Microscopy Society of America • The European Microscopy Society • Canadian Cytometry and Microscopy Association • Chinese Electron Microcopy Society • Australian Microscopy and Microanalysis Society Annual Reports, Presentations, Websites and Press Release of top players, News Articles, Journals, and Paid Databases INTERVIEWS WITH: • Physicians • Microscopy technicians and technologists • Purchase managers in healthcare provider organizations DEMANDSIDE INTERVIEWS WITH: • CEOs • Vice presidents • Marketing directors • Technology and innovation directors and related key executives from various key companies and organizations operating in the market SUPPLYSIDE INFORMATIONSOURCED Key Players Competitive Landscape Drivers and Restraints Opportunities/ Challenges Forecasting Market Size (2016) and Market Share (2015) Analysis Regional Analysis MnM KNOW* stands for MarketsandMarkets’ 'Knowledge Asset Management' framework. In this context, it stands for existing market research knowledge repository of over 5,000 granular markets, our flagship competitive intelligence and market research platform "RT", subject matter experts, and independent consultants. MnM KNOW acts as an independent source that helps us validate information gathered from primary and secondary sources . MnM KNOW* PRIMARY SOURCE SECONDARY SOURCE DATA TRIANGULATION
  • 28.
    28 MICROSCOPY MARKET –GLOBAL FORECAST TO 2021 © MarketsandMarkets 2.2.1 KEY DATA FROM SECONDARY SOURCES 2.2.2 KEY DATA FROM PRIMARY SOURCES *Note: Other end users include government research institutes and private laboratories PARAMETERS SOURCES MARKET SIZE • Company Financials • Magazines • Journals • Press Releases • Paid Databases • MarketsandMarkets Data Repository REVENUE OF COMPANIES • Annual Reports • Company Websites • Public Databases • MarketsandMarkets Data Repository QUALITATIVE INFORMATION (Market Dynamics, Trends) • Company Websites • Annual Reports • Press Releases • MarketsandMarkets Data Repository DATAPARAMETERSTYPE  North America: 35%–37%  Europe: 28%–30%  Asia-Pacific: 23%–25%  RoW: 9%–11% According to primary interviews, the following are the percentage splits used for the regional analysis GEOGRAPHIC SPLIT  Optical Microscopes: 36%–38%  Electron Microscopes: 38%–40%  Confocal Microscopes: 8%–10%  Scanning Probe Microscopes: 14%–16% According to primary interviews, the following percentage splits have been used for product analysis PRODUCT ANALYSIS  Academic Institutes: 51%--53%  Industries: 29%--31%  Other End Users*: 16%--18% According to primary interviews, the following are the percentage splits used for the end-user analysis END USER ANALYSIS
  • 29.
    29 MICROSCOPY MARKET –GLOBAL FORECAST TO 2021 © MarketsandMarkets 2.2.2.1 Key industry insights Consultant, Microscopy,U.S. EMEA Head , LeadingMicroscopySupplier President, LeadingMicroscopyCompany,U.K. Sr. VicePresident, MicroscopyBusiness LeadingMicroscopyCompany,Europe The average growth for the global microscopy market will be between 7%–8%.“ “ CEO, LeadingProvider of MicroscopyProducts, U.S. The U.S. dominates the microscopy market, while the Asia- Pacific is expected to register the highest growth from 2016 to 2021. “ “ Emerging markets such as China, India, Brazil, and Middle East offer new avenues for the growth of the microscopy market. “ “ Super-resolution microscopy is an upcoming trend in this market. “ “ Nanotechnology is the fastest-growing application segment in the microscopy market.“ “
  • 30.
    30 MICROSCOPY MARKET –GLOBAL FORECAST TO 2021 © MarketsandMarkets 2.3 ASSUMPTIONS Note: Market values have been rounded off to the second decimal place. Due to this, there may be a slight difference in the actual total and the total mentioned in table. IMPACTSASSUMPTIONSPARAMETERS Stability in exchange rates will stabilize the prices of microscopes during imports and exports. It is assumed that dollar fluctuations will not affect the forecast to a significant extent. Exchange Rates This will lead to increasing growth opportunities for market players in the emerging Asia-Pacific and Latin American nations. Current government R&D spending patterns are assumed to be persistent in major countries across the four regions during the forecast period. Government R&D Spending Patterns The revenues of companies are of high importance for estimating the size of the parent market and its subsegments. Revenues of private companies acquired from paid databases were assumed to be in-line with actual company financials. Company Financials
  • 31.
    31 MICROSCOPY MARKET –GLOBAL FORECAST TO 2021 © MarketsandMarkets 3 EXECUTIVE SUMMARY Microscopes are analytical and scientific instruments used to view enlarged/magnified images of small objects. The process of investigation of small (or microscopic) objects with the help of microscopes is known as microscopy. The global microscopy market is technology driven, with a high degree of fragmentation and competition due to increasing research and innovation in the fields of life sciences and nanotechnology. The global microscopy market is expected to reach USD 6,726.5 million in 2021 from USD 4,685.4 million in 2016, at a CAGR of 7.5% from 2016 to 2021. Factors such as favorable government and private funding and rising focus on nanotechnology are driving growth of the microscopy market. In addition, technological advancements such as the introduction of digitalized microscopes and super-resolution techniques are supporting market growth. However, factors such as the high cost of advanced microscopes, implementation of excise tax by the U.S. government, and high custom duty charged on medical devices are restraining growth of this market. FIGURE 5 MICROSCOPY MARKET SNAPSHOT, 2016 VS. 2021 Source: Annual Reports, Press Releases, SEC Filings, Investor Presentations, Microscopy Society of America, Canadian Cytometry and Microscopy Association, Chinese Electron Microcopy Society, Australian Microscopy and Microanalysis Society, Journal of Microscopy, Journal of Advanced Microscopy Research, Expert Interviews, and MarketsandMarkets Analysis In this report, the global microscopy market is broadly segmented based on products, applications, and end users. On the basis of products, the microscopy market is segmented into four broad categories— optical microscopes, confocal microscopes, electron microscopes, and scanning probe microscopes (SPM). The optical microscopes segment is further divided into fluorescence microscopes (FM) and super- resolution microscopes. The confocal microscopes segment is sub segmented into multi-photon and confocal disk spinning microscopes. The electron microscopes segment is further categorized into transmission electron and SEM, while the SPM segment is further divided into STM, atomic force microscopes (AFM), and near-field scanning optical microscopes (NSOM). The electron microscopy segment is expected to account for the largest share of the microscopy products market in 2016. This large share can be attributed to growing demand for electron microscopes in semiconductors and electronics. USD 4,685.4 Million USD 6,726.5 Million - 1,000.0 2,000.0 3,000.0 4,000.0 5,000.0 6,000.0 7,000.0 8,000.0 2016 2021 MarketSize(USDMillion)
  • 32.
    32 MICROSCOPY MARKET –GLOBAL FORECAST TO 2021 © MarketsandMarkets 3.1 CURRENT SCENARIO The microscopy market is currently witnessing continuous technological advancement and product development. The global microscopy market is expected to reach USD 6,726.5 million in 2021 from USD 4,685.4 million in 2016, at a CAGR of 7.5% from 2016 to 2021. The key companies in this market include Nikon Corporation (Japan), Bruker Corporation (U.S.), Danaher Corporation (U.S.), Carl Zeiss AG (Germany), and FEI Co. (U.S.). 3.2 FUTURE OUTLOOK The overall microscopy market is expected to grow at a rate of 7.5% from 2016 to 2021. The integration of microscopes with spectroscopy, coupled with the use of super-resolution microscopes in the field of ophthalmology and brain mapping, offers lucrative growth opportunities for market participants. Furthermore, market growth will also be supported by rising development of advanced technologies, such as customized microscopes and the launch of compatible and user-friendly software applications. FIGURE 6 ELECTRON MICROSCOPES PRODUCT SEGMENT TO WITNESS THE FASTEST GROWTH DURING THE FORECAST PERIOD Source: Annual Reports, Press Releases, SEC Filings, Investor Presentations, Microscopy Society of America, Canadian Cytometry and Microscopy Association, Chinese Electron Microcopy Society, Australian Microscopy and Microanalysis Society, Journal of Microscopy, Journal of Advanced Microscopy Research, Expert Interviews, and MarketsandMarkets Analysis On the basis of products, the microscopy market is broadly classified into electron microscopes, optical microscopes, SPM, and confocal microscopes. In 2016, electron microscopes are expected to be the largest product segment of the microscopy market, due to their high resolution and magnification power. Electron microscopes are also expected to grow at the highest rate in the market due to their wide applications in semiconductors and electronics. Electron Microscopes Optical Microscopes Scanning Probe Microscopes Confocal Microscopes 2016 1,842.3 1,769.7 638.7 434.8 2021 3,049.8 2,252.0 826.7 598.0 CAGR 10.6% 4.9% 5.3% 6.6% 0 500 1,000 1,500 2,000 2,500 3,000 3,500 MarketSize(USDMillion)
  • 33.
    33 MICROSCOPY MARKET –GLOBAL FORECAST TO 2021 © MarketsandMarkets FIGURE 7 SEMICONDUCTORS TO ACCOUNT FOR THE LARGEST SHARE OF THE MICROSCOPY APPLICATIONS MARKET IN 2016 Source: Annual Reports, Press Releases, SEC Filings, Investor Presentations, Microscopy Society of America, Canadian Cytometry and Microscopy Association, Chinese Electron Microcopy Society, Australian Microscopy and Microanalysis Society, Journal of Microscopy, Journal of Advanced Microscopy Research, Expert Interviews, and MarketsandMarkets Analysis On the basis of application, the microscopy market is broadly classified into semiconductors, life sciences, material sciences, and nanotechnology. In 2016, semiconductors are expected to form the major application area of the microscopy market due to increasing use of advanced microscopes such as electron and SPM in research and development, routine inspection, and failure analysis. However, nanotechnology is the fastest-growing application segment for the microscopy market, owing to its wide array of applications and easy availability of funding. Semiconductors Life Sciences Material Sciences Nanotechnology 2016 1,644.2 1,604.8 894.9 541.5 2021 2,371.3 2,353.1 1,121.0 881.2 CAGR 7.6% 8.0% 4.6% 10.2% 0 500 1,000 1,500 2,000 2,500 MarketSize(USDMillion)
  • 34.
    34 MICROSCOPY MARKET –GLOBAL FORECAST TO 2021 © MarketsandMarkets FIGURE 8 ACADEMIC INSTITUTES WILL BEMAJOR END USERS OF THE MICROSCOPY MARKET *Note: Others include government research institutes and private laboratories Source: Annual Reports, Press Releases, SEC Filings, Investor Presentations, Microscopy Society of America, Canadian Cytometry and Microscopy Association, Chinese Electron Microcopy Society, Australian Microscopy and Microanalysis Society, Journal of Microscopy, Journal of Advanced Microscopy Research, Expert Interviews, and MarketsandMarkets Analysis Based on end users, the microscopy market is categorized into academic institutes, industries, and other end users, which include government research institutes and private laboratories. In 2016, the academic institutes segment is expected to be the fastest-growing end-user segment of the microscopy market, followed by industries. High growth rate of this segment is attributed to the availability of government and private funding to academic institutes, among other factors. Academic Institutes Industries Others* 2016 2,443.9 1,418.7 822.8 2021 3,758.1 1,958.8 1,009.7 CAGR 9.0% 6.7% 4.2% 0 500 1,000 1,500 2,000 2,500 3,000 3,500 4,000 MarketSize(USDMillion)
  • 35.
    35 MICROSCOPY MARKET –GLOBAL FORECAST TO 2021 © MarketsandMarkets FIGURE 9 GEOGRAPHICAL SNAPSHOT: NORTH AMERICA DOMINATED THE MICROSCOPY MARKET IN 2015 Source: Annual Reports, Press Releases, SEC Filings, Investor Presentations, Microscopy Society of America, Canadian Cytometry and Microscopy Association, Chinese Electron Microcopy Society, Australian Microscopy and Microanalysis Society, Journal of Microscopy, Journal of Advanced Microscopy Research, Expert Interviews, and MarketsandMarkets Analysis North America (comprising the U.S. and Canada) accounted for the largest share of 36.5% of the global microscopy market in 2015. Factors such as favorable funding scenario, rising focus on nanotechnology, and technological advancements are driving growth of this region. However, the implementation of excise tax by the U.S. government and a dearth of skilled labor are major factors likely to restrain growth of this market during the forecast period. Compared to mature markets, the Asia-Pacific region is expected to grow at the highest rate from 2016 to 2021. Growth in this region is propelled by factors such as improving research and development infrastructure, rising focus on the region by market companies, and increasing government initiatives. New product launches (82.03%), followed by agreements, collaborations, and partnerships (10.94%),was the major growth strategy adopted by key market companies in the market. Key industry companies in the global microscopy market are Bruker Corporation (U.S.), Carl Zeiss AG (Germany), FEI Co. (U.S.), Leica Microsystems (Germany), Nikon (Japan), and Olympus Corporation (Japan). 10.4% 6.9% REST OF THE WORLD 29.5% 7.4% EUROPE ASIA-PACIFIC 23.5% 9.8% 36.5% 6.0% NORTH AMERICA MarketShare (2015) CAGR (2016-2021)
  • 36.
    36 MICROSCOPY MARKET –GLOBAL FORECAST TO 2021 © MarketsandMarkets 3.3 CONCLUSION Majority of the leading companies in the microscopy market are focusing on product development and product enhancement. They are also focusing on expanding their distribution networks by pursuing inorganic growth strategies such as partnerships and collaborations. This enables them to cater to increasing demand of consumers and provide easy-to-operate and efficient microscopy products. Besides these, acquisition will prove to be an effective growth strategy for companies focusing on increasing their shares in the global microscopy market during the forecast period.
  • 37.
    37 MICROSCOPY MARKET –GLOBAL FORECAST TO 2021 © MarketsandMarkets 4 PREMIUM INSIGHTS 4.1 MICROSCOPY MARKET SNAPSHOT, 2016 VS 2021 FIGURE 10 TECHNOLOGICAL ADVANCEMENTS AND FAVORABLE GOVERNMENT FUNDING ARE IMPORTANT GROWTH DRIVERS Source: Annual Reports, Press Releases, SEC Filings, Investor Presentations, Microscopy Society of America, Canadian Cytometry and Microscopy Association, Chinese Electron Microcopy Society, Australian Microscopy and Microanalysis Society, Journal of Microscopy, Journal of Advanced Microscopy Research, Expert Interviews, and MarketsandMarkets Analysis USD 4,685.4 Million USD 6,726.5 Million  The global microscopy market is projected to reach USD 6,726.5 million by 2021, at a CAGR of 7.5% from 2016 to 2021  Market growth is attributed to the rising focus on nanotechnology; favorable government and corporate funding; and technological advancements such as high-throughput techniques, super-resolution, and digitalization in microscopy  Emerging economies such as India, China, Middle East, and Brazil offers significant market growth opportunities 2016 2021
  • 38.
    38 MICROSCOPY MARKET –GLOBAL FORECAST TO 2021 © MarketsandMarkets 4.2 MICROSCOPY MARKET, BY PRODUCT FIGURE 11 ELECTRON MICROSCOPES TO ACCOUNT FOR THE HIGHEST SHARE IN 2016 Source: Annual Reports, Press Releases, SEC Filings, Investor Presentations, Microscopy Society of America, Canadian Cytometry and Microscopy Association, Chinese Electron Microcopy Society, Australian Microscopy and Microanalysis Society, Journal of Microscopy, Journal of Advanced Microscopy Research, Expert Interviews, and MarketsandMarkets Analysis EUROPE NORTH AMERICA REST OF THE WORLD 13.6% 37.8% 39.3% 36.1% 29.5% 24.1% OPTICAL MICROSCOPES ELECTRON MICROSCOPES MICROSCOPY MARKET SHARE, BY PRODUCT (2016) MICROSCOPY MARKET SHARE, BY REGION (2016) SCANNING PROBE MICROSCOPES CONFOCAL MICROSCOPES ASIA-PACIFIC 9.3% 10.4%
  • 39.
    39 MICROSCOPY MARKET –GLOBAL FORECAST TO 2021 © MarketsandMarkets 4.3 MICROSCOPY MARKET, BY REGION FIGURE 12 ASIA-PACIFIC TO GROW AT THE HIGHEST RATE DURING THE FORECAST PERIOD Source: Annual Reports, Press Releases, SEC Filings, Investor Presentations, Microscopy Society of America, Canadian Cytometry and Microscopy Association, Chinese Electron Microcopy Society, Australian Microscopy and Microanalysis Society, Journal of Microscopy, Journal of Advanced Microscopy Research, Expert Interviews, and MarketsandMarkets Analysis 4.4 MICROSCOPY MARKET, BY APPLICATION FIGURE 13 SEMICONDUCTORS SEGMENT TO DOMINATE THE MICROSCOPY APPLICATIONS MARKET IN 2016 Source: Annual Reports, Press Releases, SEC Filings, Investor Presentations, Microscopy Society of America, Canadian Cytometry and Microscopy Association, Chinese Electron Microcopy Society, Australian Microscopy and Microanalysis Society, Journal of Microscopy, Journal of Advanced Microscopy Research, Expert Interviews, and MarketsandMarkets Analysis 7.4% 6.9% Rest of the World Europe >7% CAGR (High Growth) 17.7% 6%-7% CAGR ( Medium Growth) 9.8% Asia-Pacific 6.0% North America Semiconductors Life Sciences Material Sciences Nanotechnology 2016 1,644.2 1,604.8 894.9 541.5 2021 2,371.3 2,353.1 1,121.0 881.2 CAGR 7.6% 8.0% 4.6% 10.2% 0 500 1,000 1,500 2,000 2,500 MarketSize(USDMillion)
  • 40.
    40 MICROSCOPY MARKET –GLOBAL FORECAST TO 2021 © MarketsandMarkets 4.5 MICROSCOPY MARKET, BY END USER FIGURE 14 ACADEMIC INSTITUTES FORM MAJOR END USERS OF THE MICROSCOPY MARKET *Other end users include government research institutes and private laboratories. Source: Annual Reports, Press Releases, SEC Filings, Investor Presentations, Microscopy Society of America, Canadian Cytometry and Microscopy Association, Chinese Electron Microcopy Society, Australian Microscopy and Microanalysis Society, Journal of Microscopy, Journal of Advanced Microscopy Research, Expert Interviews, and MarketsandMarkets Analysis 4.6 LIFE CYCLE ANALYSIS, BY REGION FIGURE 15 ASIA-PACIFIC MARKET SHOWCASES LUCRATIVE GROWTH OPPORTUNITIES Source: Annual Reports, Press Releases, SEC Filings, Investor Presentations, Microscopy Society of America, Canadian Cytometry and Microscopy Association, Chinese Electron Microcopy Society, Australian Microscopy and Microanalysis Society, Journal of Microscopy, Journal of Advanced Microscopy Research, Expert Interviews, and MarketsandMarkets Analysis Academic Institutes Industries Other End Users* 2016 2,443.9 1,418.7 822.8 2021 3,758.1 1,958.8 1,009.7 CAGR 9.0% 6.7% 4.2% 0 500 1,000 1,500 2,000 2,500 3,000 3,500 4,000 MarketSize(USDMillion)GROWTH PHASE INTRODUCTION GROWTH MATURITY DECLINE RoW Asia-Pacific North America Europe
  • 41.
    41 MICROSCOPY MARKET –GLOBAL FORECAST TO 2021 © MarketsandMarkets 5 MARKET OVERVIEW KEY FINDINGS  Growing focus on nanotechnology, favorable government and corporate funding to support research activities, and technological advancements such as digitization of microscopes and super-resolution techniques are key factors driving growth of the global microscopy market  The high growth potential in emerging markets such as China, India, the Middle East, and Brazil, along with novel application areas, unfolds huge growth opportunities for companies in the microscopy market  High cost of advanced microscopes, implementation of excise tax by the U.S. government, and heavy custom duty charged on medical devices are key restraints to market growth  Time-consuming sample preparation and requirement of a high degree of technical expertise are key challenges to growth in this market
  • 42.
    42 MICROSCOPY MARKET –GLOBAL FORECAST TO 2021 © MarketsandMarkets 5.1 INTRODUCTION The global microscopy market is valued at USD 4,685.4 million in 2016 and is expected to reach USD 6,726.5 million by 2021, at a CAGR of 7.5% from 2016 to 2021. Microscopes are an integral part of scientific research, and therefore, remain one of the most widely-used instruments in life science, semiconductor, nanotechnology, and material science research. Market growth is expected to be driven by growing inclination toward nanotechnology, favorable funding to support research activities, and technological advancements. 5.2 MARKET DYNAMICS The global microscopy market exhibits lucrative growth potential with a CAGR of 7.5% during the forecast period. Growth of this market will be propelled by favorable funding and technology advancements such as digitization of microscopes and super-resolution techniques. High growth potential in emerging markets such as China, India, the Middle East, and Brazil, and novel application areas such as quantum dot, unfolds huge growth opportunities for companies in the microscopy market. However, heavy custom duty charged on medical devices, along with high costs of advanced microscopes, will hinder growth of this market to some extent. FIGURE 16 FAVORABLE GOVERNMENT AND CORPORATE FUNDING TO BOOST MARKET GROWTH Source: Secondary Literature, Expert Interviews, and MarketsandMarkets Analysis • Rising focus on nanotechnology • Favorable government and corporate funding for R&D • Technological advancements • High costs of advanced microscopes • Implementation of excise tax by the U.S. government • Heavy custom duty on medical devices • Emerging markets • Novel application areas • Integration of microscopy with spectroscopy • Time-consuming sample preparation process • Requirement of high degree of technical expertise DRIVERS RESTRAINTS OPPORTUNITIES CHALLENGES D R O C
  • 43.
    43 MICROSCOPY MARKET –GLOBAL FORECAST TO 2021 © MarketsandMarkets 5.2.1 DRIVERS 5.2.1.1 Rising focus on nanotechnology Nanotechnology is a multidisciplinary field that covers a vast and diverse array of applications. Investments in nanotechnology are rising owing to increased demand for advanced miniaturized systems and applications in various fields such as pharmaceuticals, biotechnology, chemical manufacturing, aerospace, electronics, and textiles. Nanomedicine is the application of nanotechnology in medicine and human healthcare. It focuses on the development of devices and chemical entities that can interact with the body at subcellular scales to achieve maximal therapeutic efficacy with minimal side effects. Nanotechnology is the fastest-growing application of microscopy. Currently, more than 250 small and established biotechnology and pharmaceutical companies are involved in nanomedicine research. In January 2005, the FDA approved Abraxane® (from Abraxis Bioscience, Inc. (U.S.)), a nanoparticle-albumin bound (nab) drug-delivery platform. This new class of nanotherapeutics is used for the treatment of metastatic breast cancer. The major applications of nanotechnology in the semiconductor industry include miniature transistor chips, quantum dot, optoelectronics, and carbon nanotubes (CNTs). Similarly, growing interest in nanocrystalline solids is an evolving trend in the material science sector. Also, the global focus on nanotechnology is rising due to the availability of funding for research and development in this segment. Since 2000, governments around the world have invested over USD 65 billion in nanotechnology research (source: cientifica). The U.S. government leads nanotechnology research and development funding. It has proposed a budget of USD 1.5 billion in the National Nanotechnology Initiative (NNI) funding for 2016. The rising focus on nanotechnology will thus boost the microscopy market growth during the forecast period. 5.2.1.2 Favorable government and corporate funding for research and development Increasing government and corporate funding is expected to drive the microscopy market. Globally, around USD 1.6 trillion are estimated to be invested in research and development in 2014, with the U.S., China, Japan, and Europe together accounting for nearly 78% (Source: Battelle). In April 2013, the Brain Research through Advancing Innovative Neurotechnologies (BRAIN) Initiative was launched by the U.S. government to assist neurological research. The initiative is projected to cost over USD 300 million per year for a period of ten years. Similarly, in 2013, the European Union initiated the Human Brain Project (HBP), a 10-year research project that will develop information and communication technology (ICT) platforms in six areas including neuroinformatics, brain simulation, high-performance computing, medical informatics, neuromorphic computing, and neurorobotics. In addition, the government of Germany granted USD 36 million to boost universities and other research institutions in June 2009. Favorable government funding to support research is expected to propel growth of the microscopy market in the near future.
  • 44.
    44 MICROSCOPY MARKET –GLOBAL FORECAST TO 2021 © MarketsandMarkets 5.2.1.3 Technological advancements Technological advancements serve to reduce product and test costs. Advancements in microscopy techniques such as digitization, live-cell imaging, super resolution, and high-throughput methods are generating interest among academic institutes, research laboratories, and pharmaceutical and biotechnology companies. Miniaturization of devices allows easy installation of these devices in small laboratories, thereby overcoming space constraints. Furthermore, most end users are interested in instruments that offer better reproducibility of results, higher ease of operation, wider application profiles, and higher throughput. This has prompted a high degree of research into microscopes. Over 90 new products have been launched in this market between 2013 and 2016. Some key product launches are listed below.  In May 2016, Carl Zeiss introduced ZEISS LSM 880 with Airyscan detector for confocal laser scanning microscopes. This upgrade enables improved signal-to-noise ratio, a four-fold increase in imaging speed, and 1.5x resolution improvement.  In May 2016, FEI introduced Apreo, a scanning electron microscope (SEM). The product utilizes the proprietary compound final lens design that allows improvement in resolution and backscatter detection at the lowest beam current. Developments in labeling technologies have enabled real-time 3D imaging of living cells, which is of great use in cytology studies. For instance, advances in confocal and multiphoton microscopy have enabled the development of genetically-coded fluorescent proteins and enhanced imaging. Such technologies are driving growth of the microscopy market in life sciences. Companies such as Olympus and Nikon have implemented novel fluorescent technologies such as fluorescence recovery after photobleaching (FRAP) and fluorescence loss in photobleaching (FLIP) in their products. Digitization of microscopes is a key trend in the market with conventional microscopes increasingly being replaced by integrated digital image analysis systems. Digital imaging offers enhanced image resolution with greater precision, leading to lesser distorted images and allowing better viewing of samples. Emerging advanced software tools for imaging/analysis as well as transfer of images across local-area and wide-area network in microscopy are fueling market growth. Nikon’s Coolscape digital microscope allows better illumination, digital image capture, and local area/wide area communication capabilities. 5.2.2 RESTRAINTS 5.2.2.1 High cost of advanced microscopes Owing to technological advancements, there has been a paradigm shift in the usage pattern of microscopes. Optical microscopes are gradually losing their market to high-end microscopes such as electron microscopes and SPM due to features including higher resolution and magnification power that advanced microscopes offer. However, these microscopes cost between USD 250,000 and USD 2 million, which is a major factor limiting their adoption. In addition to this, recurrent expenses in the form of maintenance of these microscopes may result in an annual operational cost of an electron microscope of up to USD 100,000. This high cost has resulted in dependence of users on government and private research funding. Thus, high costs of advanced microscopes are expected to restraint growth of the microscopy market during the forecast period.
  • 45.
    45 MICROSCOPY MARKET –GLOBAL FORECAST TO 2021 © MarketsandMarkets 5.2.2.2 Implementation of excise tax by the U.S. government Under the Patient Protection and Affordable Care Act (PPACA), the U.S. government imposed an excise tax of 2.3% on Class I, II, and III medical devices, from January 2013. This tax is applicable to medical devices manufactured or imported in the U.S. Due to this, the market for some automated medical devices including medical robots, defibrillators, and medical imaging equipment (such as microscopes) will be affected in the U.S. This tax will result in lower profits for manufacturers as well as lower reimbursement from payers for procedures in which these devices are used. This may hinder growth of the U.S. market. As the U.S. accounts for a major share of the global microscopy market, this is expected to affect the market on a global level. 5.2.2.3 Heavy custom duty on medical devices Customs duty is a type of indirect tax levied on goods imported into as well as on goods exported from a country. For instance, in India, although the government provides an exemption of custom duty to academic institutes, manufacturers and suppliers of microscopy instruments and accessories are mandated to pay a heavy custom duty of nearly 28%. This increases the cost of the product manifold. Similarly, growth of the microscopy market in Brazil is also restricted by huge custom duty charges. 5.2.3 OPPORTUNITIES 5.2.3.1 Emerging markets China, India, Brazil, and the Middle East are emerging markets for microscopy; markets in these geographies are in the growth stage. These markets lack proper standards and government regulations, thus offering huge potential for providers unable to meet U.S. standards. China is a high potential market for microscopy due to easy availability of funding to support research, presence of skilled workforce, and availability of early stage capital to ensure effective technology transfer. Hence, it is estimated that China will soon surpass the U.S. in nanotechnology spending. India, Brazil, and the Middle East are the new revenue pockets for the market participants due to growing research and development initiatives and academic excellence. Also, easy availability of funding is a key driving factor. For instance, in 2010, the King Abdulla University of Science and Technology (KAUST) in Saudi Arabia announced a research grant of USD 10 million to support research in nanotechnology. 5.2.3.2 New application areas such as quantum dots and optogenetics Quantum dots are nanocrystalline semiconductor material composed of a cadmium selenide (CdSe) core surrounded by a zinc sulfide (ZnS) shell, capable of emitting fluorescence. They are increasingly becoming popular as cellular probes for optical and electron microscopy as they provide better sensitivity and a 1,000 times brighter and higher resolution 3D imaging as compared to conventional fluorophore technology. Currently, modular systems from leading companies such as Nikon, Olympus, and Carl Zeiss support this technology. Optogenetics is a neuromodulation technique that uses light as a stimulus to control and monitor the activities of individual neurons in a living tissue. A recent application of optogenetics in combination with microscopy is in research on layers of cultivated excitable cells to understand the general biology of action potential generation, axonal signal transmission, and synaptic activities. In October 2011, the National Institutes of Health (NIH) allocated a research grant of USD 12.5 million to the University of Pennsylvania to support medical research in optogenetics, microscopy, and fluorescent probes for tumor detection.
  • 46.
    46 MICROSCOPY MARKET –GLOBAL FORECAST TO 2021 © MarketsandMarkets 5.2.3.3 Integration of microscopy with spectroscopy The integration of microscopy with spectroscopy presents wide opportunities to research communities as it can be used for a variety of applications; for instance, it can be used to analyze nanowires in nanotechnology, investigations of local inhomogeneity in material sciences, and cellular imaging and tracking experiments in biological research. In late 2013, researchers in the U.S. developed a new imaging technique by combining the spatial resolution of scanning tunneling microscopy (STM) with vibrational information obtained from infrared (IR) spectroscopy. This technique can simultaneously image and obtain the IR spectrum of molecules adhered to a surface. Detection and identification of molecules on a surface and understanding their interaction with each other and the surface is important for altering surface properties and creating new nanostructures. Some commonly used combinations include atomic force microscopy (AFM) with Raman spectroscopy, and scanning electron microscopy (SEM) with Raman spectroscopy. 5.2.4 CHALLENGES 5.2.4.1 Sample preparation Tedious sample preparation is a major drawback associated with electron microscopes. Sample preparation for electron microscopes usually consists of specimen killing, fixation, dehydration, drying, mounting, and coating. The samples for both SEM and transmission electron microscopes undergo complex preparation steps to withstand the hostile environment (temperature of up to 150°C and high vacuum) inside the microscope. The preparation process kills the tissue/cell and can also cause changes in the sample’s appearance. Further, extensive work is required to produce a sample thin enough to be electron transparent. Thus, time-consuming sample preparation for high-end microscopes is a key challenge. 5.2.4.2 Requirement of a high degree of technical expertise Highly skilled personnel are required to handle advanced microscopes such as electron and SPM. The complexity of the instrumentation affects their significant adoption, thus restraining market growth. Thus, the dearth of skilled labor and complexity of the instrumentation may challenge growth of this market.
  • 47.
    47 MICROSCOPY MARKET –GLOBAL FORECAST TO 2021 © MarketsandMarkets 6 MICROSCOPY MARKET, BY PRODUCT KEY FINDINGS  The electron microscopes segment accounted for the largest share of 39.3% of the market in 2016  The low cost and user-friendliness of electron microscopes are key factors responsible for the large share of this segment  The optical microscopes segment accounted for the second-largest share of 37.8% of the microscopy market in 2016  The SPM segment accounted for 13.6% share of the microscopy market in 2016  The confocal microscopes segment accounted for 9.3% share of the microscopy market in 2016
  • 48.
    48 MICROSCOPY MARKET –GLOBAL FORECAST TO 2021 © MarketsandMarkets 6.1 INTRODUCTION The microscopy market, by product, is segmented into optical microscopes, confocal microscopes, electron microscopes, and SPM. The electron microscopes segment is expected to account for the largest share of 39.3% of the microscopy market in 2016. This segment is also expected to grow at the highest CAGR of 10.6% in the products market, over the forecast period. FIGURE 17 ELECTRON MICROSCOPES SEGMENT TO ACCOUNT FOR THE LARGEST SHARE OF THE MICROSCOPY MARKET, BY PRODUCT, IN 2016 Source: Annual Reports, Press Releases, SEC Filings, Investor Presentations, Microscopy Society of America, Canadian Cytometry and Microscopy Association, Chinese Electron Microcopy Society, Australian Microscopy and Microanalysis Society, Journal of Microscopy, Journal of Advanced Microscopy Research, Expert Interviews, and MarketsandMarkets Analysis TABLE 1 GLOBAL MICROSCOPY MARKET SIZE, BY PRODUCT, 2014–2021 (USD MILLION) Product 2014 2015 2016 2021 CAGR (2016–2021) Optical Microscopes 1,606.0 1,684.6 1,769.7 2,252.0 4.9% Electron Microscopes 1,508.4 1,665.8 1,842.3 3,049.8 10.6% SPM 573.3 604.5 638.7 826.7 5.3% Confocal Microscopes 378.1 403.6 434.8 598.0 6.6% Total 4,065.8 4,358.5 4,685.4 6,726.5 7.5% Source: Annual Reports, Press Releases, SEC Filings, Investor Presentations, Microscopy Society of America, Canadian Cytometry and Microscopy Association, Chinese Electron Microcopy Society, Australian Microscopy and Microanalysis Society, Journal of Microscopy, Journal of Advanced Microscopy Research, Expert Interviews, and MarketsandMarkets Analysis The electron microscopes segment is expected to register the highest CAGR of 10.6% from 2016 to 2021. This high growth of this segment can be attributed to growing demand for electron microscopes in various industries such as semiconductors and electronics. Electron Microscopes Optical Microscopes Scanning Probe Microscopes Confocal Microscopes 2016 1,842.3 1,769.7 638.7 434.8 2021 3,049.8 2,252.0 826.7 598.0 CAGR 10.6% 4.9% 5.3% 6.6% 0 500 1,000 1,500 2,000 2,500 3,000 3,500 MarketSize(USDMillion)
  • 49.
    49 MICROSCOPY MARKET –GLOBAL FORECAST TO 2021 © MarketsandMarkets 6.2 ELECTRON MICROSCOPES Electron microscopes use a beam of charged particles (electrons) and electromagnetic or electrostatic lenses to view small objects. Electron microscopes have very high magnification power, of nearly 1,000,000x. Due to their high magnification ratio, electron microscopes have vital applications in nanotechnology research. Growing research and development activities and the easy availability of funds are expected to drive growth of the electron microscopes market. However, the high cost of electron microscopes is a key factor restraining growth of this market. The major companies operating in the electron microscopes market include FEI Co. (U.S.), Hitachi High Technologies (Japan), and JEOL Ltd. (Japan). FIGURE 18 SEM TO ACCOUNT FOR THE LARGEST SHARE OF THE ELECTRON MICROSCOPES MARKET IN 2016 Source: Annual Reports, Press Releases, SEC Filings, Investor Presentations, Microscopy Society of America, Canadian Cytometry and Microscopy Association, Chinese Electron Microcopy Society, Australian Microscopy and Microanalysis Society, Journal of Microscopy, Journal of Advanced Microscopy Research, Expert Interviews, and MarketsandMarkets Analysis TABLE 2 ELECTRON MICROSCOPES MARKET SIZE, BY TYPE, 2014-2021 (USD MILLION) Type 2014 2015 2016 2021 CAGR (2016–2021) SEM 1,178.1 1,302.7 1,442.5 2,403.2 10.7% Transmission Electron Microscopes 330.3 363.1 399.8 646.6 10.1% Total 1,508.4 1,665.8 1,842.3 3,049.8 10.6% Source: Annual Reports, Press Releases, SEC Filings, Investor Presentations, Microscopy Society of America, Canadian Cytometry and Microscopy Association, Chinese Electron Microcopy Society, Australian Microscopy and Microanalysis Society, Journal of Microscopy, Journal of Advanced Microscopy Research, Expert Interviews, and MarketsandMarkets Analysis In 2016, the SEM segment is expected to account for the largest share of 78.3% of the global electron microscopes market. This segment is projected to reach USD 2,403.2 million by 2021 from USD 1,442.5 million in 2016, at a CAGR of 10.7% during the forecast period. Scanning Electron Microscopes Transmission Electron Microscopes 2016 1,442.5 399.8 2021 2,403.2 646.6 CAGR 10.7% 10.1% 0 500 1,000 1,500 2,000 2,500 3,000 MarketSize(USDMillion)
  • 50.
    50 MICROSCOPY MARKET –GLOBAL FORECAST TO 2021 © MarketsandMarkets TABLE 3 ELECTRON MICROSCOPES MARKET SIZE, BY REGION, 2014-2021 (USD MILLION) Region 2014 2015 2016 2021 CAGR (2016–2021) North America 558.1 608.4 664.1 1,027.0 9.1% Europe 445.0 491.3 542.9 896.5 10.6% Asia-Pacific 346.9 392.1 443.8 817.8 13.0% RoW 158.4 174.1 191.4 308.5 10.0% Total 1,508.4 1,665.8 1,842.3 3,049.8 10.6% Source: Annual Reports, Press Releases, SEC Filings, Investor Presentations, Microscopy Society of America, Canadian Cytometry and Microscopy Association, Chinese Electron Microcopy Society, Australian Microscopy and Microanalysis Society, Journal of Microscopy, Journal of Advanced Microscopy Research, Expert Interviews, and MarketsandMarkets Analysis North America is expected to account for the largest share of the global electron microscopes market in 2016. This segment is projected to reach USD 1,027.0 million by 2021 from USD 664.1 million in 2016, at a CAGR of 9.1% from 2016 to 2021. TABLE 4 NORTH AMERICA: ELECTRON MICROSCOPES MARKET SIZE, BY COUNTRY, 2014–2021 (USD MILLION) Country 2014 2015 2016 2021 CAGR (2016–2021) U.S. 449.3 490.1 535.4 831.0 9.2% Canada 108.8 118.3 128.7 195.9 8.8% Total 558.1 608.4 664.1 1,027.0 9.1% Source: Annual Reports, Press Releases, SEC Filings, Investor Presentations, Microscopy Society of America, Canadian Cytometry and Microscopy Association, Chinese Electron Microcopy Society, Australian Microscopy and Microanalysis Society, Journal of Microscopy, Journal of Advanced Microscopy Research, Expert Interviews, and MarketsandMarkets Analysis The U.S. is expected to account for the largest share of the North American electron microscopes market in 2016. This segment is projected to reach USD 831.0 million by 2021 from USD 535.4 million in 2016, at a CAGR of 9.2% from 2016 to 2021.
  • 51.
    51 MICROSCOPY MARKET –GLOBAL FORECAST TO 2021 © MarketsandMarkets TABLE 5 EUROPE: ELECTRON MICROSCOPES MARKET SIZE, BY COUNTRY/REGION, 2014–2021 (USD MILLION) Country/Region 2014 2015 2016 2021 CAGR (2016–2021) Germany 118.0 134.0 152.0 285.2 13.4% U.K. 64.7 72.7 81.8 147.6 12.5% France 45.5 50.6 56.4 97.1 11.5% RoE 216.9 234.0 252.7 366.6 7.7% Total 445.0 491.3 542.9 896.5 10.6% Source: Annual Reports, Press Releases, SEC Filings, Investor Presentations, Microscopy Society of America, Canadian Cytometry and Microscopy Association, Chinese Electron Microcopy Society, Australian Microscopy and Microanalysis Society, Journal of Microscopy, Journal of Advanced Microscopy Research, Expert Interviews, and MarketsandMarkets Analysis Germany is expected to account for the largest share of the Europe electron microscopes market in 2016. This segment is projected to reach USD 285.2 million by 2021 from USD 152.0 million in 2016, at a CAGR of 13.4% from 2016 to 2021. TABLE 6 ROW: ELECTRON MICROSCOPES MARKET SIZE, BY COUNTRY/REGION, 2014–2021 (USD MILLION) Country/Region 2014 2015 2016 2021 CAGR (2016–2021) Brazil 66.2 73.0 80.5 131.7 10.3% Mexico 39.9 43.3 46.9 70.3 8.4% Argentina 15.0 16.7 18.6 31.4 11.1% RoLA 37.2 41.1 45.4 75.1 10.6% Total 158.4 174.1 191.4 308.5 10.0% Source: Annual Reports, Press Releases, SEC Filings, Investor Presentations, Microscopy Society of America, Canadian Cytometry and Microscopy Association, Chinese Electron Microcopy Society, Australian Microscopy and Microanalysis Society, Journal of Microscopy, Journal of Advanced Microscopy Research, Expert Interviews, and MarketsandMarkets Analysis Brazil is expected to account for the largest share of the RoW electron microscopes market in 2016. This segment is projected to reach USD 131.7 million by 2021 from USD 80.5 million in 2016, at a CAGR of 10.3% from 2016 to 2021.
  • 52.
    52 MICROSCOPY MARKET –GLOBAL FORECAST TO 2021 © MarketsandMarkets 6.2.1 TRANSMISSION ELECTRON MICROSCOPES (TEM) Transmission electron microscopy uses high-voltage electron beams to create an image of the specimen. TEMs are widely used in material science studies across the semiconductors and metallurgy industry. They are also used in the life science industries to study the underlying fundamental cell biological processes as well as the pathological and physiological pathways, and to perform pharmaceutical quality control tests for new medications. The high cost of acquisition, maintenance requirements, and time-consuming sample preparation process hinder growth of this market. The major drawbacks of the TEM technique include extensive sample preparation, hostile environment for the sample, and a small field of view. TABLE 7 TRANSMISSION ELECTRON MICROSCOPES MARKET SIZE, BY REGION, 2014-2021 (USD MILLION) Region 2014 2015 2016 2021 CAGR (2016–2021) North America 122.2 132.6 144.1 217.7 8.6% Europe 97.5 107.1 117.8 190.1 10.0% Asia-Pacific 76.0 85.5 96.3 173.4 12.5% RoW 34.7 37.9 41.5 65.4 9.5% Total 330.3 363.1 399.8 646.6 10.1% Source: Annual Reports, Press Releases, SEC Filings, Investor Presentations, Microscopy Society of America, Canadian Cytometry and Microscopy Association, Chinese Electron Microcopy Society, Australian Microscopy and Microanalysis Society, Journal of Microscopy, Journal of Advanced Microscopy Research, Expert Interviews, and MarketsandMarkets Analysis North America is expected to account for the largest share of the transmission electron microscopes market in 2016. This segment is projected to reach USD 217.7 million by 2021 from USD 144.1 million in 2016, at a CAGR of 8.6% from 2016 to 2021. TABLE 8 ROW: TRANSMISSION ELECTRON MICROSCOPES MARKET SIZE, BY COUNTRY/REGION, 2014–2021 (USD MILLION) Country/Region 2014 2015 2016 2021 CAGR (2016–2021) Brazil 14.5 15.9 17.5 27.9 9.8% Mexico 8.7 9.4 10.2 14.9 7.9% Argentina 3.3 3.6 4.0 6.7 10.6% RoLA 8.2 9.0 9.9 15.9 10.1% Total 34.7 37.9 41.5 65.4 9.5% Source: Annual Reports, Press Releases, SEC Filings, Investor Presentations, Microscopy Society of America, Canadian Cytometry and Microscopy Association, Chinese Electron Microcopy Society, Australian Microscopy and Microanalysis Society, Journal of Microscopy, Journal of Advanced Microscopy Research, Expert Interviews, and MarketsandMarkets Analysis Brazil is expected to account for the largest share of the RoW transmission electron microscopes market in 2016. This segment is projected to reach USD 27.9 million by 2021 from USD 17.5 million in 2016, at a CAGR of 9.8% from 2016 to 2021.
  • 53.
    53 MICROSCOPY MARKET –GLOBAL FORECAST TO 2021 © MarketsandMarkets 6.2.2 SCANNING ELECTRON MICROSCOPES (SEM) A Scanning Electron Microscope (SEM) produces images of an object by scanning it with a focused beam of electrons. SEMs are primarily used for qualitative analysis of size, shape, morphology, porosity, size distribution, and consistency of sample. These characteristics have vital applications in the life sciences sector for the analysis and quality control of powdered dosage forms for assessment of crystalline structure, dissolution behavior, and bioavailability of drug molecules. Technological advancements in the SEM market focus on the development of advanced microscopy systems with specialized sample-handling capabilities to enable the analysis of living cells through non-destructive microscopy. The market for SEM instruments is expected to be driven by increasing demand for customized solutions and integrated systems to satisfy the specific needs of research organizations, which are major end users of the microscopy market. TABLE 9 SEM MARKET SIZE, BY REGION, 2014-2021 (USD MILLION) Region 2014 2015 2016 2021 CAGR (2016–2021) North America 435.9 475.7 520.0 809.2 9.2% Europe 347.5 384.2 425.1 706.5 10.7% Asia-Pacific 271.0 306.7 347.5 644.4 13.1% RoW 123.7 136.1 149.9 243.1 10.2% Total 1,178.1 1,302.7 1,442.5 2,403.2 10.7% Source: Annual Reports, Press Releases, SEC Filings, Investor Presentations, Microscopy Society of America, Canadian Cytometry and Microscopy Association, Chinese Electron Microcopy Society, Australian Microscopy and Microanalysis Society, Journal of Microscopy, Journal of Advanced Microscopy Research, Expert Interviews, and MarketsandMarkets Analysis North America is expected to account for the largest share of the SEM market in 2016. This segment is projected to reach USD 809.2 million by 2021 from USD 520.0 million in 2016, at a CAGR of 9.2% from 2016 to 2021. TABLE 10 ROW: SEM MARKET SIZE, BY COUNTRY/REGION, 2014-2021 (USD MILLION) Country/Region 2014 2015 2016 2021 CAGR (2016–2021) Brazil 51.7 57.1 63.0 103.7 10.5% Mexico 31.2 33.8 36.7 55.4 8.6% Argentina 11.8 13.1 14.5 24.8 11.3% RoLA 29.1 32.2 35.6 59.2 10.7% Total 123.7 136.1 149.9 243.1 10.2% Source: Annual Reports, Press Releases, SEC Filings, Investor Presentations, Microscopy Society of America, Canadian Cytometry and Microscopy Association, Chinese Electron Microcopy Society, Australian Microscopy and Microanalysis Society, Journal of Microscopy, Journal of Advanced Microscopy Research, Expert Interviews, and MarketsandMarkets Analysis Brazil is expected to account for the largest share of the RoW SEM market in 2016. This segment is projected to reach USD 103.7 million by 2021 from USD 63.0 million in 2016, at a CAGR of 10.5% from 2016 to 2021.
  • 54.
    54 MICROSCOPY MARKET –GLOBAL FORECAST TO 2021 © MarketsandMarkets 6.3 OPTICAL MICROSCOPES Optical microscopes, also called light microscopes, use visible light along with a system of lenses to provide enlarged images of small samples such as cells, molecules, and microorganisms. The magnification power of these microscopes is up to 1,000x. Continuous improvements in electronics and technology, including the incorporation of a digital camera that enhances image quality, have further improved the magnifying power of optical microscopes. Optical microscopes are less expensive as compared to advanced microscopes, and thus hold the highest share in the overall market. Due to the presence of a large number of companies, pricing is used as a tool to maintain product differentiation in the optical microscopes market. Their low cost, ease of use, and low maintenance costs are major drivers for this segment. These microscopes make direct imaging possible without any sample pre-treatment. They are also used in real-color imaging. Optical microscopes are widely used in academic institutions and in small-scale research institutes and pathology laboratories. Low resolution is the major drawback of optical microscopes. Optical microscopes find application in medical diagnosis (histopathology), microelectronics, nanophysics, biotechnology, pharmaceutical research, mineralogy, and microbiology. Carl Zeiss (Germany), Leica Microsystems (Germany), Nikon (Japan), and Olympus Corporation (Japan) are some major companies operating in this market. FIGURE 19 FLUORESCENCE MICROSCOPES TO DOMINATE THE OPTICAL MICROSCOPES MARKET DURING THE FORECAST PERIOD Source: Annual Reports, Press Releases, SEC Filings, Investor Presentations, Microscopy Society of America, Canadian Cytometry and Microscopy Association, Chinese Electron Microcopy Society, Australian Microscopy and Microanalysis Society, Journal of Microscopy, Journal of Advanced Microscopy Research, Expert Interviews, and MarketsandMarkets Analysis Fluorescence Microscopes Super-resolution Microscopes 2016 1,262.3 507.4 2021 1,413.2 838.9 CAGR 2.3% 10.6% 0 200 400 600 800 1,000 1,200 1,400 1,600 MarketSize(USDMillion)
  • 55.
    55 MICROSCOPY MARKET –GLOBAL FORECAST TO 2021 © MarketsandMarkets TABLE 11 OPTICAL MICROSCOPES MARKET SIZE, BY TYPE, 2014-2021 (USD MILLION) Type 2014 2015 2016 2021 CAGR (2016–2021) Fluorescence Microscopes 1,196.5 1,227.2 1,262.3 1,413.2 2.3% Super-resolution Microscopes 409.5 457.4 507.4 838.9 10.6% Total 1,606.0 1,684.6 1,769.7 2,252.0 4.9% Source: Annual Reports, Press Releases, SEC Filings, Investor Presentations, Microscopy Society of America, Canadian Cytometry and Microscopy Association, Chinese Electron Microcopy Society, Australian Microscopy and Microanalysis Society, Journal of Microscopy, Journal of Advanced Microscopy Research, Expert Interviews, and MarketsandMarkets Analysis In 2016, the fluorescence microscopes segment is expected to account for the larger share of 71.3% of the global optical microscopes market. This segment is projected to reach USD 1,413.2 million by 2021 from USD 1,262.3 million in 2016, at a CAGR of 2.3% during the forecast period. FIGURE 20 ASIA-PACIFIC TO WITNESS HIGHEST GROWTH IN THE OPTICAL MICROSCOPES MARKET DURING THE FORECAST PERIOD Source: Annual Reports, Press Releases, SEC Filings, Investor Presentations, Microscopy Society of America, Canadian Cytometry and Microscopy Association, Chinese Electron Microcopy Society, Australian Microscopy and Microanalysis Society, Journal of Microscopy, Journal of Advanced Microscopy Research, Expert Interviews, and MarketsandMarkets Analysis North America Europe Asia-Pacific RoW 2016 638.0 521.5 426.3 183.9 2021 758.3 662.0 603.8 227.8 CAGR 3.5% 4.9% 7.2% 4.4% 0 100 200 300 400 500 600 700 800 MarketSize(USDMillion)
  • 56.
    56 MICROSCOPY MARKET –GLOBAL FORECAST TO 2021 © MarketsandMarkets TABLE 12 OPTICAL MICROSCOPES MARKET SIZE, BY REGION, 2014-2021 (USD MILLION) Region 2014 2015 2016 2021 CAGR (2016–2021) North America 594.2 615.2 638.0 758.3 3.5% Europe 473.8 496.8 521.5 662.0 4.9% Asia-Pacific 369.4 396.5 426.3 603.8 7.2% RoW 168.6 176.0 183.9 227.8 4.4% Total 1,606.0 1,684.6 1,769.7 2,252.0 4.9% Source: Annual Reports, Press Releases, SEC Filings, Investor Presentations, Microscopy Society of America, Canadian Cytometry and Microscopy Association, Chinese Electron Microcopy Society, Australian Microscopy and Microanalysis Society, Journal of Microscopy, Journal of Advanced Microscopy Research, Expert Interviews, and MarketsandMarkets Analysis North America is expected to account for the largest share of the global optical microscopes market in 2016. This regional segment is projected to reach USD 758.3 million by 2021 from USD 638.0 million in 2016, at a CAGR of 3.5% from 2016 to 2021. TABLE 13 NORTH AMERICA: OPTICAL MICROSCOPES MARKET SIZE, BY COUNTRY, 2014–2021 (USD MILLION) Country 2014 2015 2016 2021 CAGR (2016–2021) U.S. 478.3 495.6 514.3 613.7 3.6% Canada 115.9 119.6 123.6 144.7 3.2% Total 594.2 615.2 638.0 758.3 3.5% Source: Annual Reports, Press Releases, SEC Filings, Investor Presentations, Microscopy Society of America, Canadian Cytometry and Microscopy Association, Chinese Electron Microcopy Society, Australian Microscopy and Microanalysis Society, Journal of Microscopy, Journal of Advanced Microscopy Research, Expert Interviews, and MarketsandMarkets Analysis The U.S. is expected to account for the larger share of the North American optical microscopes market in 2016. This segment is projected to reach USD 613.7 million by 2021 from USD 514.3 million in 2016, at a CAGR of 3.6% from 2016 to 2021.
  • 57.
    57 MICROSCOPY MARKET –GLOBAL FORECAST TO 2021 © MarketsandMarkets TABLE 14 EUROPE: OPTICAL MICROSCOPES MARKET SIZE, BY COUNTRY/REGION, 2014–2021 (USD MILLION) Country/Region 2014 2015 2016 2021 CAGR (2016–2021) Germany 125.6 135.5 146.0 210.6 7.6% U.K. 68.8 73.5 78.6 109.0 6.8% France 48.4 51.1 54.1 71.7 5.8% RoE 230.9 236.6 242.8 270.7 2.2% Total 473.8 496.8 521.5 662.0 4.9% Source: Annual Reports, Press Releases, SEC Filings, Investor Presentations, Microscopy Society of America, Canadian Cytometry and Microscopy Association, Chinese Electron Microcopy Society, Australian Microscopy and Microanalysis Society, Journal of Microscopy, Journal of Advanced Microscopy Research, Expert Interviews, and MarketsandMarkets Analysis Germany is expected to account for the largest share of the European optical microscopes market in 2016. This regional segment is projected to reach USD 210.6 million by 2021 from USD 146.0 million in 2016, at the highest CAGR of 7.6% from 2016 to 2021. TABLE 15 ROW: OPTICAL MICROSCOPES MARKET SIZE, BY COUNTRY/REGION, 2014–2021 (USD MILLION) Country/Region 2014 2015 2016 2021 CAGR (2016–2021) Brazil 70.5 73.8 77.3 97.2 4.7% Mexico 42.5 43.7 45.1 51.9 2.9% Argentina 16.0 16.9 17.8 23.2 5.4% RoLA 39.6 41.6 43.7 55.5 4.9% Total 168.6 176.0 183.9 227.8 4.4% Source: Annual Reports, Press Releases, SEC Filings, Investor Presentations, Microscopy Society of America, Canadian Cytometry and Microscopy Association, Chinese Electron Microcopy Society, Australian Microscopy and Microanalysis Society, Journal of Microscopy, Journal of Advanced Microscopy Research, Expert Interviews, and MarketsandMarkets Analysis Brazil is expected to account for the largest share of the RoW optical microscopes market in 2016. The country is projected to reach USD 97.2 million by 2021 from USD 77.3 million in 2016, at a CAGR of 4.7% from 2016 to 2021.
  • 58.
    58 MICROSCOPY MARKET –GLOBAL FORECAST TO 2021 © MarketsandMarkets 6.3.1 FLUORESCENCE MICROSCOPES Fluorescence microscopes are a type of optical microscopes that utilize fluorophore molecules for imaging. Applications of this product segment are rapidly expanding in medical and biological research owing to significant advances in technology that have enabled single- and multicolor-fluorescence microscopy. Fluorescence microscopy also has immense applications in life sciences, such as nerve specimen analysis, DNA & chromosomal studies, and routine diagnosis of infections such as Herpes Zoster or Chlamydia. It is also used in research related to nanostructures and cancer cells. Advances in fluorescent microscopy such as total internal reflection fluorescence microscopes (TIRF), fluorescence recovery after photobleaching (FRAP), and fluorescence-lifetime imaging microscopy (FLIM), are used as upgradation tools by market participants for their existing line of microscopes. However, tedious sample preparation and photobleaching processes are the major limitations of fluorescence microscopy. TABLE 16 FLUORESCENCE MICROSCOPES MARKET SIZE, BY REGION, 2014–2021 (USD MILLION) Region 2014 2015 2016 2021 CAGR (2016–2021) North America 442.7 448.2 455.1 475.9 0.9% Europe 353.0 361.9 372.0 415.4 2.2% Asia-Pacific 275.2 288.9 304.1 378.9 4.5% RoW 125.6 128.2 131.2 143.0 1.7% Total 1,196.5 1,227.2 1,262.3 1,413.2 2.3% Source: Annual Reports, Press Releases, SEC Filings, Investor Presentations, Microscopy Society of America, Canadian Cytometry and Microscopy Association, Chinese Electron Microcopy Society, Australian Microscopy and Microanalysis Society, Journal of Microscopy, Journal of Advanced Microscopy Research, Expert Interviews, and MarketsandMarkets Analysis North America is expected to account for the largest share of the fluorescence microscopes market in 2016. This region is projected to reach USD 475.9 million by 2021 from USD 455.1 million in 2016, at a CAGR of 0.9% from 2016 to 2021. TABLE 17 ROW: FLUORESCENCE MICROSCOPES MARKET SIZE, BY COUNTRY/REGION, 2014–2021 (USD MILLION) Country/Region 2014 2015 2016 2021 CAGR (2016–2021) Brazil 52.5 53.8 55.2 61.0 2.0% Mexico 31.7 31.9 32.1 32.6 0.3% Argentina 11.9 12.3 12.7 14.6 2.7% RoLA 29.5 30.3 31.1 34.8 2.3% Total 125.6 128.2 131.2 143.0 1.7% Source: Annual Reports, Press Releases, SEC Filings, Investor Presentations, Microscopy Society of America, Canadian Cytometry and Microscopy Association, Chinese Electron Microcopy Society, Australian Microscopy and Microanalysis Society, Journal of Microscopy, Journal of Advanced Microscopy Research, Expert Interviews, and MarketsandMarkets Analysis Brazil is expected to account for the largest share of the RoW fluorescence microscopes market in 2016. This segment is projected to reach USD 61.0 million by 2021 from USD 55.2 million in 2016, at a CAGR of 2.0% from 2016 to 2021.
  • 59.
    59 MICROSCOPY MARKET –GLOBAL FORECAST TO 2021 © MarketsandMarkets 6.3.1.1 Total Internal Reflection Fluorescence Microscopy (TIRF) TIRF is used to observe very thin regions of specimens or observe single-molecule fluorescence at surfaces and interfaces. This technique has immense applications in cell/molecular biology and neurology, as it an effective way to view single-molecule interactions. The technique offers high sensitivity and high contrast visualization of single molecules. Ongoing technology advancements, such as genetically-encoded flurophore molecules, are driving the use of TIRF. 6.3.1.2 Fluorescence Resonance Energy Transfer (FRET) FRET is a distance-dependent technique used to visualize interaction between molecules within several nanometers. It provides accurate locations and analysis on intercellular/intermolecular interactions owing to improved resolution. Factors such as advancements in pulsed lasers, innovative computer imaging technologies, discovery of new classes of fluorescent materials, and flurophore labeling techniques are driving the use of FRET. For example, the advent of fluorescent indicators has allowed the measurement of calcium in cell organelles. FRET is used to study cellular/molecular interactions, calcium metabolism, enzyme activity, DNA/RNA conformation, and gene expression. 6.3.1.3 Fluorescence Recovery After Photo -Bleaching (FRAP) FRAP is a fluorescence microscopy technique that facilitates improved visualization of real-time mobility of molecules. The technique offers high-speed image acquisition that enables the study of protein binding, mobility of membrane receptors, and cell membrane diffusion. Recent technical advances driving the use of FRAP include the development of photo-switchable molecules. 6.3.1.4 Fluorescence Lifetime Imaging Microscopy (FLIM) FLIM is an imaging technique based on differences in the exponential decay rate of fluorescence from a fluorescent sample. With this technique, it is possible to obtain information on molecules inside a living cell. The technique is particularly useful if a sample has several thick layers. The technology has huge applications in fluorescence in situ hybridization and cancer studies to detect the presence of tumors in cells. It is used as an imaging technique in confocal microscopy. 6.3.2 SUPER-RESOLUTION MICROSCOPES This type of optical microscopes capture images with higher resolution than the diffraction limit of light. There are two types of super-resolution microscopy—deterministic and stochastic. Super-resolution microscopy is widely used across various domains, including cell biology, molecular biology, electronics and semiconductors, and material research. Technological advancements, growing focus on nanotechnology, and rising demand for picture archiving and higher resolution are the major factors expected to drive growth of super-resolution microscopes in the near future. This segment is estimated to grow at a CAGR of 10.6% from 2016 to 2021. The major companies in the super-resolution microscopes market include Carl Zeiss (Germany), Nikon (Japan), and Leica Microsystems (Germany).
  • 60.
    60 MICROSCOPY MARKET –GLOBAL FORECAST TO 2021 © MarketsandMarkets 6.3.2.1 Stochastic Optical Reconstruction Microscopy (STORM) STORM works on the principle of stochastic switching of a single-molecule fluorescence signal to capture an image. STORM is a noninvasive, easy-to-use technique that provides high image depth. Furthermore, it does not require the use of high-intensity laser techniques as they increase the complexity of the procedure and can also damage the sample. STORM is a useful technique for high-resolution live cell imaging with the possibility of endogenous labeling. This technology was first adapted by Nikon in 2009. The product, N-STORM, was developed with technology licensed from Harvard University, U.S. The resolution provided by N-STORM is ten times higher than conventional optical microscopes. Moreover, N-STORM offers both 2D images and high-resolution florescence 3D images of specimens. 6.3.2.2 Structured Illumination Microscopy (SIM) In structured illumination microscopy (SIM), the sample is illuminated with a grid pattern of light, which increases resolution. This technology was first adapted by Nikon in 2009 by signing an agreement with the University of California’s San Francisco Office of Technology Management for Structural Illumination Microscopy. The product was named N-SIM. It can provide resolution of up to 85 nm in multiple colors. In addition, it can continuously capture super-resolution images at temporal resolutions of 0.6 sec/frame, enabling the study of dynamic interactions in living cells. The technology can capture 2D images at high speed with incredible contrast. TIRF with SIM facilitates greater understanding of molecular interactions at the cellular level. Companies such as Carl Zeiss and Applied Precision are using this technology with their products to increase their applications in the life sciences segment. Carl Zeiss has also developed a product named OptiGrid using SIM technology. 6.3.2.3 Stimulated Emission Depletion Microscopy (STED) STED was developed by Stefan W. Hell and Jan Wichmann in 1994. Leica Microsystems holds the patent for STED, and its STED microscope module, the Leica TCS SP8 STED 3X, integrates the super-resolution techniques of STED with a confocal microscope, providing spatial resolution of 50-70 nm. This system is ideal for multi-user imaging facilities and is used in neuroscience and cell biology research. 6.3.2.4 Coherent Anti-Strokes Raman Scattering Microscopy (CARS) CARS allows the imaging of living cells with intrinsic chemical contrast. It is a dye-free method. The crucial advantage of this method is that the sample remains almost unaffected. It does not require labeling but uses the spectroscopic properties of various chemical species found in organic material. This technology was developed at the Harvard University. Leica Microsystems signed an agreement with the Harvard University’s Office of Technological Development (OTD) to develop CARS microscopy as an extension of confocal microscopes. 6.3.2.5 Photo-Activated Localization Microscopy (PALM) PALM is a type of single-molecule super-resolution microscopy widely used to study dynamic events and the fine structural details of cellular architecture such as the intracytoplasmic transport of vesicles, cytoskeletal structures, mechanisms of tissue remodeling, and the migration of cancer cells in a diseased organism. The discovery of novel labeling probes and growing demand for image acquisition and live cell imaging are driving the use of PALM techniques. Carl Zeiss licensed PALM technology in 2007. 6.3.2.6 Reversible Saturable Optical Fluorescence Transitions (RESOLFT) RESOLFT microscopy is an optical microscope with a very high resolution limit. Leica Microsystems has licensed general RESOLFT technologies.
  • 61.
    61 MICROSCOPY MARKET –GLOBAL FORECAST TO 2021 © MarketsandMarkets TABLE 18 SUPER-RESOLUTION MICROSCOPES MARKET SIZE, BY REGION, 2014–2021 (USD MILLION) Region 2014 2015 2016 2021 CAGR (2016–2021) North America 151.5 167.0 182.9 282.5 9.1% Europe 120.8 134.9 149.5 246.6 10.5% Asia-Pacific 94.2 107.7 122.2 224.9 13.0% RoW 43.0 47.8 52.7 84.9 10.0% Total 409.5 457.4 507.4 838.9 10.6% Source: Annual Reports, Press Releases, SEC Filings, Investor Presentations, Microscopy Society of America, Canadian Cytometry and Microscopy Association, Chinese Electron Microcopy Society, Australian Microscopy and Microanalysis Society, Journal of Microscopy, Journal of Advanced Microscopy Research, Expert Interviews, and MarketsandMarkets Analysis North America is expected to account for the largest share of the super-resolution microscopes market in 2016. This segment is projected to reach USD 282.5 million by 2021 from USD 182.9 million in 2016, at a CAGR of 9.1% from 2016 to 2021. TABLE 19 ROW: SUPER-RESOLUTION MICROSCOPES MARKET SIZE, BY COUNTRY/REGION, 2014–2021 (USD MILLION) Country/Region 2014 2015 2016 2021 CAGR (2016–2021) Brazil 18.0 20.0 22.2 36.2 10.3% Mexico 10.8 11.9 12.9 19.3 8.4% Argentina 4.1 4.6 5.1 8.6 11.1% RoLA 10.1 11.3 12.5 20.7 10.6% Total 43.0 47.8 52.7 84.9 10.0% Source: Annual Reports, Press Releases, SEC Filings, Investor Presentations, Microscopy Society of America, Canadian Cytometry and Microscopy Association, Chinese Electron Microcopy Society, Australian Microscopy and Microanalysis Society, Journal of Microscopy, Journal of Advanced Microscopy Research, Expert Interviews, and MarketsandMarkets Analysis Brazil is expected to account for the largest share of the RoW super-resolution microscopes market in 2016. The country is projected to reach USD 36.2 million by 2021 from USD 22.2 million in 2016, at a CAGR of 10.3% from 2016 to 2021.
  • 62.
    62 MICROSCOPY MARKET –GLOBAL FORECAST TO 2021 © MarketsandMarkets 6.4 CONFOCAL MICROSCOPES Confocal microscopes work on the principle of point-by-point illumination of samples and rejection of out- of-focus light. In order to avoid noisy pictures, one needs to ensure illumination of the sample for longer durations with a high-intensity light source so that there are enough photons collected from the sample. Modern confocal microscopy methods use laser lights instead of zirconium arc lamps. Since these microscopes illuminate the specimen axially, there is no optical aberration, and a high-resolution 3D image is created. The technology also facilitates in-depth selectivity or optical sectioning of objects in the specimen, that is, focus on an image at a selected depth. Research and development facilities across large universities and specialized research laboratories form the major end users for these microscopes. Increasing demand for technologically-advanced devices is a major driver of innovation in this market. However, confocal microscopes are high priced—between USD 100,000 and USD 600,000—which restraints market growth. The high price has resulted in the dependence of universities and research institutions on federal funds for purchasing these devices. The primary application area for confocal microscopy is cell biology, but life science is another area of significance. Efforts are also being made to explore the applications of confocal microscopes in material sciences. FIGURE 21 APAC TO WITNESS HIGHEST GROWTH IN THE CONFOCAL MICROSCOPES MARKET DURING THE FORECAST PERIOD Source: Annual Reports, Press Releases, SEC Filings, Investor Presentations, Microscopy Society of America, Canadian Cytometry and Microscopy Association, Chinese Electron Microcopy Society, Australian Microscopy and Microanalysis Society, Journal of Microscopy, Journal of Advanced Microscopy Research, Expert Interviews, and MarketsandMarkets Analysis North America Europe Asia-Pacific RoW 2016 156.7 128.1 104.7 45.2 2021 201.4 175.8 160.3 60.5 CAGR 5.1% 6.5% 8.8% 6.0% 0 50 100 150 200 250 MarketSize(USDMillion)
  • 63.
    63 MICROSCOPY MARKET –GLOBAL FORECAST TO 2021 © MarketsandMarkets TABLE 20 CONFOCAL MICROSCOPES MARKET SIZE, BY REGION, 2014-2021 (USD MILLION) Region 2014 2015 2016 2021 CAGR (2016–2021) North America 139.9 147.4 156.7 201.4 5.1% Europe 111.5 119.0 128.1 175.8 6.5% Asia-Pacific 87.0 95.0 104.7 160.3 8.9% RoW 39.7 42.2 45.2 60.5 6.0% Total 378.1 403.6 434.8 598.0 6.6% Source: Annual Reports, Press Releases, SEC Filings, Investor Presentations, Microscopy Society of America, Canadian Cytometry and Microscopy Association, Chinese Electron Microcopy Society, Australian Microscopy and Microanalysis Society, Journal of Microscopy, Journal of Advanced Microscopy Research, Expert Interviews, and MarketsandMarkets Analysis North America is expected to account for the largest share of the global confocal microscopes market in 2014. This regional segment is projected to reach USD 201.4 million by 2021 from USD 156.7 million in 2016, at a CAGR of 5.1% from 2016 to 2021. TABLE 21 NORTH AMERICA: CONFOCAL MICROSCOPES MARKET SIZE, BY COUNTRY, 2014–2021 (USD MILLION) Country 2014 2015 2016 2021 CAGR (2016–2021) U.S. 112.6 118.7 126.4 162.9 5.2% Canada 27.3 28.7 30.4 38.4 4.8% Total 139.9 147.4 156.7 201.4 5.1% Source: Annual Reports, Press Releases, SEC Filings, Investor Presentations, Microscopy Society of America, Canadian Cytometry and Microscopy Association, Chinese Electron Microcopy Society, Australian Microscopy and Microanalysis Society, Journal of Microscopy, Journal of Advanced Microscopy Research, Expert Interviews, and MarketsandMarkets Analysis The U.S. is expected to account for the larger share of the North American confocal microscopes market in 2016. This country segment is projected to reach USD 162.9 million by 2021 from USD 126.4 million in 2016, at a higher CAGR of 5.2% from 2016 to 2021.
  • 64.
    64 MICROSCOPY MARKET –GLOBAL FORECAST TO 2021 © MarketsandMarkets TABLE 22 EUROPE: CONFOCAL MICROSCOPES MARKET SIZE, BY COUNTRY/REGION, 2014–2021 (USD MILLION) Country/Region 2014 2015 2016 2021 CAGR (2016–2021) Germany 29.6 32.5 35.9 55.9 9.3% U.K. 16.2 17.6 19.3 28.9 8.4% France 11.4 12.2 13.3 19.0 7.4% RoE 54.4 56.7 59.6 71.9 3.8% Total 111.5 119.0 128.1 175.8 6.5% Source: Annual Reports, Press Releases, SEC Filings, Investor Presentations, Microscopy Society of America, Canadian Cytometry and Microscopy Association, Chinese Electron Microcopy Society, Australian Microscopy and Microanalysis Society, Journal of Microscopy, Journal of Advanced Microscopy Research, Expert Interviews, and MarketsandMarkets Analysis Germany is expected to account for the largest share of the European confocal microscopes market in 2016. This country segment is projected to reach USD 55.9 million by 2021 from USD 35.9 million in 2016, at the highest CAGR of 9.3% from 2016 to 2021. TABLE 23 ROW: CONFOCAL MICROSCOPES MARKET SIZE, BY COUNTRY/REGION, 2014–2021 (USD MILLION) Country/Region 2014 2015 2016 2021 CAGR (2016–2021) Brazil 16.6 17.7 19.0 25.8 6.3% Mexico 10.0 10.5 11.1 13.8 4.5% Argentina 3.8 4.0 4.4 6.2 7.1% RoLA 9.3 10.0 10.7 14.7 6.6% Total 39.7 42.2 45.2 60.5 6.0% Source: Annual Reports, Press Releases, SEC Filings, Investor Presentations, Microscopy Society of America, Canadian Cytometry and Microscopy Association, Chinese Electron Microcopy Society, Australian Microscopy and Microanalysis Society, Journal of Microscopy, Journal of Advanced Microscopy Research, Expert Interviews, and MarketsandMarkets Analysis Brazil is expected to account for the largest share of the RoW confocal microscopes market in 2016. This country segment is projected to reach USD 25.8 million by 2021 from USD 19.0 million in 2016, at a CAGR of 6.3% from 2016 to 2021. 6.4.1 MULTI-PHOTON CONFOCAL MICROSCOPES A multiphoton confocal microscope uses laser beams to focus light at a particular point within the sample. With the assistance of motorized mirrors, the laser beam is shifted across the sample, which allows the creation of broader focal planes to form a 3D image. As opposed to single-photon microscopy, this method uses lower energy photons, which enables the imaging of live samples with minimum destruction. Owing to these characteristics, multiphoton microscopes have found wider applications in life sciences research. Academic research institutions and pharmaceutical and biotechnology companies form a major end-user segment for multi-photon confocal microscopy instruments. Due to the specialized licensing for these instruments, Carl Zeiss and Leica Microsystems are the only two companies that produce end-to-end multiphoton microscopy instruments. Carl Zeiss, which entered this market with the acquisition of Bio-Rad in 2004, holds the greater share of the market.
  • 65.
    65 MICROSCOPY MARKET –GLOBAL FORECAST TO 2021 © MarketsandMarkets 6.4.2 SPINNING DISK CONFOCAL MICROSCOPES The market for confocal laser scanning microscopy has been severely restrained by the low speed of image creation and the limitations of single-beam scanning movements. These limitations were overcome by the incorporation of a spinning disk (or Nipkow’s disk) in a confocal laser scanning microscope. Spinning disk confocal microscopes work on the principle of multiphoton multi-point scanning microscopy (MMM). This enables high-speed in vivo and in vitro imaging and quantitative analysis of live specimens. This type of microscopy is also called tandem scanning microscopy. During the course of development, several manufacturers developed multiple pinhole choices and more than one slit size, as opposed to the earlier method of using a single pinhole size. This has improved resolution of the images. Nikon was the pioneer in this technology, and came up with its product Swept Field Confocal (SFC) in 2004, which has four different pinhole choices and two slit sizes. Carl Zeiss (Cell Observer SD), Leica (SD 6000), Olympus (Spinning Disk Confocal), and Nikon (Swept Field Confocal) are other major companies in the spinning disk confocal microscopes market. Other than these, Andor Technology has a significant market share with three products in this market— the Revolution 488 microscopy system, Revolution DSD, and Revolution XD microscopy system. 6.5 SCANNING PROBE MICROSCOPES (SPM) Scanning probe microscopy is an advanced method that uses physical probes to scan the specimen and produce an image. The image resolution is independent of the diffraction characteristic of light, depending instead on the size of the probe that can be reduced to the range of picometers, which helps improve image quality. As an additional feature, the scanning probe can be used to modify samples and create small structures of specimens. However, the small-sized image produced, slow rate of image acquisition, and inability to determine the required shape of the probe are some major limitations of this technique. The market for SPM is segmented into scanning tunneling microscopy, atomic force microscopy, and near- field scanning microscopy. The overall market for SPM instruments is driven by high growth in the AFM segment. These instruments are low priced as compared to electron microscopes but have similar application areas. Thus, the higher uptake of SPM by mid-sized and large universities and research organizations is expected to drive the market for SPM during the forecast period. Bruker Optics (U.S.), Agilent Technologies (U.S.), Asylum Research (U.S.), NT-MDT (Russia), Nanosurf (Switzerland), and JEOL Ltd. (Japan) are some major companies in this market.
  • 66.
    66 MICROSCOPY MARKET –GLOBAL FORECAST TO 2021 © MarketsandMarkets FIGURE 22 STM SEGMENT TO DOMINATE THE SPM MARKET Source: Annual Reports, Press Releases, SEC Filings, Investor Presentations, Microscopy Society of America, Canadian Cytometry and Microscopy Association, Chinese Electron Microcopy Society, Australian Microscopy and Microanalysis Society, Journal of Microscopy, Journal of Advanced Microscopy Research, Expert Interviews, and MarketsandMarkets Analysis TABLE 24 SPM MARKET SIZE, BY TYPE, 2014-2021 (USD MILLION) Type 2014 2015 2016 2021 CAGR (2016–2021) STM 394.8 416.2 439.8 568.8 5.3% AFM 150.7 158.9 167.9 217.7 5.3% Near-field Scanning Microscopes 27.8 29.4 30.9 40.2 5.4% Total 573.3 604.5 638.7 826.7 5.3% Source: Annual Reports, Press Releases, SEC Filings, Investor Presentations, Microscopy Society of America, Canadian Cytometry and Microscopy Association, Chinese Electron Microcopy Society, Australian Microscopy and Microanalysis Society, Journal of Microscopy, Journal of Advanced Microscopy Research, Expert Interviews, and MarketsandMarkets Analysis In 2016, the STM segment is expected to account for a 68.9% share of the global SPM market. This segment is projected to reach USD 568.8 million by 2021 from USD 439.8 million in 2016, at a CAGR of 5.3% during the forecast period. Scanning Tunneling Microscopes Atomic Force Microscopes Near-field Scanning Microcsopes 2016 439.8 167.9 30.9 2021 568.8 217.7 40.2 CAGR 5.2% 5.3% 5.3% 0 100 200 300 400 500 600 MarketSize(USDMillion)
  • 67.
    67 MICROSCOPY MARKET –GLOBAL FORECAST TO 2021 © MarketsandMarkets TABLE 25 SPM MARKET SIZE, BY REGION, 2014-2021 (USD MILLION) Region 2014 2015 2016 2021 CAGR (2016–2021) North America 212.1 220.8 230.2 278.4 3.9% Europe 169.1 178.3 188.2 243.0 5.2% Asia-Pacific 131.9 142.3 153.9 221.7 7.6% RoW 60.2 63.2 66.4 83.6 4.7% Total 573.3 604.5 638.7 826.7 5.3% Source: Annual Reports, Press Releases, SEC Filings, Investor Presentations, Microscopy Society of America, Canadian Cytometry and Microscopy Association, Chinese Electron Microcopy Society, Australian Microscopy and Microanalysis Society, Journal of Microscopy, Journal of Advanced Microscopy Research, Expert Interviews, and MarketsandMarkets Analysis North America is expected to account for the largest share of the global SPM market in 2016. This regional segment is projected to reach USD 278.4 million by 2019 from USD 230.2 million in 2016, at a CAGR of 3.9% from 2016 to 2021. TABLE 26 NORTH AMERICA: SPM MARKET SIZE, BY COUNTRY, 2014–2021 (USD MILLION) Country 2014 2015 2016 2021 CAGR (2016–2021) U.S. 170.8 177.9 185.6 225.3 3.9% Canada 41.4 42.9 44.6 53.1 3.5% Total 212.1 220.8 230.2 278.4 3.9% Source: Annual Reports, Press Releases, SEC Filings, Investor Presentations, Microscopy Society of America, Canadian Cytometry and Microscopy Association, Chinese Electron Microcopy Society, Australian Microscopy and Microanalysis Society, Journal of Microscopy, Journal of Advanced Microscopy Research, Expert Interviews, and MarketsandMarkets Analysis The U.S. is expected to account for the larger share of the North American SPM market in 2016. This country segment is projected to reach USD 225.3 million by 2021 from USD 185.6 million in 2016, at a CAGR of 3.9% during the forecast period. TABLE 27 EUROPE: SPM MARKET SIZE, BY COUNTRY/REGION, 2014–2021 (USD MILLION) Country/Region 2014 2015 2016 2021 CAGR (2016–2021) Germany 44.8 48.6 52.7 77.3 8.0% U.K. 24.6 26.4 28.4 40.0 7.1% France 17.3 18.3 19.5 26.3 6.1% RoE 82.4 84.9 87.6 99.4 2.6% Total 169.1 178.3 188.2 243.0 5.2% Source: Annual Reports, Press Releases, SEC Filings, Investor Presentations, Microscopy Society of America, Canadian Cytometry and Microscopy Association, Chinese Electron Microcopy Society, Australian Microscopy and Microanalysis Society, Journal of Microscopy, Journal of Advanced Microscopy Research, Expert Interviews, and MarketsandMarkets Analysis Germany is expected to account for the largest share of the European SPM market in 2016. This country segment is projected to reach USD 77.3 million by 2021 from USD 52.7 million in 2016, at the highest CAGR of 8.0% from 2016 to 2021.
  • 68.
    68 MICROSCOPY MARKET –GLOBAL FORECAST TO 2021 © MarketsandMarkets FIGURE 23 BRAZIL TO ACCOUNT FOR THE LARGEST SHARE OF THE SPM MARKET IN THE ROW Source: Annual Reports, Press Releases, SEC Filings, Investor Presentations, Microscopy Society of America, Canadian Cytometry and Microscopy Association, Chinese Electron Microcopy Society, Australian Microscopy and Microanalysis Society, Journal of Microscopy, Journal of Advanced Microscopy Research, Expert Interviews, and MarketsandMarkets Analysis TABLE 28 ROW: SPM MARKET SIZE, BY COUNTRY/REGION, 2014–2021 (USD MILLION) Country/Region 2014 2015 2016 2021 CAGR (2016–2021) Brazil 25.2 26.5 27.9 35.7 5.0% Mexico 15.2 15.7 16.3 19.1 3.2% Argentina 5.7 6.1 6.4 8.5 5.8% RoLA 14.1 14.9 15.8 20.4 5.3% Total 60.2 63.2 66.4 83.6 4.7% Source: Annual Reports, Press Releases, SEC Filings, Investor Presentations, Microscopy Society of America, Canadian Cytometry and Microscopy Association, Chinese Electron Microcopy Society, Australian Microscopy and Microanalysis Society, Journal of Microscopy, Journal of Advanced Microscopy Research, Expert Interviews, and MarketsandMarkets Analysis Brazil is expected to account for the largest share of the RoW SPM market in 2016. This country segment is projected to reach USD 35.7 million by 2021 from USD 27.9 million in 2016, at a CAGR of 5.0% from 2016 to 2021. Brazil Mexico Argentina RoLA 2016 27.9 16.3 6.4 15.8 2021 35.7 19.1 8.5 20.4 CAGR 5.0% 3.2% 5.7% 5.2% 0 5 10 15 20 25 30 35 40 MarketSize(USDMillion)
  • 69.
    69 MICROSCOPY MARKET –GLOBAL FORECAST TO 2021 © MarketsandMarkets 6.5.1 SCANNING TUNNELING MICROSCOPES (STM) Scanning tunneling microscopes are earlier versions of SPM. These microscopes work on the principle of quantum tunneling—that is, the application of a tunneling current at the probe’s tip; the tip’s position scans the surface of the sample and creates an image on the monitor. The requirement of stable and clean surfaces, sharp tips, and extreme vibration control mechanisms are some of the major limitations of this type of microscopy. These limitations have been overcome through the development of AFM. Being a high-level surface scanning technology, STM has a wide range of applications across industries and research for topological studies. Applications in the life sciences segment include studies related to atom interactions, plasma membranes, and cell structures. TABLE 29 STM MARKET SIZE, BY REGION, 2014-2021 (USD MILLION) Region 2014 2015 2016 2021 CAGR (2016–2021) North America 146.1 152.0 158.5 191.5 3.9% Europe 116.5 122.7 129.6 167.2 5.2% Asia-Pacific 90.8 98.0 105.9 152.5 7.6% RoW 41.5 43.5 45.7 57.5 4.7% Total 394.8 416.2 439.8 568.8 5.3% Source: Annual Reports, Press Releases, SEC Filings, Investor Presentations, Microscopy Society of America, Canadian Cytometry and Microscopy Association, Chinese Electron Microcopy Society, Australian Microscopy and Microanalysis Society, Journal of Microscopy, Journal of Advanced Microscopy Research, Expert Interviews, and MarketsandMarkets Analysis North America is expected to account for the largest share of the STM market in 2016. This regional segment is projected to reach USD 191.5 million by 2021 from USD 158.5 million in 2016, at a CAGR of 3.9% from 2016 to 2021. TABLE 30 ROW: STM MARKET SIZE, BY COUNTRY/REGION, 2014–2021 (USD MILLION) Country/Region 2014 2015 2016 2021 CAGR (2016–2021) Brazil 17.3 18.2 19.2 24.6 5.0% Mexico 10.4 10.8 11.2 13.1 3.2% Argentina 3.9 4.2 4.4 5.9 5.8% RoLA 9.7 10.3 10.8 14.0 5.3% Total 41.5 43.5 45.7 57.5 4.7% Source: Annual Reports, Press Releases, SEC Filings, Investor Presentations, Microscopy Society of America, Canadian Cytometry and Microscopy Association, Chinese Electron Microcopy Society, Australian Microscopy and Microanalysis Society, Journal of Microscopy, Journal of Advanced Microscopy Research, Expert Interviews, and MarketsandMarkets Analysis Brazil is expected to account for the largest share of the RoW STM market in 2016. This country segment is projected to reach USD 24.6 million by 2021 from USD 19.2 million in 2016, at a CAGR of 5.0% from 2016 to 2021.
  • 70.
    70 MICROSCOPY MARKET –GLOBAL FORECAST TO 2021 © MarketsandMarkets 6.5.2 ATOMIC FORCE MICROSCOPES (AFM) AFMs are high-resolution SPM with resolution power of up to the order of nanometers. Unlike scanning tunneling microscopes (STM), AFM create 3D images of specimens. The image resolution and quality of AFM instruments are comparable to electron microscopes. This is the primary reason for the wider uptake of AFMs as an alternative to the high-cost electron microscopes. AFM instruments have a wide range of applications across various industries such as semiconductors, polymers, metallurgy, ceramics, nanotechnology, biomedical, and life sciences. The market for AFM is expected to be driven by the overall growth of the nanotechnology and biotechnology sectors. The easy availability of research funds is expected to be the primary growth driver for this market segment. However, the higher replacement cost of cantilevers—the probes used for scanning—and the inability to scan steep walls of specimens are some limitations of AFM. The current trend in the AFM segment is the incorporation of a wide range of accessories in microscopes to achieve digitization of images and to improve resolution. TABLE 31 AFM MARKET SIZE, BY REGION, 2014-2021 (USD MILLION) Region 2014 2015 2016 2021 CAGR (2016–2021) North America 55.7 58.0 60.5 73.3 3.9% Europe 44.4 46.9 49.5 64.0 5.3% Asia-Pacific 34.7 37.4 40.5 58.4 7.6% RoW 15.8 16.6 17.4 22.0 4.8% Total 150.7 158.9 167.9 217.7 5.3% Source: Annual Reports, Press Releases, SEC Filings, Investor Presentations, Microscopy Society of America, Canadian Cytometry and Microscopy Association, Chinese Electron Microcopy Society, Australian Microscopy and Microanalysis Society, Journal of Microscopy, Journal of Advanced Microscopy Research, Expert Interviews, and MarketsandMarkets Analysis North America is expected to account for the largest share of the AFM market in 2016. This regional segment is projected to reach USD 73.3 million by 2021 from USD 60.5 million in 2016, at a CAGR of 3.9% from 2016 to 2021. TABLE 32 ROW: AFM MARKET SIZE, BY COUNTRY/REGION, 2014–2021 (USD MILLION) Country/Region 2014 2015 2016 2021 CAGR (2016–2021) Brazil 6.6 7.0 7.3 9.4 5.1% Mexico 4.0 4.1 4.3 5.0 3.3% Argentina 1.5 1.6 1.7 2.2 5.8% RoLA 3.7 3.9 4.1 5.4 5.3% Total 15.8 16.6 17.4 22.0 4.8% Source: Annual Reports, Press Releases, SEC Filings, Investor Presentations, Microscopy Society of America, Canadian Cytometry and Microscopy Association, Chinese Electron Microcopy Society, Australian Microscopy and Microanalysis Society, Journal of Microscopy, Journal of Advanced Microscopy Research, Expert Interviews, and MarketsandMarkets Analysis Brazil is expected to account for the largest share of the RoW AFM market in 2016. This country segment is projected to reach USD 9.4 million by 2021 from USD 7.3 million in 2016, at a CAGR of 5.1% from 2016 to 2021.
  • 71.
    71 MICROSCOPY MARKET –GLOBAL FORECAST TO 2021 © MarketsandMarkets 6.5.3 NEAR-FIELD SCANNING OPTICAL MICROSCOPES (NSOM) NSOM utilizes the properties of evanescent waves for nanostructure analysis. Due to this feature, when combined with fluorescence technique, biologically active molecules near or on the surface can be studied using near-field scanning microscopy. NSOM is high-resolution optical microscopy with a wide range of applications in the life sciences sector, including studies related to DNA sequencing, molecular organizations in monolayers, formation of protrusions in the cell membrane, and investigation of blood cells. Due to overlapping application areas, the increasing use of AFM and STM in the life sciences sector is the biggest threat to the NSOM market. Some of the major companies in this market include Agilent Technologies (U.S.), Asylum Research (U.S.), JEOL Ltd. (Japan), and KLA-Tencor (U.S.) TABLE 33 NSOM MARKET SIZE, BY REGION, 2014-2021 (USD MILLION) Region 2014 2015 2016 2021 CAGR (2016–2021) North America 10.3 10.7 11.1 13.5 4.0% Europe 8.2 8.7 9.1 11.8 5.3% Asia-Pacific 6.4 6.9 7.4 10.8 7.7% RoW 2.9 3.1 3.2 4.1 4.8% Total 27.8 29.4 30.9 40.2 5.4% Source: Annual Reports, Press Releases, SEC Filings, Investor Presentations, Microscopy Society of America, Canadian Cytometry and Microscopy Association, Chinese Electron Microcopy Society, Australian Microscopy and Microanalysis Society, Journal of Microscopy, Journal of Advanced Microscopy Research, Expert Interviews, and MarketsandMarkets Analysis North America is expected to account for the largest share of the NSOM market in 2016. This regional segment is projected to reach USD 13.5 million by 2021 from USD 11.1 million in 2016, at a CAGR of 4.0% from 2016 to 2021. TABLE 34 ROW: NSOM MARKET SIZE, BY COUNTRY/REGION, 2014–2021 (USD MILLION) Country/Region 2014 2015 2016 2021 CAGR (2016–2021) Brazil 1.22 1.29 1.35 1.74 5.1% Mexico 0.74 0.76 0.79 0.93 3.3% Argentina 0.28 0.29 0.31 0.41 5.9% RoLA 0.69 0.73 0.76 0.99 5.4% Total 2.92 3.07 3.21 4.07 4.8% Source: Annual Reports, Press Releases, SEC Filings, Investor Presentations, Microscopy Society of America, Canadian Cytometry and Microscopy Association, Chinese Electron Microcopy Society, Australian Microscopy and Microanalysis Society, Journal of Microscopy, Journal of Advanced Microscopy Research, Expert Interviews, and MarketsandMarkets Analysis Brazil is expected to account for the largest share of the RoW NSOM market in 2016. This segment is projected to reach USD 1.74 million by 2021 from USD 1.35 million in 2016, at a CAGR of 5.1% from 2016 to 2021.
  • 72.
    72 MICROSCOPY MARKET –GLOBAL FORECAST TO 2021 © MarketsandMarkets 7 MICROSCOPY MARKET, BY APPLICATION KEY FINDINGS  In 2016, the semiconductors segment is expected to account for the largest share of 35.1% of the global microscopy applications market and is expected to grow at a CAGR of 7.6% from 2016 to 2021  Increasing demand for advanced microscopes and growing focus on the development of nanoelectronics, miniature transistor chips, and optoelectronics are major drivers for growth of the semiconductors segment  In 2016, the life sciences segment is expected to account for the second-largest share of 34.3% of the global microscopy applications market. This segment is estimated to grow at a CAGR of 8.0% from 2016 to 2021  Implementation of favorable government initiatives (like the BRAIN initiative) and increasing application of microscopes in various life science domains such as oncology, cell biology, neurosciences, protein analysis, and optogenetics are major factors driving growth of the life sciences segment  Nanotechnology is the fastest-growing application segment in the microscopy market and is expected to grow at a CAGR of 10.2% from 2016 to 2021
  • 73.
    73 MICROSCOPY MARKET –GLOBAL FORECAST TO 2021 © MarketsandMarkets 7.1 INTRODUCTION Ongoing technological advancements have widened the application areas of microscopes, and, in recent years, microscopes are increasingly being used in cancer studies, cell biology, molecular biology, protein analysis, neurosciences, textile engineering, material sciences, nanomedicines, optogenetics, failure analysis, and process development. Based on applications, in this research report, the global microscopy market has been categorized into four application segments—semiconductors, life sciences, material sciences, and nanotechnology. In 2016, the semiconductors segment is expected to account for the largest share of 35.1% of the global microscopy market, followed by the life sciences segment with a share of 34.3%. FIGURE 24 SEMICONDUCTORS SEGMENT TO DOMINATE THE MICROSCOPY APPLICATION MARKET DURING THE FORECAST PERIOD Source: Annual Reports, Press Releases, SEC Filings, Investor Presentations, Microscopy Society of America, Canadian Cytometry and Microscopy Association, Chinese Electron Microcopy Society, Australian Microscopy and Microanalysis Society, Journal of Microscopy, Journal of Advanced Microscopy Research, Expert Interviews, and MarketsandMarkets Analysis TABLE 35 GLOBAL MICROSCOPY MARKET SIZE, BY APPLICATION, 2014–2021 (USD MILLION) Application 2014 2015 2016 2021 CAGR (2016–2021) Semiconductors 1,423.0 1,529.0 1,644.2 2,371.3 7.6% Life Sciences 1,382.4 1,488.0 1,604.8 2,353.1 8.0% Material Sciences 813.2 849.7 894.9 1,121.0 4.6% Nanotechnology 447.2 491.9 541.5 881.2 10.2% Total 4,065.8 4,358.5 4,685.4 6,726.5 7.5% Source: Annual Reports, Press Releases, SEC Filings, Investor Presentations, Microscopy Society of America, Canadian Cytometry and Microscopy Association, Chinese Electron Microcopy Society, Australian Microscopy and Microanalysis Society, Journal of Microscopy, Journal of Advanced Microscopy Research, Expert Interviews, and MarketsandMarkets Analysis The semiconductors segment is expected to account for the largest share of the global microscopy applications market in 2016. This segment is projected to reach USD 2,371.3 million by 2021 from USD 1,644.2 million in 2016, at a CAGR of 7.6% during the forecast period. Semiconductors Life Sciences Material Sciences Nanotechnology 2016 1,644.2 1,604.8 894.9 541.5 2021 2,371.3 2,353.1 1,121.0 881.2 CAGR 7.6% 8.0% 4.6% 10.2% 0 500 1,000 1,500 2,000 2,500 MarketSize(USDMillion)
  • 74.
    74 MICROSCOPY MARKET –GLOBAL FORECAST TO 2021 © MarketsandMarkets 7.2 SEMICONDUCTORS The semiconductors segment is expected to account for the largest share (35.1%) of the global microscopy applications market in 2016. Microscopy is used extensively in the semiconductors industry for research and development, quality control (QC), monitoring, process development, and failure analysis. Technological advancements in microscopy, such as Focused Ion Beam milling techniques and super- resolution microscopy, are offering significant growth opportunities for this industry. The semiconductor industry is the major end user of advanced microscopes such as transmission electron microscopes and multi-photon confocal microscopes. The growing demand for miniature transistor chips, nanoelectronics, quantum dots, and optoelectronics are major factors driving adoption of microscopes in the semiconductor industry. The Eclipse LV150N, Eclipse LV150NL, and Eclipse L200N Series from Nikon are some examples of microscopes for the semiconductor industry. FIGURE 25 ASIA-PACIFIC TO WITNESS THE HIGHEST GROWTH RATE DURING THE FORECAST PERIOD Source: Annual Reports, Press Releases, SEC Filings, Investor Presentations, Microscopy Society of America, Canadian Cytometry and Microscopy Association, Chinese Electron Microcopy Society, Australian Microscopy and Microanalysis Society, Journal of Microscopy, Journal of Advanced Microscopy Research, Expert Interviews, and MarketsandMarkets Analysis North America Europe Asia-Pacific RoW 2016 592.7 484.5 396.1 170.8 2021 798.5 697.1 635.8 239.9 CAGR 6.1% 7.5% 9.9% 7.0% 0 100 200 300 400 500 600 700 800 900 MarketSize(USDMillion)
  • 75.
    75 MICROSCOPY MARKET –GLOBAL FORECAST TO 2021 © MarketsandMarkets TABLE 36 MICROSCOPY MARKET SIZE FOR SEMICONDUCTORS, BY REGION, 2014–2021 (USD MILLION) Region 2014 2015 2016 2021 CAGR (2016–2021) North America 526.5 558.4 592.7 798.5 6.1% Europe 419.8 450.9 484.5 697.1 7.5% Asia-Pacific 327.3 359.9 396.1 635.8 9.9% RoW 149.4 159.8 170.8 239.9 7.0% Total 1,423.0 1,529.0 1,644.2 2,371.3 7.6% Source: Annual Reports, Press Releases, SEC Filings, Investor Presentations, Microscopy Society of America, Canadian Cytometry and Microscopy Association, Chinese Electron Microcopy Society, Australian Microscopy and Microanalysis Society, Journal of Microscopy, Journal of Advanced Microscopy Research, Expert Interviews, and MarketsandMarkets Analysis In 2016, North America is expected to command the largest share of the microscopy market for semiconductors. This segment is projected to reach USD 798.5 million by 2021 from USD 592.7 million in 2016, at a CAGR of 6.1% from 2016 to 2021. TABLE 37 NORTH AMERICA: MICROSCOPY MARKET SIZE FOR SEMICONDUCTORS, BY COUNTRY, 2014–2021 (USD MILLION) Country 2014 2015 2016 2021 CAGR (2016–2021) U.S. 423.8 449.8 477.9 646.1 6.2% Canada 102.7 108.5 114.9 152.3 5.8% Total 526.5 558.4 592.7 798.5 6.1% Source: Annual Reports, Press Releases, SEC Filings, Investor Presentations, Microscopy Society of America, Canadian Cytometry and Microscopy Association, Chinese Electron Microcopy Society, Australian Microscopy and Microanalysis Society, Journal of Microscopy, Journal of Advanced Microscopy Research, Expert Interviews, and MarketsandMarkets Analysis In 2016, the U.S. is expected to command the larger share of the North American microscopy market for semiconductors. This segment is projected to reach USD 646.1 million by 2021 from USD 477.9 million in 2016, at a higher CAGR of 6.2% from 2016 to 2021.
  • 76.
    76 MICROSCOPY MARKET –GLOBAL FORECAST TO 2021 © MarketsandMarkets TABLE 38 EUROPE: MICROSCOPY MARKET SIZE FOR SEMICONDUCTORS, BY COUNTRY/REGION, 2014–2021 (USD MILLION) Country/Region 2014 2015 2016 2021 CAGR (2016–2021) Germany 111.3 123.0 135.7 221.8 10.3% U.K. 61.0 66.7 73.0 114.8 9.5% France 42.9 46.4 50.3 75.5 8.5% RoE 204.6 214.8 225.5 285.0 4.8% Total 419.8 450.9 484.5 697.1 7.5% Source: Annual Reports, Press Releases, SEC Filings, Investor Presentations, Microscopy Society of America, Canadian Cytometry and Microscopy Association, Chinese Electron Microcopy Society, Australian Microscopy and Microanalysis Society, Journal of Microscopy, Journal of Advanced Microscopy Research, Expert Interviews, and MarketsandMarkets Analysis In 2016, Germany is expected to command the largest share of the European microscopy market for semiconductors. This country segment is projected to reach USD 221.8 million by 2021 from USD 135.7 million in 2016, at the highest CAGR of 10.3% from 2016 to 2021. TABLE 39 ROW: MICROSCOPY MARKET SIZE FOR SEMICONDUCTORS, BY COUNTRY/REGION, 2014–2021 (USD MILLION) Country/Region 2014 2015 2016 2021 CAGR (2016–2021) Brazil 62.5 67.0 71.8 102.4 7.3% Mexico 37.7 39.7 41.9 54.7 5.5% Argentina 14.2 15.3 16.6 24.4 8.1% RoLA 35.1 37.7 40.6 58.4 7.6% Total 149.4 159.8 170.8 239.9 7.0% Source: Annual Reports, Press Releases, SEC Filings, Investor Presentations, Microscopy Society of America, Canadian Cytometry and Microscopy Association, Chinese Electron Microcopy Society, Australian Microscopy and Microanalysis Society, Journal of Microscopy, Journal of Advanced Microscopy Research, Expert Interviews, and MarketsandMarkets Analysis In 2016, Brazil is expected to command the largest share of the RoW microscopy market for semiconductors. This country segment is projected to reach USD 102.4 million by 2021 from USD 71.8 million in 2016, at a CAGR of 7.3% from 2016 to 2021.
  • 77.
    77 MICROSCOPY MARKET –GLOBAL FORECAST TO 2021 © MarketsandMarkets TABLE 40 MICROSCOPY MARKET SIZE FOR SEMICONDUCTORS, BY PRODUCT, 2014–2021 (USD MILLION) Product 2014 2015 2016 2021 CAGR (2016– 2021) Optical Microscopes 513.0 529.8 538.8 675.3 4.6% Electron Microscopes 577.0 645.5 728.7 1,193.7 10.4% Confocal Microscopes 132.3 141.6 152.6 210.8 6.7% SPM 200.6 212.1 224.1 291.4 5.4% Total 1,423.0 1,529.0 1,644.2 2,371.3 7.6% Source: Annual Reports, Press Releases, SEC Filings, Investor Presentations, Microscopy Society of America, Canadian Cytometry and Microscopy Association, Chinese Electron Microcopy Society, Australian Microscopy and Microanalysis Society, Journal of Microscopy, Journal of Advanced Microscopy Research, Expert Interviews, and MarketsandMarkets Analysis In 2016, the electron microscopes segment is expected to command the largest share of the microscopy market for semiconductors. This country segment is projected to reach USD 1,193.7 million by 2021 from USD 728.7 million in 2016, at the highest CAGR of 10.4% from 2016 to 2021.
  • 78.
    78 MICROSCOPY MARKET –GLOBAL FORECAST TO 2021 © MarketsandMarkets 7.3 LIFE SCIENCES The life sciences segment is expected to account for the second-largest share of 34.3% of the global microscopy applications market in 2016. Microscopes are widely used in various life sciences applications, such as cancer studies, protein analysis, cellular biology studies, stem cell research, neurosciences, and optogenetics. Growing research and development activities and availability of funding in life sciences are the key factors driving growth of this application segment. FIGURE 26 MICROSCOPY INSTRUMENTS IN LIFE SCIENCES Source: Annual Reports, Press Releases, SEC Filings, Investor Presentations, Expert Interviews, and MarketsandMarkets Analysis Advanced microscopes, such as AFM and electron microscopes, are used in quality control processes (such as particle size analysis and shelf life studies) in the pharmaceutical industry. Globally, the availability of government funding to support life science research activities is one of the major factors fueling growth of this application segment. For instance, in April 2013, the Brain Research through Advancing Innovative Neurotechnologies (BRAIN) Initiative, with a projected annual cost of over USD 300 million for a period of ten years, was launched by the U.S. government. 1 meter 100 mm 10 mm 1 mm 100 µm 10 µm 1 µm 100nm 10nm 1nm 10-1nm 200 µm Electron Microscopes and Scanning Probe Microscopes Optical microscopes Un-aided human eye Cells Bacteria Viruses Macromolecules 200 nm
  • 79.
    79 MICROSCOPY MARKET –GLOBAL FORECAST TO 2021 © MarketsandMarkets TABLE 41 MICROSCOPY MARKET SIZE FOR LIFE SCIENCES, BY REGION, 2014–2021 (USD MILLION) Region 2014 2015 2016 2021 CAGR (2016– 2021) North America 511.5 543.4 578.5 792.4 6.5% Europe 407.8 438.8 472.9 691.7 7.9% Asia-Pacific 317.9 350.3 386.6 630.9 10.3% RoW 145.1 155.5 166.7 238.1 7.4% Total 1,382.4 1,488.0 1,604.8 2,353.1 8.0% Source: Annual Reports, Press Releases, SEC Filings, Investor Presentations, Microscopy Society of America, Canadian Cytometry and Microscopy Association, Chinese Electron Microcopy Society, Australian Microscopy and Microanalysis Society, Journal of Microscopy, Journal of Advanced Microscopy Research, Expert Interviews, and MarketsandMarkets Analysis In 2016, North America is expected to command the largest share of the microscopy market for life sciences. This regional segment is projected to reach USD 792.4 million by 2021 from USD 578.5 million in 2016, at a CAGR of 6.5% from 2016 to 2021. FIGURE 27 U.S. TO DOMINATE THE MICROSCOPY MARKET FOR LIFE SCIENCES IN 2016 Source: Annual Reports, Press Releases, SEC Filings, Investor Presentations, Microscopy Society of America, Canadian Cytometry and Microscopy Association, Chinese Electron Microcopy Society, Australian Microscopy and Microanalysis Society, Journal of Microscopy, Journal of Advanced Microscopy Research, Expert Interviews, and MarketsandMarkets Analysis U.S. Canada 2016 466.4 112.1 2021 641.2 151.2 CAGR 6.6% 6.2% 0 100 200 300 400 500 600 700 MarketSize(USDMillion)
  • 80.
    80 MICROSCOPY MARKET –GLOBAL FORECAST TO 2021 © MarketsandMarkets TABLE 42 NORTH AMERICA: MICROSCOPY MARKET SIZE FOR LIFE SCIENCES, BY COUNTRY, 2014–2021 (USD MILLION) Country 2014 2015 2016 2021 CAGR (2016– 2021) U.S. 411.7 437.8 466.4 641.2 6.6% Canada 99.7 105.6 112.1 151.2 6.2% Total 511.5 543.4 578.5 792.3 6.5% Source: Annual Reports, Press Releases, SEC Filings, Investor Presentations, Microscopy Society of America, Canadian Cytometry and Microscopy Association, Chinese Electron Microcopy Society, Australian Microscopy and Microanalysis Society, Journal of Microscopy, Journal of Advanced Microscopy Research, Expert Interviews, and MarketsandMarkets Analysis In 2016, the U.S. is expected to command the larger share of the North American microscopy market for life sciences. This country segment is projected to reach USD 641.2 million by 2021 from USD 466.4 million in 2016, at a CAGR of 6.6% from 2016 to 2021. TABLE 43 EUROPE: MICROSCOPY MARKET SIZE FOR LIFE SCIENCES, BY COUNTRY/REGION, 2014–2021 (USD MILLION) Country/Region 2014 2015 2016 2021 CAGR (2016– 2021) Germany 108.1 119.7 132.4 220.0 10.7% U.K. 59.3 64.9 71.3 113.9 9.8% France 41.7 45.2 49.1 74.9 8.8% RoE 198.8 209.0 220.1 282.8 5.1% Total 407.8 438.8 472.9 691.7 7.9% Source: Annual Reports, Press Releases, SEC Filings, Investor Presentations, Microscopy Society of America, Canadian Cytometry and Microscopy Association, Chinese Electron Microcopy Society, Australian Microscopy and Microanalysis Society, Journal of Microscopy, Journal of Advanced Microscopy Research, Expert Interviews, and MarketsandMarkets Analysis In 2016, Germany is expected to command the largest share of the European microscopy market for life sciences. This country segment is projected to reach USD 220.0 million by 2021 from USD 132.4 million in 2016, at the highest CAGR of 10.7% from 2016 to 2021.
  • 81.
    81 MICROSCOPY MARKET –GLOBAL FORECAST TO 2021 © MarketsandMarkets TABLE 44 ROW: MICROSCOPY MARKET SIZE FOR LIFE SCIENCES, BY COUNTRY, 2014–2021 (USD MILLION) Country/Region 2014 2015 2016 2021 CAGR (2016– 2021) Brazil 60.7 65.2 70.1 101.6 7.7% Mexico 36.6 38.6 40.9 54.3 5.8% Argentina 13.8 14.9 16.2 24.3 8.5% RoLA 34.1 36.7 39.6 58.0 7.9% Total 145.1 155.5 166.7 238.1 7.4% Source: Annual Reports, Press Releases, SEC Filings, Investor Presentations, Microscopy Society of America, Canadian Cytometry and Microscopy Association, Chinese Electron Microcopy Society, Australian Microscopy and Microanalysis Society, Journal of Microscopy, Journal of Advanced Microscopy Research, Expert Interviews, and MarketsandMarkets Analysis In 2016, Brazil is expected to command the largest share of the RoW microscopy market for life sciences. This segment is projected to reach USD 101.6 million by 2021 from USD 70.1 million in 2016, at a CAGR of 7.7% from 2016 to 2021. TABLE 45 MICROSCOPY MARKET SIZE FOR LIFE SCIENCES, BY PRODUCT, 2014–2021 (USD MILLION) Product 2014 2015 2016 2021 CAGR (2016– 2021) Optical Microscopes 546.0 590.0 654.3 920.1 7.1% Electron Microscopes 512.9 553.8 582.9 938.6 10.0% Confocal Microscopes 128.6 137.8 148.9 205.9 6.7% SPM 194.9 206.4 218.7 288.5 5.7% Total 1,382.4 1,488.0 1,604.8 2,353.1 8.0% Source: Annual Reports, Press Releases, SEC Filings, Investor Presentations, Microscopy Society of America, Canadian Cytometry and Microscopy Association, Chinese Electron Microcopy Society, Australian Microscopy and Microanalysis Society, Journal of Microscopy, Journal of Advanced Microscopy Research, Expert Interviews, and MarketsandMarkets Analysis In 2016, the electron microscopes segment is expected to command the largest share of the microscopy market for life sciences. This segment is projected to reach USD 938.6 million by 2021 from USD 582.9 million in 2016, at the highest CAGR of 10.0% from 2016 to 2021.
  • 82.
    82 MICROSCOPY MARKET –GLOBAL FORECAST TO 2021 © MarketsandMarkets 7.4 MATERIAL SCIENCES The material sciences segment is expected to account for a share of 19.1% of the global microscopy applications market in 2016. Material science deals with the discovery and study of properties of materials; in this field, microscopes are used for structural and chemical analysis of materials such as polymers, metal alloys, ceramics, and biomaterials. The use of customized microscopy solutions to meet end-user needs; development of digital microscope cameras with image sensors, such as charge-coupled device (CCD) and complementary metal-oxide semiconductor (CMOS); and availability of novel image acquisition software are driving the microscopy market for material science applications. In addition, growing focus on designing novel materials such as fullerene, graphene, carbon nanotubes, quantum dots, silicone, superalloys, and synthetic diamonds is expected to offer significant growth opportunities for this application segment in the coming years. TABLE 46 MICROSCOPY MARKET SIZE FOR MATERIAL SCIENCES, BY REGION, 2014–2021 (USD MILLION) Region 2014 2015 2016 2021 CAGR (2016– 2021) North America 300.9 310.3 322.6 377.5 3.2% Europe 239.9 250.6 263.7 329.5 4.6% Asia-Pacific 187.0 200.0 215.6 300.6 6.9% RoW 85.4 88.8 93.0 113.4 4.1% Total 813.2 849.7 894.9 1,121.0 4.6% Source: Annual Reports, Press Releases, SEC Filings, Investor Presentations, Microscopy Society of America, Canadian Cytometry and Microscopy Association, Chinese Electron Microcopy Society, Australian Microscopy and Microanalysis Society, Journal of Microscopy, Journal of Advanced Microscopy Research, Expert Interviews, and MarketsandMarkets Analysis In 2016, North America is expected to command the largest share of the microscopy market for material sciences. This regional segment is projected to reach USD 377.5 million by 2021 from USD 322.6 million in 2016, at a CAGR of 3.2% from 2016 to 2021. TABLE 47 NORTH AMERICA: MICROSCOPY MARKET SIZE FOR MATERIAL SCIENCES, BY COUNTRY, 2014–2021 (USD MILLION) Country 2014 2015 2016 2021 CAGR (2016– 2021) U.S. 242.2 250.0 260.1 305.4 3.3% Canada 58.7 60.3 62.5 72.0 2.9% Total 300.9 310.3 322.6 377.5 3.2% Source: Annual Reports, Press Releases, SEC Filings, Investor Presentations, Microscopy Society of America, Canadian Cytometry and Microscopy Association, Chinese Electron Microcopy Society, Australian Microscopy and Microanalysis Society, Journal of Microscopy, Journal of Advanced Microscopy Research, Expert Interviews, and MarketsandMarkets Analysis In 2016, the U.S. is expected to command the larger share of the North American microscopy market for material sciences. This segment is projected to reach USD 305.4 million by 2021 from USD 260.1 million in 2016, at a CAGR of 3.3% from 2016 to 2021.
  • 83.
    83 MICROSCOPY MARKET –GLOBAL FORECAST TO 2021 © MarketsandMarkets FIGURE 28 GERMANY TO WITNESS THE HIGHEST GROWTH RATE IN THE EUROPEAN MICROSCOPY MARKET FOR MATERIAL SCIENCES Source: Annual Reports, Press Releases, SEC Filings, Investor Presentations, Microscopy Society of America, Canadian Cytometry and Microscopy Association, Chinese Electron Microcopy Society, Australian Microscopy and Microanalysis Society, Journal of Microscopy, Journal of Advanced Microscopy Research, Expert Interviews, and MarketsandMarkets Analysis TABLE 48 EUROPE: MICROSCOPY MARKET SIZE FOR MATERIAL SCIENCES, BY COUNTRY/REGION, 2014–2021 (USD MILLION) Country/Region 2014 2015 2016 2021 CAGR (2016– 2021) Germany 63.6 68.4 73.9 104.8 7.3% U.K. 34.9 37.1 39.7 54.3 6.4% France 24.5 25.8 27.4 35.7 5.5% RoE 116.9 119.4 122.8 134.7 1.9% Total 239.9 250.6 263.7 329.5 4.6% Source: Annual Reports, Press Releases, SEC Filings, Investor Presentations, Microscopy Society of America, Canadian Cytometry and Microscopy Association, Chinese Electron Microcopy Society, Australian Microscopy and Microanalysis Society, Journal of Microscopy, Journal of Advanced Microscopy Research, Expert Interviews, and MarketsandMarkets Analysis In 2016, Germany is expected to command the largest share of the European microscopy market for material sciences. This country segment is projected to reach USD 104.8 million by 2021 from USD 73.9 million in 2016, at a CAGR of 7.3% from 2016 to 2021. Germany U.K. France RoE 2016 73.9 39.7 27.4 122.8 2021 104.8 54.3 35.7 134.7 CAGR 7.3% 6.4% 5.5% 1.9% 0 20 40 60 80 100 120 140 160 MarketSize(USDMillion)
  • 84.
    84 MICROSCOPY MARKET –GLOBAL FORECAST TO 2021 © MarketsandMarkets TABLE 49 ROW: MICROSCOPY MARKET SIZE FOR MATERIAL SCIENCES, BY COUNTRY/REGION, 2014–2021 (USD MILLION) Country/Region 2014 2015 2016 2021 CAGR (2016–2021) Brazil 35.7 37.2 39.1 48.4 4.4% Mexico 21.5 22.1 22.8 25.8 2.5% Argentina 8.1 8.5 9.0 11.6 5.1% RoLA 20.1 21.0 22.1 27.6 4.6% Total 85.4 88.8 93.0 113.4 4.1% Source: Annual Reports, Press Releases, SEC Filings, Investor Presentations, Microscopy Society of America, Canadian Cytometry and Microscopy Association, Chinese Electron Microcopy Society, Australian Microscopy and Microanalysis Society, Journal of Microscopy, Journal of Advanced Microscopy Research, Expert Interviews, and MarketsandMarkets Analysis In 2016, Brazil is expected to command the largest share of the RoW microscopy market for material sciences. This country segment is projected to reach USD 48.4 million by 2021 from USD 39.1 million in 2016, at a CAGR of 4.4% from 2016 to 2021. TABLE 50 MICROSCOPY MARKET SIZE FOR MATERIAL SCIENCES, BY PRODUCT, 2014–2021 (USD MILLION) Product 2014 2015 2016 2021 CAGR (2016–2021) Optical Microscopes 321.2 328.4 338.0 375.3 2.1% Electron Microscopes 301.7 324.8 351.9 508.3 7.6% Confocal Microscopes 75.6 78.7 83.0 99.7 3.7% SPM 114.7 117.9 122.0 137.8 2.5% Total 813.2 849.7 894.9 1,121.0 4.6% Source: Annual Reports, Press Releases, SEC Filings, Investor Presentations, Microscopy Society of America, Canadian Cytometry and Microscopy Association, Chinese Electron Microcopy Society, Australian Microscopy and Microanalysis Society, Journal of Microscopy, Journal of Advanced Microscopy Research, Expert Interviews, and MarketsandMarkets Analysis In 2016, the electron microscopes segment is expected to command the largest share of the microscopy market for material sciences. This segment is projected to reach USD 508.3 million by 2021 from USD 351.9 million in 2016, at the highest CAGR of 7.6% from 2016 to 2021.
  • 85.
    85 MICROSCOPY MARKET –GLOBAL FORECAST TO 2021 © MarketsandMarkets 7.5 NANOTECHNOLOGY The nanotechnology segment is expected to account for a share of 11.6% of the global microscopy applications market in 2016. Microscopy is the most widely-used technology for imaging, analyzing, and manipulating matter on a nanoscale. Increasing investment in nanotechnology, owing to ongoing technological advancements, is the major driver for this segment. Nanotechnology is the fastest-growing application segment in the microscopy market. High growth in this segment can be attributed to the wide array of nanotechnology applications across various industries such as electronics, information technology, food, chemical manufacturing, aerospace, textile, and pharmaceuticals. Furthermore, various federal initiatives to promote nanotechnology research across the globe are propelling growth of this segment. Since the year 2000, the field of nanotechnology has witnessed cumulative investment of over USD 65 billion from governments of various countries; by 2015, this figure is estimated to reach USD 0.25 trillion, including corporate and private-sector investment. The U.S. government provides the highest funding for nanotechnology research and development, and for the year 2014, it proposed a budget of USD 1.7 billion in NNI funding. The European Commission’s Seventh Framework Programme (FP7) allocated funds of around USD 69.4 billion to boost nanoscience-related programs in the region from 2007 to 2013. In 2014, a new funding initiative called Horizon 2020 was started for the next seven-year period (2014 to 2020). It is the largest EU research and innovation program, with a funding of approximately USD 107.6 billion (EUR 80 billion), in addition to private investment. Similarly, in 2007, the government of Russia founded the Russian Corporation of Nanotechnologies (RUSNANO) to establish a nanotechnology industry in Russia by 2015. TABLE 51 MICROSCOPY MARKET SIZE FOR NANOTECHNOLOGY, BY REGION, 2014–2021 (USD MILLION) Region 2014 2015 2016 2021 CAGR (2016–2021) North America 165.5 179.6 195.2 296.7 8.7% Europe 131.9 145.0 159.6 259.0 10.2% Asia-Pacific 102.9 115.8 130.4 236.3 12.6% RoW 47.0 51.4 56.3 89.1 9.6% Total 447.2 491.9 541.5 881.2 10.2% Source: Annual Reports, Press Releases, SEC Filings, Investor Presentations, Microscopy Society of America, Canadian Cytometry and Microscopy Association, Chinese Electron Microcopy Society, Australian Microscopy and Microanalysis Society, Journal of Microscopy, Journal of Advanced Microscopy Research, Expert Interviews, and MarketsandMarkets Analysis In 2016, North America is expected to command the largest share of the microscopy market for nanotechnology. This regional segment is projected to reach USD 296.7 million by 2021 from USD 195.2 million in 2016, at a CAGR of 8.7% from 2016 to 2021.
  • 86.
    86 MICROSCOPY MARKET –GLOBAL FORECAST TO 2021 © MarketsandMarkets TABLE 52 NORTH AMERICA: MICROSCOPY MARKET SIZE FOR NANOTECHNOLOGY, BY COUNTRY, 2014–2021 (USD MILLION) Country 2014 2015 2016 2021 CAGR (2016–2021) U.S. 133.2 144.7 157.4 240.1 8.8% Canada 32.3 34.9 37.8 56.6 8.4% Total 165.5 179.6 195.2 296.7 8.7% Source: Annual Reports, Press Releases, SEC Filings, Investor Presentations, Microscopy Society of America, Canadian Cytometry and Microscopy Association, Chinese Electron Microcopy Society, Australian Microscopy and Microanalysis Society, Journal of Microscopy, Journal of Advanced Microscopy Research, Expert Interviews, and MarketsandMarkets Analysis In 2016, the U.S. is expected to command the larger share of the North American microscopy market for nanotechnology. This country segment is projected to reach USD 240.1 million by 2021 from USD 157.4 million in 2016, at a higher CAGR of 8.8% from 2016 to 2021. TABLE 53 EUROPE: MICROSCOPY MARKET SIZE FOR NANOTECHNOLOGY, BY COUNTRY/REGION, 2014–2021 (USD MILLION) Country/Region 2014 2015 2016 2021 CAGR (2016–2021) Germany 35.0 39.6 44.7 82.4 13.0% U.K. 19.2 21.5 24.0 42.7 12.1% France 13.5 14.9 16.6 28.1 11.1% RoE 64.3 69.1 74.3 105.9 7.4% Total 131.9 145.0 159.6 259.0 10.2% Source: Annual Reports, Press Releases, SEC Filings, Investor Presentations, Microscopy Society of America, Canadian Cytometry and Microscopy Association, Chinese Electron Microcopy Society, Australian Microscopy and Microanalysis Society, Journal of Microscopy, Journal of Advanced Microscopy Research, Expert Interviews, and MarketsandMarkets Analysis In 2016, Germany is expected to command the largest share of the European microscopy market for nanotechnology. This country segment is projected to reach USD 82.4 million by 2021 from USD 44.7 million in 2016, at the highest CAGR of 13.0% from 2016 to 2021.
  • 87.
    87 MICROSCOPY MARKET –GLOBAL FORECAST TO 2021 © MarketsandMarkets FIGURE 29 BRAZIL TO ACCOUNT FOR THE LARGEST SHARE OF THE NANOTECHNOLOGY APPLICATIONS MARKET IN ROW Source: Annual Reports, Press Releases, SEC Filings, Investor Presentations, Microscopy Society of America, Canadian Cytometry and Microscopy Association, Chinese Electron Microcopy Society, Australian Microscopy and Microanalysis Society, Journal of Microscopy, Journal of Advanced Microscopy Research, Expert Interviews, and MarketsandMarkets Analysis TABLE 54 ROW: MICROSCOPY MARKET SIZE FOR NANOTECHNOLOGY, BY COUNTRY/REGION, 2014–2021 (USD MILLION) Country/Region 2014 2015 2016 2021 CAGR (2016–2021) Brazil 19.6 21.6 23.7 38.0 10.0% Mexico 11.8 12.8 13.8 20.3 8.1% Argentina 4.5 4.9 5.5 9.1 10.7% RoLA 11.0 12.1 13.4 21.7 10.2% Total 47.0 51.4 56.3 89.1 9.6% Source: Annual Reports, Press Releases, SEC Filings, Investor Presentations, Microscopy Society of America, Canadian Cytometry and Microscopy Association, Chinese Electron Microcopy Society, Australian Microscopy and Microanalysis Society, Journal of Microscopy, Journal of Advanced Microscopy Research, Expert Interviews, and MarketsandMarkets Analysis In 2016, Brazil is expected to command the largest share of the RoW microscopy market for nanotechnology. This country segment is projected to reach USD 38.0 million by 2021 from USD 23.7 million in 2016, at a CAGR of 10.0% from 2016 to 2021. Brazil Mexico Argentina RoLA 2016 23.7 13.8 5.5 13.4 2021 38.0 20.3 9.1 21.7 CAGR 10.0% 8.1% 10.7% 10.2% 0 5 10 15 20 25 30 35 40 MarketSize(USDMillion)
  • 88.
    88 MICROSCOPY MARKET –GLOBAL FORECAST TO 2021 © MarketsandMarkets TABLE 55 MICROSCOPY MARKET SIZE FOR NANOTECHNOLOGY, BY PRODUCT, 2014–2021 (USD MILLION) Product 2014 2015 2016 2021 CAGR (2016–2021) Optical Microscopes 176.7 190.1 204.5 295.0 7.6% Electron Microscopes 165.9 188.0 212.9 399.5 13.4% Confocal Microscopes 41.6 45.5 50.3 78.3 9.3% SPM 63.1 68.2 73.8 108.3 8.0% Total 447.2 491.9 541.5 881.2 10.2% Source: Annual Reports, Press Releases, SEC Filings, Investor Presentations, Microscopy Society of America, Canadian Cytometry and Microscopy Association, Chinese Electron Microcopy Society, Australian Microscopy and Microanalysis Society, Journal of Microscopy, Journal of Advanced Microscopy Research, Expert Interviews, and MarketsandMarkets Analysis In 2016, the electron microscopes segment is expected to command the largest share of the microscopy market for nanotechnology. This segment is projected to reach USD 399.5 million by 2021 from USD 212.9 million in 2016, at a CAGR of 13.4% from 2016 to 2021.
  • 89.
    89 MICROSCOPY MARKET –GLOBAL FORECAST TO 2021 © MarketsandMarkets 8 MICROSCOPY MARKET, BY END USER KEY FINDINGS  In 2016, the academic institutes segment is expected to account for the largest share of 52.2% of the global microscopy end-users market and is estimated to grow at a CAGR of 9.0% from 2016 to 2021  Worldwide increase in research expenditure, coupled with rise in research interest in cellular biology, oncology, neuroscience, and upcoming techniques such as optogenetics will accelerate growth of the academic institutes end-user segment  The industries segment is expected to account for the second-largest share of 30.3% of the global microscopy market in 2016  Rising focus on nanotechnology and development of customized microscopes are key drivers for growth of the industries end user segment  The other end users segment accounted for a share of 17.6% of the global microscopy market in 2016
  • 90.
    90 MICROSCOPY MARKET –GLOBAL FORECAST TO 2021 © MarketsandMarkets 8.1 INTRODUCTION Based on end users, the global microscopy market is segmented into academic institutes, industries, and other end users (government research institutes and private laboratories). The academic institutes segment is expected to dominate the market with a share of 52.2% in 2016. This large share can be attributed to growing research and development activities in life science and nanotechnology disciplines. Availability of government and corporate funding and technological innovations are other factors contributing to the growth of this market. FIGURE 30 ACADEMIC INSTITUTES TO DOMINATE THE MICROSCOPY MARKET IN 2016 *The other end users segment includes government research institutes and private laboratories. Source: Annual Reports, Press Releases, SEC Filings, Investor Presentations, Microscopy society of America, Canadian Cytometry and Microscopy Association, Chinese Electron Microcopy Society, Australian Microscopy and Microanalysis Society, Journal of Microscopy, Journal of advanced Microscopy Research, Expert Interviews, and MarketsandMarkets Analysis TABLE 56 MICROSCOPY MARKET SIZE, BY END USER, 2014–2021 (USD MILLION) End User 2014 2015 2016 2021 CAGR (2016–2021) Academic Institutes 2,059.7 2,241.0 2,443.9 3,758.1 9.0% Industries 1,249.8 1,330.3 1,418.7 1,958.8 6.7 % Other End Users* 756.2 787.2 822.8 1,009.7 4.2% Total 4,065.8 4,358.5 4,685.4 6,726.5 7.5% *The other end users segment includes government research institutes and private laboratories. Source: Annual Reports, Press Releases, SEC Filings, Investor Presentations, Microscopy society of America, Canadian Cytometry and Microscopy Association, Chinese Electron Microcopy Society, Australian Microscopy and Microanalysis Society, Journal of Microscopy, Journal of advanced Microscopy Research, Expert Interviews, and MarketsandMarkets Analysis In 2016, the academic institutes segment is expected to account for the largest share of the microscopy market. This end user segment is projected to reach USD 3,758.1 million by 2021 from USD 2,443.9 million in 2016, at the highest CAGR of 9.0% during the forecast period. Academic Institutes Industries Other End Users* 2016 2,443.9 1,418.7 822.8 2021 3,758.1 1,958.8 1,009.7 CAGR 9.0% 6.7% 4.2% 0 500 1,000 1,500 2,000 2,500 3,000 3,500 4,000 MarketSize(USDMillion)
  • 91.
    91 MICROSCOPY MARKET –GLOBAL FORECAST TO 2021 © MarketsandMarkets 8.2 ACADEMIC INSTITUTES Academic institutes are the major end users of microscopes. This segment primarily includes public-funded research carried out at universities and research centers. Academic research institutes are centers for innovation as well as basic research. In academic research institutes, microscopy finds applications in cancer studies, protein analysis, cellular biology studies, stem cell research, neuroscience, and optogenetics. The number of research studies that utilized microscopy articles published on PubMed, a repository of life science research articles, increased from 31,626 articles in 2010 to 36,139 articles in 2014. This is indicative of increasing demand of microscopes in academia. FIGURE 31 GROWTH IN NUMBER OF RESEARCH ACTIVITIES TO AID MARKET GROWTH FOR ACADEMIC INSTITUTES (2010–2014) Source: PubMed Growth in funding for life science research is a primary growth driver for this end-user segment. According to the World Bank, the overall funding for research and development worldwide increased from USD 739 billion in 2003 to USD 1,214 billion in 2010, at a CAGR of 7.34% between the two years. The U.S. accounted for the largest share of 37.27% of the global research and development expenditure in 2010. Research and development expenditure in the U.S. stood at USD 436 billion in 2010, and increased at a CAGR of 5.06% between 2003 and 2010. In China, research and development expenditure increased at the highest CAGR of 27.93%, from USD 19 billion in 2003 to USD 135 billion in 2010. Rapid increase in research expenditure worldwide, coupled with rise in research interest in cellular biology, oncology, neuroscience, and upcoming techniques such as optogenetics, will accelerate growth of the academic institutes end-user segment during the forecast period. 31,626 33,281 33,728 35,732 36,139 2010 2011 2012 2013 2014 No.ofResearchArticlesPublished
  • 92.
    92 MICROSCOPY MARKET –GLOBAL FORECAST TO 2021 © MarketsandMarkets Government funding to support research activities is also fueling growth in this end-user segment. In April 2013, the U.S. government launched the BRAIN Initiative with a projected cost of over USD 300 million per year for a period of ten years. Under this initiative, academic institutes will be responsible for various research efforts (for instance, the University of Pittsburg is creating a new university aimed at studying normal and abnormal brain functions). Moreover, collaborative research efforts between university research centers and microscopy manufacturing companies have fulfilled the need for capital investment in academic institutions. For instance, in June 2015, Carl Zeiss entered into a partnership with UC Berkeley as part of the Brain Microscopy Innovation Center (BrainMIC), Berkeley BRAIN Initiative. Under the partnership, Carl Zeiss will offer the latest updates of high-performance microscopes and imaging equipment and, in turn, UC Berkeley researchers will provide feedback on any new or special neurotechnology needs to help Carl Zeiss produce future products for latest advances in neuroscience research. Similarly, in October 2014, the University of California, and Carl Zeiss Microscopy entered into collaboration (worth USD 12 million) to support the Berkeley Brain Microscopy Innovation Center (BrainMIC) under the BRAIN initiative. Under this alliance, BrainMIC will develop microscopes for emerging neurotechnologies. In the European region, research activities at academic levels are greatly supporting innovation. The European Commission (EC) supports research and development in science and technology through the European Research Council (ERC). In 2014, the EC started a new funding initiative called Horizon 2020. Horizon 2020 aims at transforming Europe into a dynamic and competitive knowledge-based economy in the world. It is the largest EU research and innovation program with nearly USD 107.6 billion (EUR 80 billion) of funding in addition to private investment, available over seven years (2014 to 2020). Emerging economies of China, India, Brazil, and the Middle East are also focusing on research activities for growth. For instance, the King Abdulla University of Science and Technology (KAUST) in Saudi Arabia announced a research grant of USD 10 million to support research in nanotechnology. In May 2014, Tel Aviv University (Israel) and Tsinghua University (China) opened a joint research center named the XIN Center. The new research center, which costs USD 300 million, will initially focus on nanotechnology and life sciences to advance industrial innovation. FIGURE 32 ASIA-PACIFIC OFFERS LUCRATIVE GROWTH OPPORTUNITIES DURING THE FORECAST PERIOD Source: Annual Reports, Press Releases, SEC Filings, Investor Presentations, Microscopy society of America, Canadian Cytometry and Microscopy Association, Chinese Electron Microcopy Society, Australian Microscopy and Microanalysis Society, Journal of Microscopy, Journal of advanced Microscopy Research, Expert Interviews, and MarketsandMarkets Analysis North America Europe Asia-Pacific RoW 2016 881.0 720.2 588.7 253.9 2021 1,265.5 1,104.8 1,007.7 380.2 CAGR 7.5% 8.9% 11.3% 8.4% 0 200 400 600 800 1,000 1,200 1,400 MarketSize(USDMillion)
  • 93.
    93 MICROSCOPY MARKET –GLOBAL FORECAST TO 2021 © MarketsandMarkets TABLE 57 MICROSCOPY MARKET SIZE FOR ACADEMIC INSTITUTES, BY REGION, 2014–2021 (USD MILLION) Region 2014 2015 2016 2021 CAGR (2016–2021) North America 762.1 818.4 881.0 1,265.5 7.5% Europe 607.6 660.9 720.2 1,104.8 8.9% Asia-Pacific 473.7 527.5 588.7 1,007.7 11.3% RoW 216.3 234.2 253.9 380.2 8.4% Total 2,059.7 2,241.0 2,443.9 3,758.1 9.0% Source: Annual Reports, Press Releases, SEC Filings, Investor Presentations, Microscopy society of America, Canadian Cytometry and Microscopy Association, Chinese Electron Microcopy Society, Australian Microscopy and Microanalysis Society, Journal of Microscopy, Journal of advanced Microscopy Research, Expert Interviews, and MarketsandMarkets Analysis In 2016, North America is expected to account for the largest share of the microscopy market for academic institutes. This regional segment is projected to reach USD 1,265.5 million by 2021 from USD 881.0 million in 2016, at a CAGR of 7.5% from 2016 to 2021. TABLE 58 NORTH AMERICA: MICROSCOPY MARKET SIZE FOR ACADEMIC INSTITUTES, BY COUNTRY, 2014–2021 (USD MILLION) Country 2014 2015 2016 2021 CAGR (2016–2021) U.S. 613.5 659.3 710.3 1,024.0 7.6% Canada 148.6 159.1 170.7 241.4 7.2% Total 762.1 818.4 881.0 1,265.5 7.5% Source: Annual Reports, Press Releases, SEC Filings, Investor Presentations, Microscopy society of America, Canadian Cytometry and Microscopy Association, Chinese Electron Microcopy Society, Australian Microscopy and Microanalysis Society, Journal of Microscopy, Journal of advanced Microscopy Research, Expert Interviews, and MarketsandMarkets Analysis In 2016, the U.S. is expected to account for the larger share of the North American microscopy market for academic institutes. This country segment is projected to reach USD 1,024.0 million by 2021 from USD 710.3 million in 2016, at a higher CAGR of 7.6% from 2016 to 2021.
  • 94.
    94 MICROSCOPY MARKET –GLOBAL FORECAST TO 2021 © MarketsandMarkets TABLE 59 EUROPE: MICROSCOPY MARKET SIZE FOR ACADEMIC INSTITUTES, BY COUNTRY/REGION, 2014–2021 (USD MILLION) Country/Region 2014 2015 2016 2021 CAGR% (2016–2021) Germany 161.1 180.3 201.7 351.4 11.7% U.K. 88.3 97.8 108.5 181.9 10.9% France 62.1 68.0 74.8 119.7 9.9% RoE 296.2 314.8 335.2 451.7 6.1% Total 607.6 660.9 720.2 1,104.8 8.9% Source: Annual Reports, Press Releases, SEC Filings, Investor Presentations, Microscopy society of America, Canadian Cytometry and Microscopy Association, Chinese Electron Microcopy Society, Australian Microscopy and Microanalysis Society, Journal of Microscopy, Journal of advanced Microscopy Research, Expert Interviews, and MarketsandMarkets Analysis In 2016, Germany is expected to account for the largest share of the European microscopy market for academic institutes. This country segment is projected to reach USD 351.4 million by 2021 from USD 201.7 million in 2016, at a CAGR of 11.7% from 2016 to 2021 TABLE 60 ROW: MICROSCOPY MARKET SIZE FOR ACADEMIC INSTITUTES, BY COUNTRY/REGION, 2014 –2021 (USD MILLION) Country/Region 2014 2015 2016 2021 CAGR (2016–2021) Brazil 90.4 98.2 106.8 162.2 8.7% Mexico 54.5 58.2 62.2 86.6 6.8% Argentina 20.5 22.5 24.6 38.7 9.5% RoLA 50.8 55.3 60.3 92.6 9.0% Total 216.3 234.2 253.9 380.2 8.4% Source: Annual Reports, Press Releases, SEC Filings, Investor Presentations, Microscopy society of America, Canadian Cytometry and Microscopy Association, Chinese Electron Microcopy Society, Australian Microscopy and Microanalysis Society, Journal of Microscopy, Journal of advanced Microscopy Research, Expert Interviews, and MarketsandMarkets Analysis In 2016, Brazil is expected to account for the largest share of the RoW microscopy market for academic institutes. This country segment is projected to reach USD 162.2 million by 2021 from USD 106.8 million in 2016, at a CAGR of 8.7% from 2016 to 2021.
  • 95.
    95 MICROSCOPY MARKET –GLOBAL FORECAST TO 2021 © MarketsandMarkets 8.3 INDUSTRIES The industries end-user segment comprises biotechnology and pharmaceutical, semiconductor, textile, mining, and natural resources (such as oil and gas) industries. The rising focus on nanotechnology is a prime driver for biotechnology and pharmaceutical companies. In medicine, nanotechnology is majorly used in drug delivery, diagnostics, regenerative medicine, in vivo imaging, and anti-microbial techniques. Currently, more than 250 biotechnology and pharmaceutical companies are involved in nanomedicine research for achieving maximum therapeutic efficacy with minimal side effects. Examples of FDA-approved nanomedicines are Doxil (by Sequus Pharmaceuticals (U.S.) in 1995, drug is currently part of Johnson & Johnson (U.S.)) and Abraxane (by Abraxis Biosciences (U.S.) in 2005; currently part of Celgene Corporation (U.S.)). Also, in April 2013, BIND Therapeutics, a U.S.–based biopharmaceutical company, entered into a global collaboration agreement with Pfizer Inc. (U.S.) to develop and commercialize programmable nanoparticles called Accurins. Key companies in the microscopy market are concentrating on developing customized microscope modules and solutions to cater to the needs of various industries. In April 2016, Carl Zeiss launched ZEISS LSM 880, a confocal laser scanning microscope for material science and failure analysis. In July 2014, Carl Zeiss unveiled Mineralogic Mining, a mineral analysis solution for the mining industry. The new system comprises a scanning electron microscope with energy dispersive spectrometers to provide automated analysis, rapid reports, and high resolution maps. Similarly, Leica Microsystem (Germany) offers products such as Leica Z16 APO, Leica DM2700, and Leica DMS1000 for the energy, mining, and natural resources industry. The semiconductor industry is a major end user of advanced microscopes such as transmission electron microscope and multi-photon confocal microscope. Growing demand for miniature transistor chips and optoelectronics are major factors driving the microscopes market in the semiconductor industry. Microscopes are used for research and development, quality control, process development, and failure analysis. Eclipses LV150N, Eclipse LV150NL, and Eclipse L200N Series are examples of microscopes from Nikon for the semiconductor industry. FIGURE 33 NORTH AMERICA TO LEAD THE MICROSCOPY MARKET FOR INDUSTRIES DURING THE FORECAST PERIOD Source: Annual Reports, Press Releases, SEC Filings, Investor Presentations, Microscopy society of America, Canadian Cytometry and Microscopy Association, Chinese Electron Microcopy Society, Australian Microscopy and Microanalysis Society, Journal of Microscopy, Journal of advanced Microscopy Research, Expert Interviews, and MarketsandMarkets Analysis North America Europe Asia-Pacific RoW 2016 511.5 418.1 341.8 147.4 2021 659.6 575.8 525.2 198.2 CAGR 5.2% 6.6% 9.0% 6.1% 0 100 200 300 400 500 600 700 MarketSize(USDMillion)
  • 96.
    96 MICROSCOPY MARKET –GLOBAL FORECAST TO 2021 © MarketsandMarkets TABLE 61 MICROSCOPY MARKET SIZE FOR INDUSTRIES, BY REGION, 2014–2021 (USD MILLION) Region 2014 2015 2016 2021 CAGR (2016–2021) North America 462.4 485.8 511.5 659.6 5.2% Europe 368.7 392.3 418.1 575.8 6.6% Asia-Pacific 287.5 313.2 341.8 525.2 9.0% RoW 131.2 139.0 147.4 198.2 6.1% Total 1,249.8 1,330.3 1,418.7 1,958.8 6.7% Source: Annual Reports, Press Releases, SEC Filings, Investor Presentations, Microscopy society of America, Canadian Cytometry and Microscopy Association, Chinese Electron Microcopy Society, Australian Microscopy and Microanalysis Society, Journal of Microscopy, Journal of advanced Microscopy Research, Expert Interviews, and MarketsandMarkets Analysis In 2016, North America is expected to account for the largest share of the microscopy market for industries. This regional segment is projected to reach USD 659.6 million by 2021 from USD 511.5 million in 2016, at a CAGR of 5.2% from 2016 to 2021. TABLE 62 NORTH AMERICA: MICROSCOPY MARKET SIZE FOR INDUSTRIES, BY COUNTRY, 2014–2021 (USD MILLION) Country 2014 2015 2016 2021 CAGR (2016–2021) U.S. 372.3 391.4 412.3 533.7 5.3% Canada 90.2 94.4 99.1 125.8 4.9% Total 462.4 485.8 511.5 659.6 5.2% Source: Annual Reports, Press Releases, SEC Filings, Investor Presentations, Microscopy society of America, Canadian Cytometry and Microscopy Association, Chinese Electron Microcopy Society, Australian Microscopy and Microanalysis Society, Journal of Microscopy, Journal of advanced Microscopy Research, Expert Interviews, and MarketsandMarkets Analysis In 2016, the U.S. is expected to account the larger share of the North American microscopy market for industries. This country segment is projected to reach USD 533.7 million by 2021 from USD 412.3 million in 2016, at a CAGR of 5.3% from 2016 to 2021.
  • 97.
    97 MICROSCOPY MARKET –GLOBAL FORECAST TO 2021 © MarketsandMarkets TABLE 63 EUROPE: MICROSCOPY MARKET SIZE FOR INDUSTRIES, BY COUNTRY/REGION, 2014–2021 (USD MILLION) Country/Region 2014 2015 2016 2021 CAGR (2016–2021) Germany 97.7 107.0 117.1 183.2 9.4% U.K. 53.6 58.1 63.0 94.8 8.5% France 37.7 40.4 43.4 62.4 7.5% RoE 179.7 186.9 194.6 235.4 3.9% Total 368.7 392.3 418.1 575.8 6.6% Source: Annual Reports, Press Releases, SEC Filings, Investor Presentations, Microscopy society of America, Canadian Cytometry and Microscopy Association, Chinese Electron Microcopy Society, Australian Microscopy and Microanalysis Society, Journal of Microscopy, Journal of advanced Microscopy Research, Expert Interviews, and MarketsandMarkets Analysis In 2016, Germany is expected to account for the largest share of the European microscopy market for industries. This country segment is projected to reach USD 183.2 million by 2021 from USD 117.1 million in 2016, at the highest CAGR of 9.4% from 2016 to 2021. TABLE 64 ROW: MICROSCOPY MARKET SIZE FOR INDUSTRIES, BY COUNTRY/REGION, 2014–2021 (USD MILLION) Country/Region 2014 2015 2016 2021 CAGR% (2016–2021) Brazil 54.9 58.3 62.0 84.6 6.4% Mexico 33.1 34.5 36.1 45.2 4.6% Argentina 12.5 13.3 14.3 20.2 7.1% RoLA 30.8 32.8 35.0 48.3 6.6% Total 131.2 139.0 147.4 198.2 6.1% Source: Annual Reports, Press Releases, SEC Filings, Investor Presentations, Microscopy society of America, Canadian Cytometry and Microscopy Association, Chinese Electron Microcopy Society, Australian Microscopy and Microanalysis Society, Journal of Microscopy, Journal of advanced Microscopy Research, Expert Interviews, and MarketsandMarkets Analysis In 2016, Brazil is expected to account for the largest share of the RoW microscopy market for industries. This country segment is projected to reach USD 84.6 million by 2021 from USD 62.0 million in 2016, at a CAGR of 6.4% from 2016 to 2021.
  • 98.
    98 MICROSCOPY MARKET –GLOBAL FORECAST TO 2021 © MarketsandMarkets 8.4 OTHER END USERS (GOVERNMENT RESEARCH INSTITUTIONS AND PRIVATE LABORATORIES) The other end users segment includes government research institutions and private laboratories. Government research institutes such as National Institute of Health (NIH, U.S.), National Cancer Institute (NCI, U.S.), National Institute of Health and Nutrition (NIHN, Japan), and Oak Ridge National Laboratory (ORNL, U.S.) are some pioneer research institutes actively involved in a number of research and development programs that augment demand of microscopes. Private laboratories include contract research organizations (CROs) and diagnostic and pathology laboratories. CROs act as outsourcing partners for pharmaceutical and biotechnology companies and academic research institutes. The microscopy services portfolio of CROs include services such as routine and non-routine microscopy, image testing, experimentation, research projects, and development studies. Factors such as high capital investment, dearth of trained staff for research, and reluctance of companies to invest in changing technologies have increased the need for outsourcing microscopy and imaging services by pharmaceutical companies and other industries. FIGURE 34 NORTH AMERICA IS EXPECTED TO DOMINATE THE MICROSCOPY MARKET FOR OTHER END USERS Source: Annual Reports, Press Releases, SEC Filings, Investor Presentations, Microscopy society of America, Canadian Cytometry and Microscopy Association, Chinese Electron Microcopy Society, Australian Microscopy and Microanalysis Society, Journal of Microscopy, Journal of advanced Microscopy Research, Expert Interviews, and MarketsandMarkets Analysis North America Europe Asia-Pacific RoW 2016 296.6 242.5 198.2 85.5 2021 340.0 296.8 270.7 102.1 CAGR 2.8% 4.1% 6.4% 3.6% 0 50 100 150 200 250 300 350 400 MarketSize(USDMillion)
  • 99.
    99 MICROSCOPY MARKET –GLOBAL FORECAST TO 2021 © MarketsandMarkets TABLE 65 MICROSCOPY MARKET SIZE FOR OTHER END USERS, BY REGION, 2014–2021 (USD MILLION) Region 2014 2015 2016 2021 CAGR (2016–2021) North America 279.8 287.5 296.6 340.0 2.8% Europe 223.1 232.1 242.5 296.8 4.1% Asia-Pacific 173.9 185.3 198.2 270.7 6.4% RoW 79.4 82.3 85.5 102.1 3.6% Total 756.2 787.2 822.8 1,009.7 4.2% Source: Annual Reports, Press Releases, SEC Filings, Investor Presentations, Microscopy society of America, Canadian Cytometry and Microscopy Association, Chinese Electron Microcopy Society, Australian Microscopy and Microanalysis Society, Journal of Microscopy, Journal of advanced Microscopy Research, Expert Interviews, and MarketsandMarkets Analysis In 2016, North America is expected to account for the largest share of the microscopy market for other end users. This regional segment is projected to reach USD 340.0 million by 2021 from USD 296.6 million in 2016, at a CAGR of 2.8% from 2016 to 2021. TABLE 66 NORTH AMERICA: MICROSCOPY MARKET SIZE FOR OTHER END USERS, BY COUNTRY, 2014 –2021 (USD MILLION) Country 2014 2015 2016 2021 CAGR% (2016–2021) U.S. 225.2 231.6 239.1 275.1 2.8% Canada 54.6 55.9 57.5 64.9 2.4% Total 279.8 287.5 296.6 340.0 2.8% Source: Annual Reports, Press Releases, SEC Filings, Investor Presentations, Microscopy society of America, Canadian Cytometry and Microscopy Association, Chinese Electron Microcopy Society, Australian Microscopy and Microanalysis Society, Journal of Microscopy, Journal of advanced Microscopy Research, Expert Interviews, and MarketsandMarkets Analysis In 2016, the U.S. is expected to account for the larger share of the North American microscopy market for other end users. This country segment is projected to reach USD 275.1 million by 2021 from USD 239.1 million in 2016, at a CAGR of 2.8% from 2016 to 2021.
  • 100.
    100 MICROSCOPY MARKET –GLOBAL FORECAST TO 2021 © MarketsandMarkets TABLE 67 EUROPE: MICROSCOPY MARKET SIZE FOR OTHER END USERS, BY COUNTRY/REGION, 2014 –2021 (USD MILLION) Country/Region 2014 2015 2016 2021 CAGR (2016–2021) Germany 59.1 63.3 67.9 94.4 6.8% U.K. 32.4 34.4 36.5 48.9 6.0% France 22.8 23.9 25.2 32.2 5.0% RoE 108.7 110.6 112.9 121.4 1.5% Total 223.1 232.1 242.5 296.8 4.1% Source: Annual Reports, Press Releases, SEC Filings, Investor Presentations, Microscopy society of America, Canadian Cytometry and Microscopy Association, Chinese Electron Microcopy Society, Australian Microscopy and Microanalysis Society, Journal of Microscopy, Journal of advanced Microscopy Research, Expert Interviews, and MarketsandMarkets Analysis In 2016, Germany is expected to account for the largest share of the European microscopy market for other end users. This regional segment is projected to reach USD 94.4 million by 2021 from USD 67.9 million in 2016, at the highest CAGR of 6.8% from 2016 to 2021. TABLE 68 ROW: MICROSCOPY MARKET SIZE FOR OTHER END USERS, BY COUNTRY/REGION, 2014–2021 (USD MILLION) Country/Region 2014 2015 2016 2021 CAGR (2016–2021) Brazil 33.2 34.5 35.9 43.6 3.9% Mexico 20.0 20.4 21.0 23.3 2.1% Argentina 7.5 7.9 8.3 10.4 4.7% RoLA 18.7 19.4 20.3 24.9 4.2% Total 79.4 82.3 85.5 102.1 3.6% Source: Annual Reports, Press Releases, SEC Filings, Investor Presentations, Microscopy society of America, Canadian Cytometry and Microscopy Association, Chinese Electron Microcopy Society, Australian Microscopy and Microanalysis Society, Journal of Microscopy, Journal of advanced Microscopy Research, Expert Interviews, and MarketsandMarkets Analysis In 2016, Brazil is expected to account for the largest share of the RoW microscopy market for other end users. This country segment is projected to reach USD 43.6 million by 2021 from USD 35.9 million in 2016, at a CAGR of 3.9% from 2016 to 2021.
  • 101.
    101 MICROSCOPY MARKET –GLOBAL FORECAST TO 2021 © MarketsandMarkets 9 MICROSCOPY MARKET, BY REGION KEY FINDINGS  North America is expected to account for the largest share of 36.1% of the microscopy market in 2016. This regional segment is expected to reach USD 2,265.1 million by 2021  Technological advancements; favorable government funding; and growing inclination toward nanotechnology are key drivers for the North American microscopy market  The Asia-Pacific microscopy market is estimated to grow at the highest CAGR of 9.8% during the forecast period, and is expected to reach USD 1,803.6 million by 2021  Europe is expected to account for the second-largest share of 29.5% of the microscopy market in 2016. This regional segment is expected to reach USD 1,977.4 million by 2021 from USD 1,380.8 million in 2016  The RoW is expected to account for 10.4% of the microscopy market in 2016. This regional segment is expected to reach USD 680.5 million by 2021 from USD 486.8 million in 2016
  • 102.
    102 MICROSCOPY MARKET –GLOBAL FORECAST TO 2021 © MarketsandMarkets 9.1 INTRODUCTION In this research report, the microscopy market has been divided into four major regions— North America, Europe, Asia-Pacific, and the Rest of the World (RoW). The global microscopy market is expected to be valued at an estimated USD 4,685.4 million in 2016, with North America accounting for the largest share (36.1%), followed by Europe (29.5%). The major drivers for growth of this market are availability of government and private funding, growing focus on nanotechnology, and technological advancements in this market. On the other hand, high cost of advanced microscopes, implementation of excise tax by the U.S. government, huge custom duties charged (nearly 28%) on medical devices in countries such as India and Brazil, and the economic downturn in European countries are hindering market growth. Emerging markets such as China, India, Brazil, and the Middle East are expected to present significant growth opportunities for stakeholders. In addition, new application areas such as optogenetics; nanomedicine; quantum dots; nanoelectronics and nanocrystalline materials; and the combination of microscopy with spectroscopy; are further expected to drive the market in the coming years. FIGURE 35 GEOGRAPHIC SNAPSHOT: ASIA-PACIFIC TO GROW AT THE FASTEST RATE DURING THE FORECAST PERIOD Source: Annual Reports, Press Releases, SEC Filings, Investor Presentations, Expert Interviews, and MarketsandMarkets Analysis Asia-Pacific 9.8% Rest of the World 6.9% Europe 7.4%North America 6.0% >7.0% High Growth 6.0%-7.0% Medium Growth
  • 103.
    103 MICROSCOPY MARKET –GLOBAL FORECAST TO 2021 © MarketsandMarkets FIGURE 36 ASIA-PACIFIC OFFERS SIGNIFICANT GROWTH OPPORTUNITIES FOR ALL MICROCOPY PRODUCT CATEGORIES DURING THE FORECAST PERIOD Source: Annual Reports, Press Releases, SEC Filings, Investor Presentations, Expert Interviews, and MarketsandMarkets Analysis TABLE 69 MICROSCOPY MARKET SIZE, BY REGION, 2014–2021 (USD MILLION) Region 2014 2015 2016 2021 CAGR (2016–2021) North America 1,504.3 1,591.8 1,689.1 2,265.1 6.0% Europe 1,199.4 1,285.3 1,380.8 1,977.4 7.4% Asia-Pacific 935.1 1,026.0 1,128.7 1,803.6 9.8% RoW 426.9 455.5 486.8 680.5 6.9% Total 4,065.8 4,358.6 4,685.4 6,726.5 7.5% Source: Annual Reports, Press Releases, SEC Filings, Investor Presentations, Microscopy Society of America, Canadian Cytometry and Microscopy Association, Chinese Electron Microcopy Society, Australian Microscopy and Microanalysis Society, Journal of Microscopy, Journal of Advanced Microscopy Research, Expert Interviews, and MarketsandMarkets Analysis North America is expected to account for the largest share of the global microscopy market in 2016. This regional segment is projected to reach USD 2,265.1 million by 2021 from USD 1,689.1 million in 2016, at a CAGR of 6.0% from 2016 to 2021. AFRICA EUROPE ASIA-PACIFICNORTH AMERICA RoWPRODUCT HIGH 8.1%-10.9% MEDIUM 5.1%-7.9% CAGR (%) from 2016 to 2021 VERY HIGH 11.1%-13.9% OPTICAL MICROSCOPES ELECTRON MICROSCOPES CONFOCAL MICROSCOPES SCANNING PROBE MICROSCOPES SLOW <5
  • 104.
    104 MICROSCOPY MARKET –GLOBAL FORECAST TO 2021 © MarketsandMarkets 9.2 NORTH AMERICA In 2016, North America is expected to account for the largest share of 36.1% of the global microscopy market. North America comprises the U.S. and Canada. The U.S. is expected to account for approximately 81% of the microscopy market by the end of 2016, while Canada is expected to account for the remaining approximately 19%. Factors such as increasing investment in nanotechnology research in the U.S. and Canada are responsible for driving market growth in North America. Globally, the U.S. government is the major contributor to nanotechnology research and development funding. In 2000, the Federal government launched the National Nanotechnology Initiative (NNI) and allocated funds worth approximately USD 17.9 billion for nanotechnology research and development from 2001 to 2013. For 2016, the government proposed a budget of USD 1.5 billion in NNI funding. Nearly 1,200 organizations (companies, universities, and government laboratories) across the U.S. are involved in the research, development, and commercialization of nanotechnology-based products. Since 2009, there has been a 50% rise in the number of nanotechnology organizations operating in the U.S. States such as California, Massachusetts, New York, Texas, and Ohio have the highest number of nanotechnology organizations in the country. The U.S. Department of Energy (DOE) has also opened five facilities, called Nanoscale Science Research Centers (NSRCs), around the country that are involved in the development and characterization of novel nanomaterials. These centers are:  The Argonne National Laboratory in Illinois  The Brookhaven National Laboratory in New York  The Lawrence Berkeley National Laboratory in California  The Oak Ridge National Laboratory in Tennessee  The Sandia National Laboratories in New Mexico Canada is a potential market for microscopy owing to government support and growing academic excellence. The Canadian government works in close association with provincial governments, universities, and national institutes to support and promote nanotechnology-based research and development programs across the nation. Nearly 200 companies are engaged in nanotechnology-related businesses in Canada. Major nanotechnology industries are concentrated in the Canadian provinces of Alberta, British Columbia, Ontario, and Quebec. The major companies operating in this region are Bruker (U.S.), Carl Zeiss AG (Germany), FEI Co. (U.S.), Leica Microsystems (Germany), Nikon (Japan), Olympus Corporation (Japan), and Tescan (The Czech Republic).
  • 105.
    105 MICROSCOPY MARKET –GLOBAL FORECAST TO 2021 © MarketsandMarkets FIGURE 37 NORTH AMERICA: MICROSCOPY MARKET SNAPSHOT, 2016 Source: Annual Reports, Press Releases, SEC Filings, Investor Presentations, Microscopy Society of America, Canadian Cytometry and Microscopy Association, Chinese Electron Microcopy Society, Australian Microscopy and Microanalysis Society, Journal of Microscopy, Journal of Advanced Microscopy Research, Expert Interviews, and MarketsandMarkets Analysis NORTH AMERICA NORTH AMERICA: MICROSCOPY MARKET SIZE, BY END USER, 2016 vs 2021 (USD MILLION) NORTH AMERICA: MICROSCOPY MARKET, BY COUNTRY, 2016 COUNTRY MARKET SIZE (USD MILLION) CAGR (2016-2021) U.S. 1,361.8 6.1% Canada 327.3 5.7% NORTH AMERICA: MICROSCOPY MARKET FACTORSSUPPORTING THE GROWTH OF THE MICROSCOPYMARKET IN NORTH AMERICA • Increasing investments in nanotechnology research • Favorable government support and growing academic excellence NORTH AMERICA: MICROSCOPY MARKET SIZE, BY APPLICATION, 2016 (USD MILLION) North America to account for 36.1% of the global microscopy market in 2016 U.S. to command ~81% of the North American microscopy market in 2016 SEMICONDUCTORS LIFE SCIENCES USD 592.7 Million USD 578.5 Million Canada to hold ~19% of the North American microscopy market in 2016 The market in the U.S. is expected to grow at a higher CAGR of 6.1% (2016–2021) MATERIAL SCIENCES NANOTECHNOLOGY USD 322.6 Million USD 195.2 Million 881.0 511.5 296.6 1,265.5 659.6 340.0 Academic Institutes Industries Others* 2016 2021
  • 106.
    106 MICROSCOPY MARKET –GLOBAL FORECAST TO 2021 © MarketsandMarkets TABLE 70 NORTH AMERICA: MICROSCOPY MARKET SIZE, BY PRODUCT, 2014-2021 (USD MILLION) Product 2014 2015 2016 2021 CAGR (2016–2021) Optical Microscopes 594.2 615.2 638.0 758.3 3.5% Electron Microscopes 558.1 608.4 664.1 1,027.0 9.1% SPM 212.1 220.8 230.2 278.4 3.9% Confocal Microscopes 139.9 147.4 156.7 201.4 5.1% Total 1,504.3 1,591.8 1,689.1 2,265.1 6.0% Source: Annual Reports, Press Releases, SEC Filings, Investor Presentations, Microscopy Society of America, Canadian Cytometry and Microscopy Association, Chinese Electron Microcopy Society, Australian Microscopy and Microanalysis Society, Journal of Microscopy, Journal of Advanced Microscopy Research, Expert Interviews, and MarketsandMarkets Analysis In 2016, the electron microscopes segment is expected to account for the largest share of the North American microscopy market. This product segment is projected to reach USD 1,027.0 million by 2021 from USD 664.1 million in 2016, at a CAGR of 9.1% during the forecast period. TABLE 71 NORTH AMERICA: OPTICAL MICROSCOPES MARKET SIZE, BY TYPE, 2014-2021 (USD MILLION) Type 2014 2015 2016 2021 CAGR (2016–2021) Fluorescence Microscopes 442.7 448.2 455.1 475.9 0.9% Super-resolution Microscopes 151.5 167.0 182.9 282.5 9.1% Total 594.2 615.2 638.0 758.3 3.5% Source: Annual Reports, Press Releases, SEC Filings, Investor Presentations, Microscopy Society of America, Canadian Cytometry and Microscopy Association, Chinese Electron Microcopy Society, Australian Microscopy and Microanalysis Society, Journal of Microscopy, Journal of Advanced Microscopy Research, Expert Interviews, and MarketsandMarkets Analysis In 2016, the fluorescence microscopes segment is expected to account for the larger share of the North American optical microscopes market. This segment is projected to reach USD 475.9 million by 2021 from USD 455.1 million in 2016, at a CAGR of 0.9% during the forecast period. TABLE 72 NORTH AMERICA: ELECTRON MICROSCOPES MARKET SIZE, BY TYPE, 2014-2021 (USD MILLION) Type 2014 2015 2016 2021 CAGR (2016–2021) SEM 435.9 475.7 520.0 809.2 9.2% Transmission Electron Microscopes 122.2 132.6 144.1 217.7 8.6% Total 558.1 608.4 664.1 1,027.0 9.1% Source: Annual Reports, Press Releases, SEC Filings, Investor Presentations, Microscopy Society of America, Canadian Cytometry and Microscopy Association, Chinese Electron Microcopy Society, Australian Microscopy and Microanalysis Society, Journal of Microscopy, Journal of Advanced Microscopy Research, Expert Interviews, and MarketsandMarkets Analysis In 2016, the SEM segment is expected to account for the larger share of the electron microscopes market in North America. This segment is projected to reach USD 809.2 million by 2021 from USD 520.0 million in 2016, at a CAGR of 9.2% during the forecast period.
  • 107.
    107 MICROSCOPY MARKET –GLOBAL FORECAST TO 2021 © MarketsandMarkets TABLE 73 NORTH AMERICA: SPM MARKET SIZE, BY TYPE, 2014-2021 (USD MILLION) Type 2014 2015 2016 2021 CAGR (2016–2021) STM 146.1 152.0 158.5 191.5 3.9% AFM 55.7 58.0 60.5 73.3 3.9% Near-field Scanning Microscopes 10.3 10.7 11.1 13.5 4.0% Total 212.1 220.8 230.2 278.4 3.9% Source: Annual Reports, Press Releases, SEC Filings, Investor Presentations, Microscopy Society of America, Canadian Cytometry and Microscopy Association, Chinese Electron Microcopy Society, Australian Microscopy and Microanalysis Society, Journal of Microscopy, Journal of Advanced Microscopy Research, Expert Interviews, and MarketsandMarkets Analysis In 2016, the STM segment is expected to account for the largest share of the SPM market in North America. This segment is projected to reach USD 191.5 million by 2021 from USD 158.5 million in 2016, at a CAGR of 3.9% during the forecast period. TABLE 74 NORTH AMERICA: MICROSCOPY MARKET SIZE, BY APPLICATION, 2014-2021 (USD MILLION) Application 2014 2015 2016 2021 CAGR (2016–2021) Semiconductors 526.5 558.4 592.7 798.5 6.1% Life Sciences 511.5 543.4 578.5 792.4 6.5% Material Sciences 300.9 310.3 322.6 377.5 3.2% Nanotechnology 165.5 179.6 195.2 296.7 8.7% Total 1,504.3 1,591.8 1,689.1 2,265.1 6.0% Source: Annual Reports, Press Releases, SEC Filings, Investor Presentations, Microscopy Society of America, Canadian Cytometry and Microscopy Association, Chinese Electron Microcopy Society, Australian Microscopy and Microanalysis Society, Journal of Microscopy, Journal of Advanced Microscopy Research, Expert Interviews, and MarketsandMarkets Analysis In 2016, the semiconductors segment is expected to account for the largest share of the microscopy market in North America. This application segment is projected to reach USD 798.5 million by 2021 from USD 592.7 million in 2016, at a CAGR of 6.1% during the forecast period.
  • 108.
    108 MICROSCOPY MARKET –GLOBAL FORECAST TO 2021 © MarketsandMarkets TABLE 75 NORTH AMERICA: MICROSCOPY MARKET SIZE, BY END USER, 2014-2021 (USD MILLION) End User 2014 2015 2016 2021 CAGR (2016–2021) Academic Institutes 762.1 818.4 881.0 1,265.5 7.5% Industries 462.4 485.8 511.5 659.6 5.2% Other End Users* 279.8 287.5 296.6 340.0 2.8% Total 1,504.3 1,591.7 1,689.1 2,265.1 6.0% *Note: The other end users segment includes government research institutes and private laboratories. Source: Annual Reports, Press Releases, SEC Filings, Investor Presentations, Microscopy Society of America, Canadian Cytometry and Microscopy Association, Chinese Electron Microcopy Society, Australian Microscopy and Microanalysis Society, Journal of Microscopy, Journal of Advanced Microscopy Research, Expert Interviews, and MarketsandMarkets Analysis In 2016, the academic institutes segment is expected to account for the largest share of the microscopy market in North America. This end-user segment is projected to reach USD 1,265.5 million by 2021 from USD 881.0 million in 2016, at the highest CAGR of 7.5% during the forecast period. TABLE 76 NORTH AMERICA: MICROSCOPY MARKET SIZE, BY COUNTRY, 2014-2021 (USD MILLION) Country 2014 2015 2016 2021 CAGR (2016–2021) U.S. 1,211.0 1,282.3 1,361.8 1,832.9 6.1% Canada 293.3 309.4 327.3 432.2 5.7% Total 1,504.3 1,591.7 1,689.1 2,265.0 6.0% Source: Annual Reports, Press Releases, SEC Filings, Investor Presentations, Microscopy Society of America, Canadian Cytometry and Microscopy Association, Chinese Electron Microcopy Society, Australian Microscopy and Microanalysis Society, Journal of Microscopy, Journal of Advanced Microscopy Research, Expert Interviews, and MarketsandMarkets Analysis The U.S. is expected to account for the larger share of the North American microscopy market in 2016. This segment is projected to reach USD 1,832.9 million by 2021 from USD 1,361.8 million in 2016, at a CAGR of 6.1% from 2016 to 2021. 9.2.1 U.S. The U.S. is expected to account for the larger share of the North American microscopy market in 2016. Factors such as a favorable government funding environment and growing focus on nanotechnology are major drivers for this market. In addition to nanotechnology, the U.S. is also a world leader in pharmaceutical and biotechnology research, accounting for around one-third of research and development investment globally. The country is also prominent in the chemical industry sector. The presence of strong nanotechnology and life sciences research and development infrastructure is a key factor driving microscopy market in the U.S. However, from January 2013, the U.S. government imposed an excise tax of 2.3% on Class I, II, and III medical devices, under the Patient Protection and Affordable Care Act (PPACA). This tax is applicable for all medical devices manufactured or imported in the U.S. Due to this, the market for some automated medical devices, including medical imaging equipment (such as microscopes), will be affected in the U.S. This tax will result in lower profits for manufacturers as well as lower reimbursements from payers for procedures that use these devices. This may hinder growth of the U.S. microscopy market. As the U.S. accounts for a major share of the global microscopy market, this move is also expected to affect the global market.
  • 109.
    109 MICROSCOPY MARKET –GLOBAL FORECAST TO 2021 © MarketsandMarkets TABLE 77 U.S.: MICROSCOPY MARKET SIZE, BY PRODUCT, 2014-2021 (USD MILLION) Product 2014 2015 2016 2021 CAGR (2016–2021) Optical Microscopes 478.3 495.6 514.3 613.7 3.6% Electron Microscopes 449.3 490.1 535.4 831.0 9.2% SPM 170.8 177.9 185.6 225.3 3.9% Confocal Microscopes 112.6 118.7 126.4 162.9 5.2% Total 1,211.0 1,282.3 1,361.8 1,832.9 6.1% Source: Annual Reports, Press Releases, SEC Filings, Investor Presentations, Microscopy Society of America, Canadian Cytometry and Microscopy Association, Chinese Electron Microcopy Society, Australian Microscopy and Microanalysis Society, Journal of Microscopy, Journal of Advanced Microscopy Research, Expert Interviews, and MarketsandMarkets Analysis In 2016, the electron microscopes segment is expected to account for the largest share of the microscopy market in the U.S. This product segment is projected to reach USD 831.0 million by 2021 from USD 535.4 million in 2016, at the highest CAGR of 9.2% during the forecast period. FIGURE 38 SEMICONDUCTORS APPLICATION SEGMENT TO DOMINATE THE U.S. MICROSCOPY MARKET DURING THE FORECAST PERIOD Source: Annual Reports, Press Releases, SEC Filings, Investor Presentations Expert Interviews, and MarketsandMarkets Analysis Semiconductors Life Sciences Material Sciences Nanotechnology 2016 477.9 466.4 260.1 157.4 2021 646.1 641.2 305.4 240.1 CAGR 6.2% 6.5% 3.2% 8.8% 0 100 200 300 400 500 600 700 MarketSize(USDMillion)
  • 110.
    110 MICROSCOPY MARKET –GLOBAL FORECAST TO 2021 © MarketsandMarkets TABLE 78 U.S.: MICROSCOPY MARKET SIZE, BY APPLICATION, 2014-2021 (USD MILLION) Application 2014 2015 2016 2021 CAGR (2016–2021) Semiconductors 423.8 449.8 477.9 646.1 6.2% Life Sciences 411.7 437.8 466.4 641.2 6.6% Material Sciences 242.2 250.0 260.1 305.4 3.3% Nanotechnology 133.2 144.7 157.4 240.1 8.8% Total 1,211.0 1,282.3 1,361.7 1,832.9 6.1% Source: Annual Reports, Press Releases, SEC Filings, Investor Presentations, Microscopy Society of America, Canadian Cytometry and Microscopy Association, Chinese Electron Microcopy Society, Australian Microscopy and Microanalysis Society, Journal of Microscopy, Journal of Advanced Microscopy Research, Expert Interviews, and MarketsandMarkets Analysis In 2016, the semiconductors segment is expected to account for the largest share of the microscopy market in the U.S. This application segment is projected to reach USD 646.1 million by 2021 from USD 477.9 million in 2016, at a CAGR of 6.2% during the forecast period. TABLE 79 U.S.: MICROSCOPY MARKET SIZE, BY END USER, 2014-2021 (USD MILLION) End User 2014 2015 2016 2021 CAGR (2016–2021) Academic Institutes 613.5 659.3 710.3 1,024.0 7.6% Industries 372.3 391.4 412.3 533.7 5.3% Other End Users 225.2 231.6 239.1 275.1 2.8% Total 1,211.0 1,282.3 1,361.7 1,832.9 6.1% Source: Annual Reports, Press Releases, SEC Filings, Investor Presentations, Microscopy Society of America, Canadian Cytometry and Microscopy Association, Chinese Electron Microcopy Society, Australian Microscopy and Microanalysis Society, Journal of Microscopy, Journal of Advanced Microscopy Research, Expert Interviews, and MarketsandMarkets Analysis In 2016, the academic institutes segment is expected to account for the largest share of the microscopy market in the U.S. This end-user segment is projected to reach USD 1,024.0 million by 2021 from USD 710.3 million in 2016, at the highest CAGR of 7.6% during the forecast period. 9.2.2 CANADA In Canada, nanotechnology research and development programs are led by the Federal government, provincial governments, universities, and national institutes. For instance, nine institutes of the National Research Council (NRC) are conducting research and development activities in nanotechnology, and around 200 companies are engaged in nanotechnology-related businesses in Canada. In 2001, the National Institute of Nanotechnology (NINT) was established as a joint venture between the Federal government, the Alberta provincial government, and the University of Alberta to support and boost nanotechnology research and economic development in the province. Similarly, provincial initiatives such as NanoQuébec and nanoFAB are driving growth of nanotechnology infrastructure in Canada. NanoQuébec is a consortium of six universities and research centers in Quebec that offer technology support to local small and medium-sized enterprises (SMEs) dealing in nanotechnology. nanoFAB is an open-access fabrication and characterization facility that provides equipment, infrastructure, and assistance to local microelectromechanical systems (MEMS) industries and nanotechnology researchers.
  • 111.
    111 MICROSCOPY MARKET –GLOBAL FORECAST TO 2021 © MarketsandMarkets Furthermore, a Federal government interdepartmental network was established in 2003 for promoting nanotechnology in the region. The Natural Sciences and Engineering Research Council of Canada (NSERC), the Canadian Institutes of Health Research (CIHR), and the Canada Foundation for Innovation (CFI) also allocate funds to promote research in nanotechnology. TABLE 80 CANADA: MICROSCOPY MARKET SIZE, BY PRODUCT, 2014-2021 (USD MILLION) Product 2014 2015 2016 2021 CAGR (2016–2021) Optical Microscopes 115.9 119.6 123.6 144.7 3.2% Electron Microscopes 108.8 118.3 128.7 195.9 8.8% SPM 41.4 42.9 44.6 53.1 3.5% Confocal Microscopes 27.3 28.7 30.4 38.4 4.8% Total 293.3 309.4 327.3 432.2 5.7% Source: Annual Reports, Press Releases, SEC Filings, Investor Presentations, Microscopy Society of America, Canadian Cytometry and Microscopy Association, Chinese Electron Microcopy Society, Australian Microscopy and Microanalysis Society, Journal of Microscopy, Journal of Advanced Microscopy Research, Expert Interviews, and MarketsandMarkets Analysis In 2016, the electron microscopes segment is expected to account for the largest share of the microscopy market in Canada. This segment is projected to reach USD 195.9 million by 2021 from USD 128.7 million in 2016, at the highest CAGR of 8.8% during the forecast period. TABLE 81 CANADA: MICROSCOPY MARKET SIZE, BY APPLICATION, 2014-2021 (USD MILLION) Application 2014 2015 2016 2021 CAGR (2016–2021) Semiconductors 102.7 108.5 114.9 152.3 5.8% Life Sciences 99.7 105.6 112.1 151.2 6.2% Material Sciences 58.7 60.3 62.5 72.0 2.9% Nanotechnology 32.3 34.9 37.8 56.6 8.4% Total 293.3 309.4 327.3 432.1 5.7% Source: Annual Reports, Press Releases, SEC Filings, Investor Presentations, Microscopy Society of America, Canadian Cytometry and Microscopy Association, Chinese Electron Microcopy Society, Australian Microscopy and Microanalysis Society, Journal of Microscopy, Journal of Advanced Microscopy Research, Expert Interviews, and MarketsandMarkets Analysis In 2016, the semiconductors segment is expected to account for the largest share of the microscopy market in Canada. This application segment is projected to reach USD 152.3 million by 2021 from USD 114.9 million in 2016, at a CAGR of 5.8% during the forecast period.
  • 112.
    112 MICROSCOPY MARKET –GLOBAL FORECAST TO 2021 © MarketsandMarkets FIGURE 39 ACADEMIC INSTITUTES END-USER SEGMENT TO ACCOUNT FOR THE LARGEST SHARE OF THE CANADIAN MICROSCOPY MARKET IN 2016 Source: Annual Reports, Press Releases, SEC Filings, Investor Presentations Expert Interviews, and MarketsandMarkets Analysis TABLE 82 CANADA: MICROSCOPY MARKET SIZE, BY END USER, 2014-2021 (USD MILLION) End User 2014 2015 2016 2021 CAGR (2016–2021) Academic Institutes 148.6 159.1 170.7 241.4 7.2% Industries 90.2 94.4 99.1 125.8 4.9% Others 54.6 55.9 57.5 64.9 2.4% Total 293.3 309.4 327.3 432.2 5.7% Source: Annual Reports, Press Releases, SEC Filings, Investor Presentations, Microscopy Society of America, Canadian Cytometry and Microscopy Association, Chinese Electron Microcopy Society, Australian Microscopy and Microanalysis Society, Journal of Microscopy, Journal of Advanced Microscopy Research, Expert Interviews, and MarketsandMarkets Analysis In 2016, the academic institutes segment is expected to account for the largest share of the microscopy market in Canada. This end-user segment is projected to reach USD 241.4 million by 2021 from USD 170.7 million in 2016, at a CAGR of 7.2% during the forecast period. Academic Institutes Industries Other End Users 2016 170.7 99.1 57.5 2021 241.4 125.8 64.9 CAGR 7.1% 4.8% 2.4% 0 50 100 150 200 250 300 MarketSize(USDMillion)
  • 113.
    113 MICROSCOPY MARKET –GLOBAL FORECAST TO 2021 © MarketsandMarkets 9.3 EUROPE Europe is expected to account for the second-largest share of 29.5% of the global microscopy market in 2016. In 2014, about 10.4% of the European gross domestic product (GDP) was spent on healthcare; of this; nearly 7.5% was spent on medical devices. Increasing government support in the form of funding for research is the major factor responsible for growth of the European microscopy market. The European Commission (EC) supports nanoscience and nanotechnology through the European Research Council (ERC). Until 2013, funding for research and development in nanotechnology was covered under the Seventh Framework Programme (FP7), which, during 2007-2013, spent around USD 69.4 billion to boost nanoscience-related programs in the region. In 2014, the FP7 was superseded by a new funding initiative, Horizon 2020. The Horizon 2020 initiative aims to transform Europe over the next seven-year period (2014 to 2020) into a dynamic and competitive knowledge-based economy. It is the largest EU research and innovation program, with nearly USD 107.6 billion (€80 billion) available in funding, in addition to private investment. In July 2005, the EU, as a part of the nanotechnology initiative, formed a framework for nanotechnology activities within Europe, called the Nanoforum. It acts as a central location for all nanotechnology activities within the European community. Furthermore, the European Nanotechnology Trade Alliance was also formed to oversee and bridge gaps within nanotechnology research in Europe. Germany has the highest public sector investment in nanotechnology, in comparison to other European countries. About half of all European nanotechnology companies are based in Germany. Germany’s nanotechnology development is guided by the Nano Initiative Action Plan 2010. As a result of favorable government and corporate support, many key industry participants are expanding their microscopy business in Europe. For instance, in September 2014, FEI Co. (U.S.) opened a new state- of-the art facility in the Czech Republic. Nearly 600 people are expected to be employed in this facility, which will produce approximately 60% of the company’s electron microscopes. Growth in the biotechnology industry in countries such as Germany and the U.K. is another major growth contributor for the European microscopy market. Other countries that are expected to contribute significantly include the Netherlands, France, Italy, and Belgium. Many societies have been formed in Europe to support the microscopy industry, such as the Belgian Society for Microscopy (BSM). The BSM aims to support microscopy in all aspects and promote interaction between its members in Europe and the world. The European region is currently undergoing an economic downturn, which is a major factor restraining growth of the microscopy market in this region. However, despite the aforementioned factor, the European microscopy market is expected to grow at a modest rate during the forecast period. The key companies operating in this region are Bruker (U.S.), Carl Zeiss AG (Germany), Danish Micro Engineering A/S (Denmark), FEI Co. (U.S.), Hitachi High-Technologies (Japan), Leica Microsystems (Germany), Nikon (Japan), and Olympus Corporation (Japan).
  • 114.
    114 MICROSCOPY MARKET –GLOBAL FORECAST TO 2021 © MarketsandMarkets FIGURE 40 EUROPE: MICROSCOPY MARKET SNAPSHOT, 2016 Source: Annual Reports, Press Releases, SEC Filings, Investor Presentations Expert Interviews, and MarketsandMarkets Analysis EUROPE EUROPE: MICROSCOPY MARKET SIZE, BY END USER, 2016 vs 2021 (USD MILLION) EUROPE: MICROSCOPY MARKET, BY PRODUCT, 2016 vs 2021 (USD MILLION) PRODUCT 2016 2021 Electron Microscopes 542.9 896.5 Optical Microscopes 521.5 662.0 Scanning Probe Microscopes 188.2 243.0 Confocal Microscopes 128.1 175.8 FACTORS SUPPORTING THE GROWTH OF THE MICROSCOPY MARKET IN EUROPE • Increasing government support • Growing focus on nanotechnology EUROPE: MICROSCOPYMARKET SIZE, BY APPLICATION,2016 This geographic segment is estimated to grow at a CAGR of 7.4% from 2016 to 2021 Europe holds 29.5% of the global microscopy market in 2016 USD 484.5 Million USD 253.8 Million SEMICONDUCTORS LIFE SCIENCES 720.2 418.1 242.5 1,104.8 575.8 296.8 Academic Institutes Industries Others* 2016 2021 USD 263.7 Million USD 253.8 Million MATERIAL SCIENCES NANOTECHNOLOGY USD 159.6 Million USD 472.9 Million
  • 115.
    115 MICROSCOPY MARKET –GLOBAL FORECAST TO 2021 © MarketsandMarkets FIGURE 41 ELECTRON MICROSCOPY TO GROW AT THE HIGHEST RATE IN THE EUROPEAN MICROSCOPY MARKET DURING THE FORECAST PERIOD Source: Annual Reports, Press Releases, SEC Filings, Investor Presentations Expert Interviews, and MarketsandMarkets Analysis TABLE 83 EUROPE: MICROSCOPY MARKET SIZE, BY PRODUCT, 2014-2021 (USD MILLION) Product 2014 2015 2016 2021 CAGR (2016–2021) Optical Microscopes 473.8 496.8 521.5 662.0 4.9% Electron Microscopes 445.0 491.3 542.9 896.5 10.6% SPM 169.1 178.3 188.2 243.0 5.2% Confocal Microscopes 111.5 119.0 128.1 175.8 6.5% Total 1,199.4 1,285.3 1,380.8 1,977.4 7.4% Source: Annual Reports, Press Releases, SEC Filings, Investor Presentations, Microscopy Society of America, Canadian Cytometry and Microscopy Association, Chinese Electron Microcopy Society, Australian Microscopy and Microanalysis Society, Journal of Microscopy, Journal of Advanced Microscopy Research, Expert Interviews, and MarketsandMarkets Analysis In 2016, the electron microscopes segment is expected to account for the largest share of the microscopy market in Europe. This segment is projected to reach USD 896.5 million by 2021 from USD 542.9 million in 2016, at the highest CAGR of 10.6% during the forecast period. Electron Microcsopes Optical Microcsopes Scanning Probe Microcsopes Confocal Microcsopes 2016 542.9 521.5 188.2 128.1 2021 896.5 662.0 243.0 175.8 CAGR 10.5% 4.8% 5.2% 6.5% 0 100 200 300 400 500 600 700 800 900 1,000 MarketSize(USDMillion)
  • 116.
    116 MICROSCOPY MARKET –GLOBAL FORECAST TO 2021 © MarketsandMarkets TABLE 84 EUROPE: OPTICAL MICROSCOPES MARKET SIZE, BY TYPE, 2014-2021 (USD MILLION) Type 2014 2015 2016 2021 CAGR (2016–2021) Fluorescence Microscopes 353.0 361.9 372.0 415.4 2.2% Super-resolution Microscopes 120.8 134.9 149.5 246.6 10.5% Total 473.8 496.8 521.5 662.0 4.9% Source: Annual Reports, Press Releases, SEC Filings, Investor Presentations, Microscopy Society of America, Canadian Cytometry and Microscopy Association, Chinese Electron Microcopy Society, Australian Microscopy and Microanalysis Society, Journal of Microscopy, Journal of Advanced Microscopy Research, Expert Interviews, and MarketsandMarkets Analysis In 2016, the fluorescence microscopes segment is expected to account for the larger share of the optical microscopes market in Europe. This segment is projected to reach USD 415.4 million by 2021 from USD 372.0 million in 2016, at a CAGR of 2.2% during the forecast period. TABLE 85 EUROPE: ELECTRON MICROSCOPES MARKET SIZE, BY TYPE, 2014-2021 (USD MILLION) Type 2014 2015 2016 2021 CAGR (2016–2021) SEM 347.5 384.2 425.1 706.5 10.7% Transmission Electron Microscopes 97.5 107.1 117.8 190.1 10.0% Total 445.0 491.2 542.9 896.5 10.6% Source: Annual Reports, Press Releases, SEC Filings, Investor Presentations, Microscopy Society of America, Canadian Cytometry and Microscopy Association, Chinese Electron Microcopy Society, Australian Microscopy and Microanalysis Society, Journal of Microscopy, Journal of Advanced Microscopy Research, Expert Interviews, and MarketsandMarkets Analysis In 2016, the SEM segment is expected to account for the larger share of the electron microscopes market in Europe. This segment is projected to reach USD 706.5 million by 2021 from USD 425.1 million in 2016, at a CAGR of 10.7% during the forecast period. TABLE 86 EUROPE: SPM MARKET SIZE, BY TYPE, 2014-2021 (USD MILLION) Type 2014 2015 2016 2021 CAGR (2016–2021) STM 116.5 122.7 129.6 167.2 5.2% AFM 44.4 46.9 49.5 64.0 5.3% Near-field Scanning Microscopes 8.2 8.7 9.1 11.8 5.3% Total 169.1 178.3 188.2 243.0 5.2% Source: Annual Reports, Press Releases, SEC Filings, Investor Presentations, Microscopy Society of America, Canadian Cytometry and Microscopy Association, Chinese Electron Microcopy Society, Australian Microscopy and Microanalysis Society, Journal of Microscopy, Journal of Advanced Microscopy Research, Expert Interviews, and MarketsandMarkets Analysis In 2016, the STM segment is expected to account for the largest share of the SPM market in Europe. This segment is projected to reach USD 167.2 million by 2021 from USD 129.6 million in 2016, at a CAGR of 5.2% during the forecast period.
  • 117.
    117 MICROSCOPY MARKET –GLOBAL FORECAST TO 2021 © MarketsandMarkets TABLE 87 EUROPE: MICROSCOPY MARKET SIZE, BY APPLICATION, 2014-2021 (USD MILLION) Application 2014 2015 2016 2021 CAGR (2016–2021) Semiconductors 419.8 450.9 484.5 697.1 7.5% Life Sciences 407.8 438.8 472.9 691.7 7.9% Material Sciences 239.9 250.6 263.7 329.5 4.6% Nanotechnology 131.9 145.0 159.6 259.0 10.2% Total 1,199.4 1,285.3 1,380.8 1,977.4 7.4% Source: Annual Reports, Press Releases, SEC Filings, Investor Presentations, Microscopy Society of America, Canadian Cytometry and Microscopy Association, Chinese Electron Microcopy Society, Australian Microscopy and Microanalysis Society, Journal of Microscopy, Journal of Advanced Microscopy Research, Expert Interviews, and MarketsandMarkets Analysis In 2016, the semiconductors segment is expected to account for the largest share of the microscopy market in Europe. This application segment is projected to reach USD 697.1 million by 2021 from USD 484.5 million in 2016, at a CAGR of 7.5% during the forecast period. TABLE 88 EUROPE: MICROSCOPY MARKET SIZE, BY END USER, 2014-2021 (USD MILLION) End User 2014 2015 2016 2021 CAGR (2016–2021) Academic Institutes 607.6 660.9 720.2 1,104.8 8.9% Industries 368.7 392.3 418.1 575.8 6.6% Other End Users 223.1 232.1 242.5 296.8 4.1% Total 1,199.4 1,285.3 1,380.8 1,977.4 7.4% Source: Annual Reports, Press Releases, SEC Filings, Investor Presentations, Microscopy Society of America, Canadian Cytometry and Microscopy Association, Chinese Electron Microcopy Society, Australian Microscopy and Microanalysis Society, Journal of Microscopy, Journal of Advanced Microscopy Research, Expert Interviews, and MarketsandMarkets Analysis In 2016, the academic institutes segment is expected to account for the largest share of the microscopy market in Europe. This end-user segment is projected to reach USD 1,104.8 million by 2021 from USD 720.2 million in 2016, at the highest CAGR of 8.9% during the forecast period. TABLE 89 EUROPE: MICROSCOPY MARKET SIZE, BY COUNTRY/REGION, 2014-2021 (USD MILLION) Country/Region 2014 2015 2016 2021 CAGR (2016–2021) Germany 318.0 350.6 386.7 629.0 10.2% U.K. 174.3 190.2 208.1 325.6 9.4% France 122.6 132.3 143.3 214.2 8.4% RoE 584.6 612.2 642.7 808.5 4.7% Total 1,199.4 1,285.3 1,380.8 1,977.4 7.4% Source: Annual Reports, Press Releases, SEC Filings, Investor Presentations, Microscopy Society of America, Canadian Cytometry and Microscopy Association, Chinese Electron Microcopy Society, Australian Microscopy and Microanalysis Society, Journal of Microscopy, Journal of Advanced Microscopy Research, Expert Interviews, and MarketsandMarkets Analysis Germany is expected to account for the largest share of the European microscopy market in 2016. This country segment is projected to reach USD 629.0 million by 2021 from USD 386.7 million in 2016, at the highest CAGR of 10.2% from 2016 to 2021.
  • 118.
    118 MICROSCOPY MARKET –GLOBAL FORECAST TO 2021 © MarketsandMarkets 9.3.1 GERMANY Germany accounted for the largest share of 28% of the European microscopy market in 2016. Germany is Europe’s largest market for medical devices and has the highest public sector investment in nanotechnology. About half of all European nanotechnology companies are based in Germany. In addition, the country has a national program for nanotechnology development—the Nano Initiative Action Plan 2010, which aims at providing common goals and plans for nanotechnology development throughout the nation. Due to favorable government and corporate support, many key industry participants are expanding their microscopy business in Germany. Growth in research and development in life science plays a significant role in Germany’s economy. In addition, growth in the biotechnology industry is another major contributor to the microscopy market. According to the World Bank, research and development spending as a percentage of Germany’s GDP increased from 2.80% in 2011 to 2.85% in 2013. The Federal Ministry for Education and Research (BMBF), Germany, established two funding programs—the Health Research Program and the Research Strategy BioEconomy 2030. Along with these programs, the BMBF will provide institutional funding to research societies. These funding programs, coupled with the high research and development growth rate in Germany, are expected to boost the country’s biotechnology industry and positively impact the German microscopy market during the forecast period. TABLE 90 GERMANY: MICROSCOPY MARKET SIZE, BY PRODUCT, 2014-2021 (USD MILLION) Product 2014 2015 2016 2021 CAGR (2016–2021) Optical Microscopes 125.6 135.5 146.0 210.6 7.6% Electron Microscopes 118.0 134.0 152.0 285.2 13.4% SPM 44.8 48.6 52.7 77.3 8.0% Confocal Microscopes 29.6 32.5 35.9 55.9 9.3% Total 318.0 350.6 386.7 629.0 10.2% Source: Annual Reports, Press Releases, SEC Filings, Investor Presentations, Microscopy Society of America, Canadian Cytometry and Microscopy Association, Chinese Electron Microcopy Society, Australian Microscopy and Microanalysis Society, Journal of Microscopy, Journal of Advanced Microscopy Research, Expert Interviews, and MarketsandMarkets Analysis In 2016, the electron microscopes segment is expected to account for the largest share of the German microscopy market. This segment is projected to reach USD 285.2 million by 2021 from USD 152.0 million in 2016, at the highest CAGR of 13.4% from 2016 to 2021.
  • 119.
    119 MICROSCOPY MARKET –GLOBAL FORECAST TO 2021 © MarketsandMarkets FIGURE 42 SEMICONDUCTORS APPLICATION SEGMENT TO ACCOUNT FOR THE LARGEST SHARE OF THE EUROPEAN MICROSCOPY MARKET IN 2016 Source: Annual Reports, Press Releases, SEC Filings, Investor Presentations Expert Interviews, and MarketsandMarkets Analysis TABLE 91 GERMANY: MICROSCOPY MARKET SIZE, BY APPLICATION, 2014-2021 (USD MILLION) Application 2014 2015 2016 2021 CAGR (2016–2021) Semiconductors 111.3 123.0 135.7 221.8 10.3% Life Sciences 108.1 119.7 132.4 220.0 10.7% Material Sciences 63.6 68.4 73.9 104.8 7.3% Nanotechnology 35.0 39.6 44.7 82.4 13.0% Total 318.0 350.6 386.7 629.0 10.2% Source: Annual Reports, Press Releases, SEC Filings, Investor Presentations, Microscopy Society of America, Canadian Cytometry and Microscopy Association, Chinese Electron Microcopy Society, Australian Microscopy and Microanalysis Society, Journal of Microscopy, Journal of Advanced Microscopy Research, Expert Interviews, and MarketsandMarkets Analysis In 2016, the semiconductors segment is expected to account for the largest share of the German microscopy market. This application segment is projected to reach USD 221.8 million by 2021 from USD 135.7 million in 2016, at a CAGR of 10.3% from 2016 to 2021. Semiconductors Life Sciences Material Sciences Nanotechnology 2016 135.7 132.4 73.9 44.7 2021 221.8 220.0 104.8 82.4 CAGR 10.3% 10.6% 7.2% 13.0% 0 50 100 150 200 250 MarketSize(USDMillion)
  • 120.
    120 MICROSCOPY MARKET –GLOBAL FORECAST TO 2021 © MarketsandMarkets TABLE 92 GERMANY: MICROSCOPY MARKET SIZE, BY END USER, 2014-2021 (USD MILLION) End User 2014 2015 2016 2021 CAGR (2016–2021) Academic Institutes 161.1 180.3 201.7 351.4 11.7% Industries 97.7 107.0 117.1 183.2 9.4% Other End Users 59.1 63.3 67.9 94.4 6.8% Total 318.0 350.6 386.7 629.0 10.2% Source: Annual Reports, Press Releases, SEC Filings, Investor Presentations, Microscopy Society of America, Canadian Cytometry and Microscopy Association, Chinese Electron Microcopy Society, Australian Microscopy and Microanalysis Society, Journal of Microscopy, Journal of Advanced Microscopy Research, Expert Interviews, and MarketsandMarkets Analysis In 2016, the academic institutes segment is expected to account for the largest share of the German microscopy market. This end-user segment is projected to reach USD 351.4 million by 2021 from USD 201.7 million in 2016, at the highest CAGR of 11.7% from 2016 to 2021. 9.3.2 THE U.K. In 2016, the U.K. accounted for a 15.1% share of the European microscopy market. Research and development spending in the U.K. increased at a CAGR of 4.94% from USD 26.63 billion in 2001 to USD 41.08 billion in 2010. Substantial research and development spending is expected to drive growth of the academic research institutes end-user segment of the U.K. microscopy market in the forecast period. In addition, the Biotechnology and Biological Sciences Research Council (BBSRC) had a budget of USD 785 million in the academic year 2012–2013 to fund scientific research institutes and university research departments in the U.K. The availability of funding will enhance life sciences research, and consequently boost growth of the U.K. microscopy market. FIGURE 43 ELECTRON MICROSCOPES PRODUCT SEGMENT TO GROW AT THE HIGHEST RATE IN THE U.K. MICROSCOPY MARKET Source: Annual Reports, Press Releases, SEC Filings, Investor Presentations Expert Interviews, and MarketsandMarkets Analysis Electron Microcsopes Optical Microcsopes Scanning Probe Microcsopes Confocal Microcsopes 2016 81.8 78.6 28.4 19.3 2021 147.6 109.0 40.0 28.9 CAGR 12.5% 6.7% 7.1% 8.4% 0 20 40 60 80 100 120 140 160 MarketSize(USDMillion)
  • 121.
    121 MICROSCOPY MARKET –GLOBAL FORECAST TO 2021 © MarketsandMarkets TABLE 93 U.K.: MICROSCOPY MARKET SIZE, BY PRODUCT, 2014-2021 (USD MILLION) Product 2014 2015 2016 2021 CAGR (2016–2021) Optical Microscopes 68.8 73.5 78.6 109.0 6.8% Electron Microscopes 64.7 72.7 81.8 147.6 12.5% SPM 24.6 26.4 28.4 40.0 7.1% Confocal Microscopes 16.2 17.6 19.3 28.9 8.4% Total 174.3 190.2 208.1 325.6 9.4% Source: Annual Reports, Press Releases, SEC Filings, Investor Presentations, Microscopy Society of America, Canadian Cytometry and Microscopy Association, Chinese Electron Microcopy Society, Australian Microscopy and Microanalysis Society, Journal of Microscopy, Journal of Advanced Microscopy Research, Expert Interviews, and MarketsandMarkets Analysis In 2016, the electron microscopes segment is expected to account for the largest share of the U.K. microscopy market. This segment is projected to reach USD 147.6 million by 2021 from USD 81.8 million in 2016, at the highest CAGR of 12.5% from 2016 to 2021. TABLE 94 U.K.: MICROSCOPY MARKET SIZE, BY APPLICATION, 2014-2021 (USD MILLION) Application 2014 2015 2016 2021 CAGR (2016–2021) Semiconductors 61.0 66.7 73.0 114.8 9.5% Life Sciences 59.3 64.9 71.3 113.9 9.8% Material Sciences 34.9 37.1 39.7 54.3 6.4% Nanotechnology 19.2 21.5 24.0 42.7 12.1% Total 174.3 190.2 208.1 325.6 9.4% Source: Annual Reports, Press Releases, SEC Filings, Investor Presentations, Microscopy Society of America, Canadian Cytometry and Microscopy Association, Chinese Electron Microcopy Society, Australian Microscopy and Microanalysis Society, Journal of Microscopy, Journal of Advanced Microscopy Research, Expert Interviews, and MarketsandMarkets Analysis In 2016, the semiconductors segment is expected to account for the largest share of the U.K. microscopy market. This application segment is projected to reach USD 114.8 million by 2021 from USD 73.0 million in 2016, at a CAGR of 9.5% from 2016 to 2021. TABLE 95 U.K.: MICROSCOPY MARKET SIZE, BY END USER, 2014-2021 (USD MILLION) End User 2014 2015 2016 2021 CAGR (2016–2021) Academic Institutes 88.3 97.8 108.5 181.9 10.9% Industries 53.6 58.1 63.0 94.8 8.5% Other End Users 32.4 34.4 36.5 48.9 6.0% Total 174.3 190.2 208.1 325.6 9.4% Source: Annual Reports, Press Releases, SEC Filings, Investor Presentations, Microscopy Society of America, Canadian Cytometry and Microscopy Association, Chinese Electron Microcopy Society, Australian Microscopy and Microanalysis Society, Journal of Microscopy, Journal of Advanced Microscopy Research, Expert Interviews, and MarketsandMarkets Analysis In 2016, the academic institutes segment is expected to account for the largest share of the U.K. microscopy market. This end-user segment is projected to reach USD 181.9 million by 2021 from USD 108.5 million in 2016, at the highest CAGR of 10.9% from 2016 to 2021.
  • 122.
    122 MICROSCOPY MARKET –GLOBAL FORECAST TO 2021 © MarketsandMarkets 9.3.3 FRANCE In 2016, France accounted for a 10.4% share of the European microscopy market. Research and development spending in France increased from USD 29.43 billion in 2001 to USD 57.45 billion in 2010, at a CAGR of 7.71% between the two years. In 2011, the French government invested about USD 360 million in nine national infrastructure projects in medical and life sciences research, and in two demonstration projects in biotechnology. This, coupled with the increasing overall research and development spending, will drive the biotechnology market in the country. Similarly, France’s five-year Nano2012 strategic research and development program, led by STMicroelectronics, has been granted a research and development budget of USD 2.57 billion, making it one of France’s biggest industrial projects. The French national and local governments are providing substantial support for the project, contributing nearly USD 511 million. TABLE 96 FRANCE: MICROSCOPY MARKET SIZE, BY PRODUCT, 2014-2021 (USD MILLION) Product 2014 2015 2016 2021 CAGR (2016–2021) Optical Microscopes 48.4 51.1 54.1 71.7 5.8% Electron Microscopes 45.5 50.6 56.4 97.1 11.5% SPM 17.3 18.3 19.5 26.3 6.1% Confocal Microscopes 11.4 12.2 13.3 19.0 7.4% Total 122.6 132.3 143.3 214.2 8.4% Source: Annual Reports, Press Releases, SEC Filings, Investor Presentations, Microscopy Society of America, Canadian Cytometry and Microscopy Association, Chinese Electron Microcopy Society, Australian Microscopy and Microanalysis Society, Journal of Microscopy, Journal of Advanced Microscopy Research, Expert Interviews, and MarketsandMarkets Analysis In 2016, the electron microscopes segment is expected to account for the largest share of the French microscopy market. This segment is projected to reach USD 97.1 million by 2021 from USD 56.4 million in 2016, at the highest CAGR of 11.5% from 2016 to 2021. TABLE 97 FRANCE: MICROSCOPY MARKET SIZE, BY APPLICATION, 2014-2021 (USD MILLION) Application 2014 2015 2016 2021 CAGR (2016–2021) Semiconductors 42.9 46.4 50.3 75.5 8.5% Life Sciences 41.7 45.2 49.1 74.9 8.8% Material Sciences 24.5 25.8 27.4 35.7 5.5% Nanotechnology 13.5 14.9 16.6 28.1 11.1% Total 122.6 132.3 143.3 214.2 8.4% Source: Annual Reports, Press Releases, SEC Filings, Investor Presentations, Microscopy Society of America, Canadian Cytometry and Microscopy Association, Chinese Electron Microcopy Society, Australian Microscopy and Microanalysis Society, Journal of Microscopy, Journal of Advanced Microscopy Research, Expert Interviews, and MarketsandMarkets Analysis In 2016, the semiconductors segment is expected to account for the largest share of the French microscopy market. This application segment is projected to reach USD 75.5 million by 2021 from USD 50.3 million in 2016, at a CAGR of 8.5% from 2016 to 2021.
  • 123.
    123 MICROSCOPY MARKET –GLOBAL FORECAST TO 2021 © MarketsandMarkets FIGURE 44 ACADEMIC INSTITUTES END-USER SEGMENT TO ACCOUNT FOR THE HIGHEST SHARE IN THE FRENCH MICROSCOPY MARKET IN 2016 Source: Annual Reports, Press Releases, SEC Filings, Investor Presentations Expert Interviews, and MarketsandMarkets Analysis TABLE 98 FRANCE: MICROSCOPY MARKET SIZE, BY END USER, 2014-2021 (USD MILLION) End User 2014 2015 2016 2021 CAGR (2016–2021) Academic Institutes 62.1 68.0 74.8 119.7 9.9% Industries 37.7 40.4 43.4 62.4 7.5% Other End User 22.8 23.9 25.2 32.2 5.0% Total 122.6 132.3 143.3 214.2 8.4% Source: Annual Reports, Press Releases, SEC Filings, Investor Presentations, Microscopy Society of America, Canadian Cytometry and Microscopy Association, Chinese Electron Microcopy Society, Australian Microscopy and Microanalysis Society, Journal of Microscopy, Journal of Advanced Microscopy Research, Expert Interviews, and MarketsandMarkets Analysis In 2016, the academic institutes segment is expected to account for the largest share of the French microscopy end users market. This end-user segment is projected to reach USD 119.7 million by 2021 from USD 74.8 million in 2016, at the highest CAGR of 9.9% from 2016 to 2021. Academic Institutes Industries Other End Users 2016 74.8 43.4 25.2 2021 119.7 62.4 32.2 CAGR 9.8% 7.5% 5.0% 0 20 40 60 80 100 120 140 MarketSize(USDMillion)
  • 124.
    124 MICROSCOPY MARKET –GLOBAL FORECAST TO 2021 © MarketsandMarkets 9.3.4 REST OF EUROPE (ROE) The Rest of Europe (RoE) accounted for a 46.5% share of the European microscopy market in 2016. This segment includes Italy, Spain, the Netherlands, Switzerland, Sweden, Belgium, Turkey, and the Czech Republic. Many societies have been formed in this region to aid growth of the microscopy industry. For instance, the Belgian Society for Microscopy (BSM) is a society of professional microscopists from various industries, academic institutes, and government laboratories in Belgium. It is expected, though, that the economic downturn in the region will negatively affect growth of the rest of European market. TABLE 99 ROE: MICROSCOPY MARKET SIZE, BY PRODUCT, 2014-2021 (USD MILLION) Product 2014 2015 2016 2021 CAGR (2016–2021) Optical Microscopes 230.9 236.6 242.8 270.7 2.2% Electron Microscopes 216.9 234.0 252.7 366.6 7.7% SPM 82.4 84.9 87.6 99.4 2.6% Confocal Microscopes 54.4 56.7 59.6 71.9 3.8% Total 584.6 612.2 642.7 808.5 4.7% Source: Annual Reports, Press Releases, SEC Filings, Investor Presentations, Microscopy Society of America, Canadian Cytometry and Microscopy Association, Chinese Electron Microcopy Society, Australian Microscopy and Microanalysis Society, Journal of Microscopy, Journal of Advanced Microscopy Research, Expert Interviews, and MarketsandMarkets Analysis In 2016, the electron microscopes segment is expected to account for the largest share of the RoE microscopy market. This segment is projected to reach USD 366.6 million by 2021 from USD 252.7 million in 2016, at the highest CAGR of 7.7% from 2016 to 2021. FIGURE 45 NANOTECHNOLOGY TO WITNESS FASTEST GROWTH IN THE ROE MICROSCOPY MARKET DURING FORECAST PERIOD Source: Annual Reports, Press Releases, SEC Filings, Investor Presentations Expert Interviews, and MarketsandMarkets Analysis Semiconductors Life Sciences Material Sciences Nanotechnology 2016 225.5 220.1 122.8 74.3 2021 285.0 282.8 134.7 105.9 CAGR 4.7% 5.1% 1.8% 7.3% 0 50 100 150 200 250 300 MarketSize(USDMillion)
  • 125.
    125 MICROSCOPY MARKET –GLOBAL FORECAST TO 2021 © MarketsandMarkets TABLE 100 ROE: MICROSCOPY MARKET SIZE, BY APPLICATION, 2014-2021 (USD MILLION) Application 2014 2015 2016 2021 CAGR (2016–2021) Semiconductors 204.6 214.8 225.5 285.0 4.8% Life Sciences 198.8 209.0 220.1 282.8 5.1% Material Sciences 116.9 119.4 122.8 134.7 1.9% Nanotechnology 64.3 69.1 74.3 105.9 7.4% Total 584.6 612.2 642.7 808.5 4.7% Source: Annual Reports, Press Releases, SEC Filings, Investor Presentations, Microscopy Society of America, Canadian Cytometry and Microscopy Association, Chinese Electron Microcopy Society, Australian Microscopy and Microanalysis Society, Journal of Microscopy, Journal of Advanced Microscopy Research, Expert Interviews, and MarketsandMarkets Analysis In 2016, the semiconductors segment is expected to account for the largest share of the RoE microscopy market. This application segment is projected to reach USD 285.0 million by 2021 from USD 225.5 million in 2016, at a CAGR of 4.8% from 2016 to 2021. TABLE 101 ROE: MICROSCOPY MARKET SIZE, BY END USER, 2014-2021 (USD MILLION) End User 2014 2015 2016 2021 CAGR (2016–2021) Academic Institutes 296.2 314.8 335.2 451.7 6.1% Industries 179.7 186.9 194.6 235.4 3.9% Other End User 108.7 110.6 112.9 121.4 1.5% Total 584.6 612.2 642.7 808.5 4.7% Source: Annual Reports, Press Releases, SEC Filings, Investor Presentations, Microscopy Society of America, Canadian Cytometry and Microscopy Association, Chinese Electron Microcopy Society, Australian Microscopy and Microanalysis Society, Journal of Microscopy, Journal of Advanced Microscopy Research, Expert Interviews, and MarketsandMarkets Analysis In 2016, the academic institutes segment is expected to account for the largest share of the RoE microscopy market. This end-user segment is projected to reach USD 451.7 million by 2021 from USD 335.2 million in 2016, at the highest CAGR of 6.1% from 2016 to 2021.
  • 126.
    126 MICROSCOPY MARKET –GLOBAL FORECAST TO 2021 © MarketsandMarkets 9.4 ASIA-PACIFIC The Asia-Pacific region’s microscopy market comprises China, India, Japan, the Middle East, Australia, New Zealand, and others (including Malaysia, Taiwan, Singapore, and South Korea). This market is expected to account for a 24.1% share of the global microscopy market in 2016. The APAC microscopy market, particularly in China, Japan, India, Taiwan, and South Korea, is expected to witness high growth in the next five years. Growth in these countries will be fueled by factors such as aggressive investment by key market companies, increasing government support, developing research and development infrastructure, and growing expertise and academic excellence. Japan has always been at the forefront of technological innovation. Increasing research and development in nanotechnology is a major driving factor for the microscopy market in Japan. In addition, technological advancements in microscopes, growing demand for visualization and measurement devices from Japanese research institutes, and lucrative market opportunities such as lack of regulations are propelling growth of this market. However, within APAC China is expected to witness the highest growth rate during the forecast period. Original equipment manufacturers (OEMs) from China and Japan also play a crucial role in the growth of the microscopy market in these regions, as key industry participants are very dependent on OEMs to meet their production requirements. For instance, Leica ES2 stereo microscopes are manufactured by Novel Optics (China). Similarly, Zeiss Primo Star microscopes are manufactured by the Motic Group (China). In addition, low labor costs, lack of regulations, and increasing liberalization in Asian countries have also made this region a lucrative market for investors. In April 2011, Hitachi High-Technologies Corporation (Japan) and Techcomp Holdings Ltd. (China) renewed their marketing agreement for five years. Under the agreement, Techcomp owned the distribution and marketing rights for Hitachi’s analytical product range and electronic microscopes in the Pacific region, Southeast Asia, and South Asia. However, a number of factors such as the high cost of advanced microscopes, slow adoption of technologically-advanced systems, high custom duties charged on medical devices in India and political instability in the Middle East are restraining growth of this market. The major companies operating in the Asia-Pacific region include Bruker (U.S.), Carl Zeiss AG (Germany), Danish Micro Engineering A/S (Denmark), FEI Co. (U.S.), Hitachi High-Technologies (Japan), Leica Microsystems (Germany), Nikon (Japan), and Olympus Corporation (Japan).
  • 127.
    127 MICROSCOPY MARKET –GLOBAL FORECAST TO 2021 © MarketsandMarkets FIGURE 46 ASIA-PACIFIC: MICROSCOPY MARKET SNAPSHOT, 2016 Source: Annual Reports, Press Releases, SEC Filings, Investor Presentations, Microscopy Society of America, Canadian Cytometry and Microscopy Association, Chinese Electron Microcopy Society, Australian Microscopy and Microanalysis Society, Journal of Microscopy, Journal of Advanced Microscopy Research, Expert Interviews, and MarketsandMarkets Analysis ASIA-PACIFIC APAC: MICROSCOPY MARKET SIZE, BY END USER, 2016 vs 2021 (USD MILLION) APAC: MICROSCOPY MARKET, BY PRODUCT, 2016 VS. 2021 (USD MILLION) PRODUCT 2016 2021 Electron Microscopes 443.8 817.8 Optical Microscopes 426.3 603.8 Scanning Probe Microscopes 153.9 221.7 Confocal Microscopes 104.7 160.3 APAC: MICROSCOPY MARKET SIZE, BY APPLICATION, 2016 • Aggressive investments by key market players • Increasing government support • Developing R&D infrastructure • Growing expertise and academic excellence FACTORS SUPPORTING THE GROWTH OF THE MICROSCOPY MARKET IN APAC APAC to hold 24.1% share of the global microscopy market in 2016 This geographic segment is expected to grow at a CAGR of 9.8% from 2016 to 2021 SEMICONDUCTORS LIFE SCIENCES USD 396.1 MILLION USD 386.6 MILLION MATERIAL SCIENCES NANOTECHNOLOGY USD 215.6 MILLION USD 130.4 MILLION 588.7 341.8 198.2 1,007.7 525.2 270.7 Academic Institutes Industries Others* 2016 2021
  • 128.
    128 MICROSCOPY MARKET –GLOBAL FORECAST TO 2021 © MarketsandMarkets TABLE 102 ASIA-PACIFIC: MICROSCOPY MARKET SIZE, BY PRODUCT, 2014-2021 (USD MILLION) Product 2014 2015 2016 2021 CAGR (2016–2021) Optical Microscopes 369.4 396.5 426.3 603.8 7.2% Electron Microscopes 346.9 392.1 443.8 817.8 13.0% SPM 131.9 142.3 153.9 221.7 7.6% Confocal Microscopes 87.0 95.0 104.7 160.3 8.9% Total 935.1 1,026.0 1,128.7 1,803.6 9.8% Source: Annual Reports, Press Releases, SEC Filings, Investor Presentations, Microscopy Society of America, Canadian Cytometry and Microscopy Association, Chinese Electron Microcopy Society, Australian Microscopy and Microanalysis Society, Journal of Microscopy, Journal of Advanced Microscopy Research, Expert Interviews, and MarketsandMarkets Analysis In 2016, the electron microscopes segment is expected to account for the largest share of the microscopy market in APAC. This product segment is projected to reach USD 817.8 million by 2021 from USD 443.8 million in 2016, at the highest CAGR of 13.0% during the forecast period. TABLE 103 ASIA-PACIFIC: OPTICAL MICROSCOPES MARKET SIZE, BY TYPE, 2014-2021 (USD MILLION) Type 2014 2015 2016 2021 CAGR (2016–2021) Fluorescence Microscopes 275.2 288.9 304.1 378.9 4.5% Super-resolution Microscopes 94.2 107.7 122.2 224.9 13.0% Total 369.4 396.5 426.3 603.8 7.2% Source: Annual Reports, Press Releases, SEC Filings, Investor Presentations, Microscopy Society of America, Canadian Cytometry and Microscopy Association, Chinese Electron Microcopy Society, Australian Microscopy and Microanalysis Society, Journal of Microscopy, Journal of Advanced Microscopy Research, Expert Interviews, and MarketsandMarkets Analysis In 2016, the fluorescence microscopes segment is expected to account for the larger share of the optical microscopes market in the APAC region. This segment is projected to reach USD 378.9 million by 2021 from USD 304.1 million in 2016, at a CAGR of 4.5% during the forecast period. TABLE 104 ASIA-PACIFIC: ELECTRON MICROSCOPES MARKET SIZE, BY TYPE, 2014-2021 (USD MILLION) Type 2014 2015 2016 2021 CAGR (2016–2021) SEM 271.0 306.7 347.5 644.4 13.1% Transmission Electron Microscopes 76.0 85.5 96.3 173.4 12.5% Total 346.9 392.1 443.8 817.7 13.0% Source: Annual Reports, Press Releases, SEC Filings, Investor Presentations, Microscopy Society of America, Canadian Cytometry and Microscopy Association, Chinese Electron Microcopy Society, Australian Microscopy and Microanalysis Society, Journal of Microscopy, Journal of Advanced Microscopy Research, Expert Interviews, and MarketsandMarkets Analysis In 2016, the SEM segment is expected to account for the larger share of the electron microscopes market in the APAC region. This segment is projected to reach USD 644.4 million by 2021 from USD 347.5 million in 2016, at a higher CAGR of 13.1% during the forecast period.
  • 129.
    129 MICROSCOPY MARKET –GLOBAL FORECAST TO 2021 © MarketsandMarkets TABLE 105 ASIA-PACIFIC: SPM MARKET SIZE, BY TYPE, 2014-2021 (USD MILLION) Type 2014 2015 2016 2021 CAGR (2016–2021) STM 131.9 142.3 153.9 221.7 7.6% AFM 34.7 37.4 40.5 58.4 7.6% Near-field Scanning Microscopes 6.4 6.9 7.4 10.8 7.7% Total 172.9 186.6 201.8 290.8 7.6% Source: Annual Reports, Press Releases, SEC Filings, Investor Presentations, Microscopy Society of America, Canadian Cytometry and Microscopy Association, Chinese Electron Microcopy Society, Australian Microscopy and Microanalysis Society, Journal of Microscopy, Journal of Advanced Microscopy Research, Expert Interviews, and MarketsandMarkets Analysis In 2016, the STM segment is expected to account for the larger share of the SPM market in the APAC region. This segment is projected to reach USD 221.7 million by 2021 from USD 153.9 million in 2016, at a CAGR of 7.6% during the forecast period. TABLE 106 ASIA-PACIFIC: MICROSCOPY MARKET SIZE, BY APPLICATION, 2014-2021 (USD MILLION) Application 2014 2015 2016 2021 CAGR (2016–2021) Semiconductors 327.3 359.9 396.1 635.8 9.9% Life Sciences 317.9 350.3 386.6 630.9 10.3% Material Sciences 187.0 200.0 215.6 300.6 6.9% Nanotechnology 102.9 115.8 130.4 236.3 12.6% Total 935.1 1,026.0 1,128.7 1,803.6 9.8% Source: Annual Reports, Press Releases, SEC Filings, Investor Presentations, Microscopy Society of America, Canadian Cytometry and Microscopy Association, Chinese Electron Microcopy Society, Australian Microscopy and Microanalysis Society, Journal of Microscopy, Journal of Advanced Microscopy Research, Expert Interviews, and MarketsandMarkets Analysis In 2016, the semiconductors segment is expected to account for the largest share of the microscopy market in the APAC region. This application segment is projected to reach USD 635.8 million by 2021 from USD 396.1 million in 2016, at a CAGR of 9.9% during the forecast period. TABLE 107 ASIA-PACIFIC: MICROSCOPY MARKET SIZE, BY END USER, 2014-2021 (USD MILLION) End User 2014 2015 2016 2021 CAGR (2016–2021) Academic Institutes 473.7 527.5 588.7 1,007.7 11.3% Industries 287.5 313.2 341.8 525.2 9.0% Other End Users 173.9 185.3 198.2 270.7 6.4% Total 935.1 1,026.0 1,128.7 1,803.6 9.8% *Note: The others segment includes government research institutes and private laboratories. Source: Annual Reports, Press Releases, SEC Filings, Investor Presentations, Microscopy Society of America, Canadian Cytometry and Microscopy Association, Chinese Electron Microcopy Society, Australian Microscopy and Microanalysis Society, Journal of Microscopy, Journal of Advanced Microscopy Research, Expert Interviews, and MarketsandMarkets Analysis In 2016, the academic institutes segment is expected to account for the largest share of the microscopy market in the APAC region. This end-user segment is projected to reach USD 1,007.7 million by 2021 from USD 588.7 million in 2016, at the highest CAGR of 11.3% during the forecast period.
  • 130.
    130 MICROSCOPY MARKET –GLOBAL FORECAST TO 2021 © MarketsandMarkets 9.5 REST OF THE WORLD (ROW) The Rest of the World (RoW) region includes Africa and Latin America. The RoW is expected to account for a 10.5% share of the overall microscopy market in 2016. Growth in this region will primarily be centered on South American countries such as Brazil, Mexico, and Argentina. Companies in the microscopy market are expected to shift their focus toward untapped markets in Latin America and Africa, once developed markets start getting saturated. TABLE 108 ROW: MICROSCOPY MARKET SIZE, BY PRODUCT, 2014-2021 (USD MILLION) Product 2014 2015 2016 2021 CAGR (2016–2021) Optical Microscopes 168.6 176.0 183.9 227.8 4.4% Electron Microscopes 158.4 174.1 191.4 308.5 10.0% SPM 60.2 63.2 66.4 83.6 4.7% Confocal Microscopes 39.7 42.2 45.2 60.5 6.0% Total 426.9 455.5 486.8 680.5 6.9% Source: Annual Reports, Press Releases, SEC Filings, Investor Presentations, Microscopy Society of America, Canadian Cytometry and Microscopy Association, Chinese Electron Microcopy Society, Australian Microscopy and Microanalysis Society, Journal of Microscopy, Journal of Advanced Microscopy Research, Expert Interviews, and MarketsandMarkets Analysis In 2016, the electron microscopes segment is expected to account for the largest share of the microscopy market in the RoW. This product segment is projected to reach USD 308.5 million by 2021 from USD 191.4 million in 2016, at the highest CAGR of 10.0% during the forecast period. TABLE 109 ROW: OPTICAL MICROSCOPES MARKET SIZE, BY TYPE, 2014-2021 (USD MILLION) Type 2014 2015 2016 2021 CAGR (2016–2021) Fluorescence Microscopes 125.6 128.2 131.2 143.0 1.7% Super-resolution Microscopes 43.0 47.8 52.7 84.9 10.0% Total 168.6 176.0 183.9 227.8 4.4% Source: Annual Reports, Press Releases, SEC Filings, Investor Presentations, Microscopy Society of America, Canadian Cytometry and Microscopy Association, Chinese Electron Microcopy Society, Australian Microscopy and Microanalysis Society, Journal of Microscopy, Journal of Advanced Microscopy Research, Expert Interviews, and MarketsandMarkets Analysis In 2016, the fluorescence microscopes segment is expected to account for a larger share of the optical microscopes market in the RoW. This segment is projected to reach USD 143.0 million by 2021 from USD 131.2 million in 2016, at a CAGR of 1.7% during the forecast period.
  • 131.
    131 MICROSCOPY MARKET –GLOBAL FORECAST TO 2021 © MarketsandMarkets TABLE 110 ROW: ELECTRON MICROSCOPES MARKET SIZE, BY TYPE, 2014-2021 (USD MILLION) Type 2014 2015 2016 2021 CAGR (2016–2021) SEM 123.7 136.1 149.9 243.1 10.2% Transmission Electron Microscopes 34.7 37.9 41.5 65.4 9.5% Total 158.4 174.1 191.4 308.5 10.0% Source: Annual Reports, Press Releases, SEC Filings, Investor Presentations, Microscopy Society of America, Canadian Cytometry and Microscopy Association, Chinese Electron Microcopy Society, Australian Microscopy and Microanalysis Society, Journal of Microscopy, Journal of Advanced Microscopy Research, Expert Interviews, and MarketsandMarkets Analysis In 2016, the SEM segment is expected to account for a larger share of the electron microscopes market in the RoW. This segment is projected to reach USD 243.1 million by 2021 from USD 149.9 million in 2016, at a higher CAGR of 10.2% during the forecast period. TABLE 111 ROW: SPM MARKET SIZE, BY TYPE, 2014-2021 (USD MILLION) Type 2014 2015 2016 2021 CAGR (2016–2021) STM 41.5 43.5 45.7 57.5 4.7% AFM 15.8 16.6 17.4 22.0 4.8% Near-field Scanning Microscopes 2.9 3.1 3.2 4.1 4.8% Total 60.2 63.2 66.4 83.6 4.7% Source: Annual Reports, Press Releases, SEC Filings, Investor Presentations, Microscopy Society of America, Canadian Cytometry and Microscopy Association, Chinese Electron Microcopy Society, Australian Microscopy and Microanalysis Society, Journal of Microscopy, Journal of Advanced Microscopy Research, Expert Interviews, and MarketsandMarkets Analysis In 2016, the STM segment is expected to account for the largest share of the SPM market in the RoW. This segment is projected to reach USD 57.5 million by 2021 from USD 45.7 million in 2016, at a CAGR of 4.7% during the forecast period. TABLE 112 ROW: MICROSCOPY MARKET SIZE, BY APPLICATION, 2014-2021 (USD MILLION) Application 2014 2015 2016 2021 CAGR (2016–2021) Semiconductors 149.4 159.8 170.8 239.9 7.0% Life Sciences 145.1 155.5 166.7 238.1 7.4% Material Sciences 85.4 88.8 93.0 113.4 4.1% Nanotechnology 47.0 51.4 56.3 89.1 9.6% Total 426.9 455.5 486.8 680.5 6.9% Source: Annual Reports, Press Releases, SEC Filings, Investor Presentations, Microscopy Society of America, Canadian Cytometry and Microscopy Association, Chinese Electron Microcopy Society, Australian Microscopy and Microanalysis Society, Journal of Microscopy, Journal of Advanced Microscopy Research, Expert Interviews, and MarketsandMarkets Analysis In 2016, the semiconductors segment is expected to account for the largest share of the microscopy market in the RoW. This application segment is projected to reach USD 239.9 million by 2021 from USD 170.8 million in 2016, at a CAGR of 7.0% during the forecast period.
  • 132.
    132 MICROSCOPY MARKET –GLOBAL FORECAST TO 2021 © MarketsandMarkets FIGURE 47 ACADEMIC INSTITUTES END-USER SEGMENT TO WITNESS THE HIGHEST GROWTH RATE IN THE ROW MICROSCOPY MARKET DURING THE FORECAST PERIOD Source: Annual Reports, Press Releases, SEC Filings, Investor Presentations, Microscopy Society of America, Canadian Cytometry and Microscopy Association, Chinese Electron Microcopy Society, Australian Microscopy and Microanalysis Society, Journal of Microscopy, Journal of Advanced Microscopy Research, Expert Interviews, and MarketsandMarkets Analysis TABLE 113 ROW: MICROSCOPY MARKET SIZE, BY END USER, 2014-2021 (USD MILLION) End User 2014 2015 2016 2021 CAGR (2016–2021) Academic Institutes 216.3 234.2 253.9 380.2 8.4% Industries 131.2 139.0 147.4 198.2 6.1% Other End Users 79.4 82.3 85.5 102.1 3.6% Total 426.9 455.5 486.8 680.5 6.9% Source: Annual Reports, Press Releases, SEC Filings, Investor Presentations, Microscopy Society of America, Canadian Cytometry and Microscopy Association, Chinese Electron Microcopy Society, Australian Microscopy and Microanalysis Society, Journal of Microscopy, Journal of Advanced Microscopy Research, Expert Interviews, and MarketsandMarkets Analysis In 2016, the academic institutes segment is expected to account for the largest share of the microscopy market in the RoW. This end-user segment is projected to reach USD 380.2 million by 2021 from USD 253.9 million in 2016, at a CAGR of 8.4% during the forecast period. Academic Institutes Industries Other End Users 2016 253.9 147.4 85.5 2021 380.2 198.2 102.1 CAGR 8.4% 6.0% 3.6% 0 50 100 150 200 250 300 350 400 MarketSize(USDMillion)
  • 133.
    133 MICROSCOPY MARKET –GLOBAL FORECAST TO 2021 © MarketsandMarkets TABLE 114 ROW: MICROSCOPY MARKET SIZE, BY COUNTRY/REGION, 2014-2021 (USD MILLION) Country/Region 2014 2015 2016 2021 CAGR (2016–2021) Brazil 178.4 191.0 204.7 290.4 7.2% Mexico 107.6 113.2 119.3 155.1 5.4% Argentina 40.6 43.7 47.2 69.3 8.0% RoLA 100.3 107.6 115.6 165.7 7.5% Total 426.9 455.5 486.8 680.5 6.9% Source: Annual Reports, Press Releases, SEC Filings, Investor Presentations, Microscopy Society of America, Canadian Cytometry and Microscopy Association, Chinese Electron Microcopy Society, Australian Microscopy and Microanalysis Society, Journal of Microscopy, Journal of Advanced Microscopy Research, Expert Interviews, and MarketsandMarkets Analysis Brazil is expected to account for the largest share of the RoW microscopy market in 2016. This regional segment is projected to reach USD 290.4 million by 2021 from USD 204.7 million in 2016, at a CAGR of 7.2% from 2016 to 2021. 9.5.1 BRAZIL Brazil, the growth engine for the RoW microscopy market, is expected to account for the largest share (41.9%) of the RoW microscopy market in 2016. According to World Bank 2010 data, Brazil spent approximately 1.1% of its GDP on research and development activities, which was less than the OECD countries’ average of 2.2%. However, in 2007, the Ministry of Health launched the National Action Plan for Science and Technology to increase research and development investment to 1.5% of the country’s GDP. The life sciences sector has the greatest demand for research and development activities in the country, with much of the research being conducted in the field of genomics, stem cell research, vaccines, neurosciences, and green biotechnology. The Brazilian government is also dedicated to improving human resource support in the country. In addition, in 2001, the Brazilian Ministry of Science and Technology (MCT) started a systematic approach for nanotechnology development. In 2012, the MCT launched the SisNANO project with a view to reduce the gap between researchers in academic institutes and industries. Thus, favorable government initiatives are a major driving factor for this region. On the other hand, political instability and a lack of funding are restraining growth of this market. TABLE 115 BRAZIL: MICROSCOPY MARKET SIZE, BY PRODUCT, 2014-2021 (USD MILLION) Product 2014 2015 2016 2021 CAGR (2016–2021) Optical Microscopes 70.5 73.8 77.3 97.2 4.7% Electron Microscopes 66.2 73.0 80.5 131.7 10.3% SPM 25.2 26.5 27.9 35.7 5.0% Confocal Microscopes 16.6 17.7 19.0 25.8 6.3% Total 178.4 191.0 204.7 290.4 7.2% Source: Annual Reports, Press Releases, SEC Filings, Investor Presentations, Microscopy Society of America, Canadian Cytometry and Microscopy Association, Chinese Electron Microcopy Society, Australian Microscopy and Microanalysis Society, Journal of Microscopy, Journal of Advanced Microscopy Research, Expert Interviews, and MarketsandMarkets Analysis In 2016, the electron microscopes segment is expected to account for the largest share of the microscopy market in Brazil. This product segment is projected to reach USD 131.7 million by 2021 from USD 80.5 million in 2016, at the highest CAGR of 10.3% during the forecast period.
  • 134.
    134 MICROSCOPY MARKET –GLOBAL FORECAST TO 2021 © MarketsandMarkets TABLE 116 BRAZIL: OPTICAL MICROSCOPES MARKET SIZE, BY TYPE, 2014-2021 (USD MILLION) Type 2014 2015 2016 2021 CAGR (2016–2021) Fluorescence Microscopes 52.5 53.8 55.2 61.0 2.0% Super-resolution Microscopes 18.0 20.0 22.2 36.2 10.3% Total 70.5 73.8 77.3 97.2 4.7% Source: Annual Reports, Press Releases, SEC Filings, Investor Presentations, Microscopy Society of America, Canadian Cytometry and Microscopy Association, Chinese Electron Microcopy Society, Australian Microscopy and Microanalysis Society, Journal of Microscopy, Journal of Advanced Microscopy Research, Expert Interviews, and MarketsandMarkets Analysis In 2016, the fluorescence microscopes segment is expected to account for a larger share of the optical microscopes market in Brazil. This segment is projected to reach USD 61.0 million by 2021 from USD 55.2 million in 2016, at a CAGR of 2.0% during the forecast period. TABLE 117 BRAZIL: ELECTRON MICROSCOPES MARKET SIZE, BY TYPE, 2014-2021 (USD MILLION) Type 2014 2015 2016 2021 CAGR (2016–2021) SEM 51.7 57.1 63.0 103.7 10.5% Transmission Electron Microscopes 14.5 15.9 17.5 27.9 9.8% Total 66.2 73.0 80.5 131.7 10.3% Source: Annual Reports, Press Releases, SEC Filings, Investor Presentations, Microscopy Society of America, Canadian Cytometry and Microscopy Association, Chinese Electron Microcopy Society, Australian Microscopy and Microanalysis Society, Journal of Microscopy, Journal of Advanced Microscopy Research, Expert Interviews, and MarketsandMarkets Analysis In 2016, the SEM segment is expected to account for a larger share of the electron microscopes market in Brazil. This segment is projected to reach USD 103.7 million by 2021 from USD 63.0 million in 2016, at a higher CAGR of 10.5% during the forecast period. FIGURE 48 STM TO ACCOUNT FOR THE LARGEST SHARE OF THE SPM MARKET IN BRAZIL IN 2016 Source: Annual Reports, Press Releases, SEC Filings, Investor Presentations, Microscopy Society of America, Canadian Cytometry and Microscopy Association, Chinese Electron Microcopy Society, Australian Microscopy and Microanalysis Society, Journal of Microscopy, Journal of Advanced Microscopy Research, Expert Interviews, and MarketsandMarkets Analysis Scanning Tunneling Microscopes Atomic Force Microscopes Near-field Scanning Microscope 2016 19.2 7.3 1.4 2021 24.6 9.4 1.7 CAGR 5.0% 5.0% 5.1% 0 5 10 15 20 25 30 MarketSize(USDMillion)
  • 135.
    135 MICROSCOPY MARKET –GLOBAL FORECAST TO 2021 © MarketsandMarkets TABLE 118 BRAZIL: SPM MARKET SIZE, BY TYPE, 2014-2021 (USD MILLION) Type 2014 2015 2016 2021 CAGR (2016–2021) STM 17.3 18.2 19.2 24.6 5.0% AFM 6.6 7.0 7.3 9.4 5.1% Near-field Scanning Microscopes 1.2 1.3 1.4 1.7 5.1% Total 25.2 26.5 27.9 35.7 5.0% Source: Annual Reports, Press Releases, SEC Filings, Investor Presentations, Microscopy Society of America, Canadian Cytometry and Microscopy Association, Chinese Electron Microcopy Society, Australian Microscopy and Microanalysis Society, Journal of Microscopy, Journal of Advanced Microscopy Research, Expert Interviews, and MarketsandMarkets Analysis In 2016, the STM segment is expected to account for the largest share of the SPM market in Brazil. This segment is projected to reach USD 24.6 million by 2021 from USD 19.2 million in 2016, at a CAGR of 5.0% during the forecast period. TABLE 119 BRAZIL: MICROSCOPY MARKET SIZE, BY APPLICATION, 2014-2021 (USD MILLION) Application 2014 2015 2016 2021 CAGR (2016–2021) Semiconductors 62.5 67.0 71.8 102.4 7.3% Life Sciences 60.7 65.2 70.1 101.6 7.7% Material Sciences 35.7 37.2 39.1 48.4 4.4% Nanotechnology 19.6 21.6 23.7 38.0 10.0% Total 178.4 191.0 204.7 290.4 7.2% Source: Annual Reports, Press Releases, SEC Filings, Investor Presentations, Microscopy Society of America, Canadian Cytometry and Microscopy Association, Chinese Electron Microcopy Society, Australian Microscopy and Microanalysis Society, Journal of Microscopy, Journal of Advanced Microscopy Research, Expert Interviews, and MarketsandMarkets Analysis In 2016, the semiconductors segment is expected to account for the largest share of the microscopy market in Brazil. This application segment is projected to reach USD 102.4 million by 2021 from USD 71.8 million in 2016, at a CAGR of 7.3% during the forecast period. TABLE 120 BRAZIL: MICROSCOPY MARKET SIZE, BY END USER, 2014-2021 (USD MILLION) End User 2014 2015 2016 2021 CAGR (2016–2021) Academic Institutes 90.4 98.2 106.8 162.2 8.7% Industries 54.9 58.3 62.0 84.6 6.4% Other End Users 33.2 34.5 35.9 43.6 3.9% Total 178.4 191.0 204.7 290.4 7.2% Source: Annual Reports, Press Releases, SEC Filings, Investor Presentations, Microscopy Society of America, Canadian Cytometry and Microscopy Association, Chinese Electron Microcopy Society, Australian Microscopy and Microanalysis Society, Journal of Microscopy, Journal of Advanced Microscopy Research, Expert Interviews, and MarketsandMarkets Analysis In 2016, the academic institutes segment is expected to account for the largest share of the microscopy market in Brazil. This end-user segment is projected to reach USD 162.2 million by 2021 from USD 106.8 million in 2016, at a CAGR of 8.7% during the forecast period.
  • 136.
    136 MICROSCOPY MARKET –GLOBAL FORECAST TO 2021 © MarketsandMarkets 9.5.2 MEXICO Mexico is expected to account for the second-largest share of 24.5% of the RoW microscopy market in 2016. In the past, growth of Mexico’s microscopy market has been driven mainly by growth of the country’s clinical research industry. According to the Asociación Mexicana de Industrias de Investigación Farmacéutica (AMIIF), more than 1,250 research institutions and 2,000 researchers were involved in clinical trials in 2005. The rising number of clinical trials and research and development activities by pharmaceutical and biotechnology companies is expected to drive the market for microscopy in Mexico during the forecast period. Furthermore, growing demand from universities for state-of-the-art research facilities is another key driver for growth of the microscopy market in Mexico. Mexico has more than 50 universities and public centers conducting research on nanotechnology. Thus, growing focus on nanotechnology presents significant growth opportunities in the future. However, high market risk is a major factor limiting growth of this market. FIGURE 49 ELECTRON MICROSCOPES PRODUCT SEGMENT TO ACCOUNT FOR THE LARGEST SHARE OF THE MEXICAN MICROSCOPY MARKET IN 2016 Source: Annual Reports, Press Releases, SEC Filings, Investor Presentations, Microscopy Society of America, Canadian Cytometry and Microscopy Association, Chinese Electron Microcopy Society, Australian Microscopy and Microanalysis Society, Journal of Microscopy, Journal of Advanced Microscopy Research, Expert Interviews, and MarketsandMarkets Analysis TABLE 121 MEXICO: MICROSCOPY MARKET SIZE, BY PRODUCT, 2014-2021 (USD MILLION) Product 2014 2015 2016 2021 CAGR (2016–2021) Optical Microscopes 42.5 43.7 45.1 51.9 2.9% Electron Microscopes 39.9 43.3 46.9 70.3 8.4% SPM 15.2 15.7 16.3 19.1 3.2% Confocal Microscopes 10.0 10.5 11.1 13.8 4.5% Total 107.6 113.2 119.3 155.1 5.4% Source: Annual Reports, Press Releases, SEC Filings, Investor Presentations, Microscopy Society of America, Canadian Cytometry and Microscopy Association, Chinese Electron Microcopy Society, Australian Microscopy and Microanalysis Society, Journal of Microscopy, Journal of Advanced Microscopy Research, Expert Interviews, and MarketsandMarkets Analysis In 2016, the electron microscopes segment is expected to account for the largest share of the microscopy market in Mexico. This product segment is projected to reach USD 70.3 million by 2021 from USD 46.9 million in 2016, at the highest CAGR of 8.4% during the forecast period. Electron Microcsopes Optical Microcsopes Scanning Probe Microcsopes Confocal Microcsopes 2016 46.9 45.1 16.3 11.1 2021 70.3 51.9 19.1 13.8 CAGR 8.4% 2.8% 3.2% 4.4% 0 10 20 30 40 50 60 70 80 MarketSize(USDMillion)
  • 137.
    137 MICROSCOPY MARKET –GLOBAL FORECAST TO 2021 © MarketsandMarkets TABLE 122 MEXICO: OPTICAL MICROSCOPES MARKET SIZE, BY TYPE, 2014-2021 (USD MILLION) Type 2014 2015 2016 2021 CAGR (2016–2021) Fluorescence Microscopes 31.7 31.9 32.1 32.6 0.3% Super-resolution Microscopes 10.8 11.9 12.9 19.3 8.4% Total 42.5 43.7 45.1 51.9 2.9% Source: Annual Reports, Press Releases, SEC Filings, Investor Presentations, Microscopy Society of America, Canadian Cytometry and Microscopy Association, Chinese Electron Microcopy Society, Australian Microscopy and Microanalysis Society, Journal of Microscopy, Journal of Advanced Microscopy Research, Expert Interviews, and MarketsandMarkets Analysis In 2016, the fluorescence microscopes segment is expected to account for a larger share of the optical microscopes market in Mexico. This segment is projected to reach USD 32.6 million by 2021 from USD 32.1 million in 2016, at a CAGR of 0.3% during the forecast period. TABLE 123 MEXICO: ELECTRON MICROSCOPES MARKET SIZE, BY TYPE, 2014-2021 (USD MILLION) Type 2014 2015 2016 2021 CAGR (2016–2021) SEM 31.2 33.8 36.7 55.4 8.6% Transmission Electron Microscopes 8.7 9.4 10.2 14.9 7.9% Total 39.9 43.3 46.9 70.3 8.4% Source: Annual Reports, Press Releases, SEC Filings, Investor Presentations, Microscopy Society of America, Canadian Cytometry and Microscopy Association, Chinese Electron Microcopy Society, Australian Microscopy and Microanalysis Society, Journal of Microscopy, Journal of Advanced Microscopy Research, Expert Interviews, and MarketsandMarkets Analysis In 2016, the SEM segment is expected to account for a larger share of the electron microscopes market in Mexico. This segment is projected to reach USD 55.4 million by 2021 from USD 36.7 million in 2016, at a higher CAGR of 8.6% during the forecast period. TABLE 124 MEXICO: SPM MARKET SIZE, BY TYPE, 2014-2021 (USD MILLION) Type 2014 2015 2016 2021 CAGR (2016–2021) STM 10.45 10.81 11.20 13.11 3.2% AFM 3.99 4.13 4.28 5.02 3.3% Near-field Scanning Microscopes 0.74 0.76 0.79 0.93 3.3% Total 15.17 15.70 16.26 19.06 3.2% Source: Annual Reports, Press Releases, SEC Filings, Investor Presentations, Microscopy Society of America, Canadian Cytometry and Microscopy Association, Chinese Electron Microcopy Society, Australian Microscopy and Microanalysis Society, Journal of Microscopy, Journal of Advanced Microscopy Research, Expert Interviews, and MarketsandMarkets Analysis In 2016, the STM segment is expected to account for the largest share of the SPM market in Mexico. This segment is projected to reach USD 13.11 million by 2021 from USD 11.20 million in 2016, at a CAGR of 3.2% during the forecast period.
  • 138.
    138 MICROSCOPY MARKET –GLOBAL FORECAST TO 2021 © MarketsandMarkets TABLE 125 MEXICO: MICROSCOPY MARKET SIZE, BY APPLICATION, 2014-2021 (USD MILLION) Application 2014 2015 2016 2021 CAGR (2016–2021) Semiconductors 37.7 39.7 41.9 54.7 5.5% Life Sciences 36.6 38.6 40.9 54.3 5.8% Material Sciences 21.5 22.1 22.8 25.8 2.5% Nanotechnology 11.8 12.8 13.8 20.3 8.1% Total 107.6 113.2 119.3 155.1 5.4% Source: Annual Reports, Press Releases, SEC Filings, Investor Presentations, Microscopy Society of America, Canadian Cytometry and Microscopy Association, Chinese Electron Microcopy Society, Australian Microscopy and Microanalysis Society, Journal of Microscopy, Journal of Advanced Microscopy Research, Expert Interviews, and MarketsandMarkets Analysis In 2016, the semiconductors segment is expected to account for the largest share of the microscopy market in Mexico. This application segment is projected to reach USD 54.7 million by 2021 from USD 41.9 million in 2016, at a CAGR of 5.5% during the forecast period. TABLE 126 MEXICO: MICROSCOPY MARKET SIZE, BY END USER, 2014-2021 (USD MILLION) End User 2014 2015 2016 2021 CAGR (2016–2021) Academic Institutes 54.5 58.2 62.2 86.6 6.8% Industries 33.1 34.5 36.1 45.2 4.6% Other End Users 20.0 20.4 21.0 23.3 2.1% Total 107.6 113.2 119.3 155.1 5.4% Source: Annual Reports, Press Releases, SEC Filings, Investor Presentations, Microscopy Society of America, Canadian Cytometry and Microscopy Association, Chinese Electron Microcopy Society, Australian Microscopy and Microanalysis Society, Journal of Microscopy, Journal of Advanced Microscopy Research, Expert Interviews, and MarketsandMarkets Analysis In 2016, the academic institutes segment is expected to account for the largest share of the microscopy market in Mexico. This end-user segment is projected to reach USD 86.6 million by 2021 from USD 62.2 million in 2016, at the highest CAGR of 6.8% during the forecast period.
  • 139.
    139 MICROSCOPY MARKET –GLOBAL FORECAST TO 2021 © MarketsandMarkets 9.5.3 ARGENTINA Argentina is expected to account for a 9.6% share of the RoW microscopy market in 2016. The nation has a strong research base with the highest number of researchers (3.06/1000) within Latin America. This represents huge market potential for laboratory instruments, including microscopes and imaging devices. Government initiatives to promote and facilitate basic research and technological investment, through the establishment of institutions such as the National Institute for Scientific and Technological Promotion, are expected to boost research activities in the country, which will ultimately drive its microscopy market. TABLE 127 ARGENTINA: MICROSCOPY MARKET SIZE, BY PRODUCT, 2014-2021 (USD MILLION) Product 2014 2015 2016 2021 CAGR (2016–2021) Optical Microscopes 16.0 16.9 17.8 23.2 5.4% Electron Microscopes 15.0 16.7 18.6 31.4 11.1% SPM 5.7 6.1 6.4 8.5 5.8% Confocal Microscopes 3.8 4.0 4.4 6.2 7.1% Total 40.6 43.7 47.2 69.3 8.0% Source: Annual Reports, Press Releases, SEC Filings, Investor Presentations, Microscopy Society of America, Canadian Cytometry and Microscopy Association, Chinese Electron Microcopy Society, Australian Microscopy and Microanalysis Society, Journal of Microscopy, Journal of Advanced Microscopy Research, Expert Interviews, and MarketsandMarkets Analysis In 2016, the electron microscopes segment is expected to account for the largest share of the microscopy market in Argentina. This product segment is projected to reach USD 31.4 million by 2021 from USD 18.6 million in 2016, at the highest CAGR of 11.1% during the forecast period. TABLE 128 ARGENTINA: OPTICAL MICROSCOPES MARKET SIZE, BY TYPE, 2014-2021 (USD MILLION) Type 2014 2015 2016 2021 CAGR (2016–2021) Fluorescence Microscopes 11.9 12.3 12.7 14.6 2.7% Super-resolution Microscopes 4.1 4.6 5.1 8.6 11.1% Total 16.0 16.9 17.8 23.2 5.4% Source: Annual Reports, Press Releases, SEC Filings, Investor Presentations, Microscopy Society of America, Canadian Cytometry and Microscopy Association, Chinese Electron Microcopy Society, Australian Microscopy and Microanalysis Society, Journal of Microscopy, Journal of Advanced Microscopy Research, Expert Interviews, and MarketsandMarkets Analysis In 2016, the fluorescence microscopes segment is expected to account for a larger share of the optical microscopes market in Argentina. This segment is projected to reach USD 14.6 million by 2021 from USD 12.7 million in 2016, at a CAGR of 2.7% during the forecast period.
  • 140.
    140 MICROSCOPY MARKET –GLOBAL FORECAST TO 2021 © MarketsandMarkets TABLE 129 ARGENTINA: ELECTRON MICROSCOPES MARKET SIZE, BY TYPE, 2014-2021 (USD MILLION) Type 2014 2015 2016 2021 CAGR (2016–2021) SEM 11.8 13.1 14.5 24.8 11.3% Transmission Electron Microscopes 3.3 3.6 4.0 6.7 10.6% Total 15.0 16.7 18.6 31.4 11.1% Source: Annual Reports, Press Releases, SEC Filings, Investor Presentations, Microscopy Society of America, Canadian Cytometry and Microscopy Association, Chinese Electron Microcopy Society, Australian Microscopy and Microanalysis Society, Journal of Microscopy, Journal of Advanced Microscopy Research, Expert Interviews, and MarketsandMarkets Analysis In 2016, the SEM segment is expected to account for a larger share of the electron microscopes market in Argentina. This segment is projected to reach USD 24.8 million by 2021 from USD 14.5 million in 2016, at a higher CAGR of 11.3% during the forecast period. TABLE 130 ARGENTINA: SPM MARKET SIZE, BY TYPE, 2014-2021 (USD MILLION) Type 2014 2015 2016 2021 CAGR (2016–2021) STM 3.94 4.18 4.43 5.86 5.8% AFM 1.50 1.59 1.69 2.24 5.8% Near-field Scanning Microscopes 0.28 0.29 0.31 0.41 5.9% Total 5.72 6.06 6.44 8.52 5.8% Source: Annual Reports, Press Releases, SEC Filings, Investor Presentations, Microscopy Society of America, Canadian Cytometry and Microscopy Association, Chinese Electron Microcopy Society, Australian Microscopy and Microanalysis Society, Journal of Microscopy, Journal of Advanced Microscopy Research, Expert Interviews, and MarketsandMarkets Analysis In 2016, the STM segment is expected to account for the largest share of the SPM market in Argentina. This segment is projected to reach USD 5.9 million by 2021 from USD 4.4 million in 2016, at a CAGR of 5.8% during the forecast period.
  • 141.
    141 MICROSCOPY MARKET –GLOBAL FORECAST TO 2021 © MarketsandMarkets FIGURE 50 NANOTECHNOLOGY APPLICATION SEGMENT TO OFFER LUCRATIVE GROWTH OPPORTUNITIES IN ARGENTINA DURING THE FORECAST PERIOD Source: Annual Reports, Press Releases, SEC Filings, Investor Presentations, Microscopy Society of America, Canadian Cytometry and Microscopy Association, Chinese Electron Microcopy Society, Australian Microscopy and Microanalysis Society, Journal of Microscopy, Journal of Advanced Microscopy Research, Expert Interviews, and MarketsandMarkets Analysis TABLE 131 ARGENTINA: MICROSCOPY MARKET SIZE, BY APPLICATION, 2014-2021 (USD MILLION) Application 2014 2015 2016 2021 CAGR (2016–2021) Semiconductors 14.2 15.3 16.6 24.4 8.1% Life Sciences 13.8 14.9 16.2 24.3 8.5% Material Sciences 8.1 8.5 9.0 11.6 5.1% Nanotechnology 4.5 4.9 5.5 9.1 10.7% Total 40.6 43.7 47.2 69.3 8.0% Source: Annual Reports, Press Releases, SEC Filings, Investor Presentations, Microscopy Society of America, Canadian Cytometry and Microscopy Association, Chinese Electron Microcopy Society, Australian Microscopy and Microanalysis Society, Journal of Microscopy, Journal of Advanced Microscopy Research, Expert Interviews, and MarketsandMarkets Analysis In 2016, the semiconductors segment is expected to account for the largest share of the microscopy market in Argentina. This application segment is projected to reach USD 24.4 million by 2021 from USD 16.6 million in 2016, at a CAGR of 8.1% during the forecast period. Semiconductors Life Sciences Material Sciences Nanotechnology 2016 16.6 16.2 9.0 5.5 2021 24.4 24.3 11.6 9.1 CAGR 8.0% 8.4% 5.0% 10.7% 0 5 10 15 20 25 30 MarketSize(USDMillion)
  • 142.
    142 MICROSCOPY MARKET –GLOBAL FORECAST TO 2021 © MarketsandMarkets TABLE 132 ARGENTINA: MICROSCOPY MARKET SIZE, BY END USER, 2014-2021 (USD MILLION) End User 2014 2015 2016 2021 CAGR (2016–2021) Academic Institutes 20.5 22.5 24.6 38.7 9.5% Industries 12.5 13.3 14.3 20.2 7.1% Other End User 7.5 7.9 8.3 10.4 4.7% Total 40.6 43.7 47.2 69.3 8.0% Source: Annual Reports, Press Releases, SEC Filings, Investor Presentations, Microscopy Society of America, Canadian Cytometry and Microscopy Association, Chinese Electron Microcopy Society, Australian Microscopy and Microanalysis Society, Journal of Microscopy, Journal of Advanced Microscopy Research, Expert Interviews, and MarketsandMarkets Analysis In 2016, the academic institutes segment is expected to account for the largest share of the microscopy market in Argentina. This end-user segment is projected to reach USD 38.7 million by 2021 from USD 24.6 million in 2016, at the highest CAGR of 9.5% during the forecast period. 9.5.4 REST OF LATIN AMERICA (ROLA) The Rest of Latin America (RoLA) region consists of microscopy markets in Chile, Colombia, and Peru. This segment is expected to account for a 23.7% share of the RoW microscopy market in 2016. Among the countries in RoLA, Chile has the highest growth potential for the microscopy market. Government initiatives to boost research and development are the major driver of market growth. In 1981, the Chilean government created the national fund for scientific and technological development (FONDECYT) to promote basic scientific and technological research in the country. Since 1981, it has funded more than 16,000 research projects. In 2013, it spent USD 158.2 million on various research projects. In addition, the growing biotechnology and clinical trials market in Chile represents huge growth potential for the microscopy market in the country. Colombia and Peru also represent significant markets for microscopy in the RoLA region. Colombia has attracted scientific and technological investment due to the 125% income tax exemption for investing companies. On the other hand, Peru, with its agriculture-based economy, represents a potential research base for the biotechnology industry. TABLE 133 ROLA: MICROSCOPY MARKET SIZE, BY PRODUCT, 2014-2021 (USD MILLION) Product 2014 2015 2016 2021 CAGR (2016–2021) Optical Microscopes 39.6 41.6 43.7 55.5 4.9% Electron Microscopes 37.2 41.1 45.4 75.1 10.6% SPM 14.1 14.9 15.8 20.4 5.3% Confocal Microscopes 9.3 10.0 10.7 14.7 6.6% Total 100.3 107.6 115.6 165.7 7.5% Source: Annual Reports, Press Releases, SEC Filings, Investor Presentations, Microscopy Society of America, Canadian Cytometry and Microscopy Association, Chinese Electron Microcopy Society, Australian Microscopy and Microanalysis Society, Journal of Microscopy, Journal of Advanced Microscopy Research, Expert Interviews, and MarketsandMarkets Analysis In 2016, the electron microscopes segment is expected to account for the largest share of the microscopy market in the RoLA. This product segment is projected to reach USD 75.1 million by 2021 from USD 45.4 million in 2016, at the highest CAGR of 10.6% during the forecast period.
  • 143.
    143 MICROSCOPY MARKET –GLOBAL FORECAST TO 2021 © MarketsandMarkets TABLE 134 ROLA: OPTICAL MICROSCOPES MARKET SIZE, BY TYPE, 2014-2021 (USD MILLION) Type 2014 2015 2016 2021 CAGR (2016–2021) Fluorescence Microscopes 29.5 30.3 31.1 34.8 2.3% Super-resolution Microscopes 10.1 11.3 12.5 20.7 10.6% Total 39.6 41.6 43.7 55.5 4.9% Source: Annual Reports, Press Releases, SEC Filings, Investor Presentations, Microscopy Society of America, Canadian Cytometry and Microscopy Association, Chinese Electron Microcopy Society, Australian Microscopy and Microanalysis Society, Journal of Microscopy, Journal of Advanced Microscopy Research, Expert Interviews, and MarketsandMarkets Analysis In 2016, the fluorescence microscopes segment is expected to account for a larger share of the optical microscopes market in the RoLA region. This segment is projected to reach USD 34.8 million by 2021 from USD 31.1 million in 2016, at a CAGR of 2.3% during the forecast period. TABLE 135 ROLA: ELECTRON MICROSCOPES MARKET SIZE, BY TYPE, 2014-2021 (USD MILLION) Type 2014 2015 2016 2021 CAGR (2016–2021) SEM 29.1 32.2 35.6 59.2 10.7% Transmission Electron Microscopes 8.2 9.0 9.9 15.9 10.1% Total 37.2 41.1 45.4 75.1 10.6% Source: Annual Reports, Press Releases, SEC Filings, Investor Presentations, Microscopy Society of America, Canadian Cytometry and Microscopy Association, Chinese Electron Microcopy Society, Australian Microscopy and Microanalysis Society, Journal of Microscopy, Journal of Advanced Microscopy Research, Expert Interviews, and MarketsandMarkets Analysis In 2016, the SEM segment is expected to account for a larger share of the electron microscopes market in the RoLA. This segment is projected to reach USD 59.2 million by 2021 from USD 35.6 million in 2016, at a higher CAGR of 10.7% during the forecast period. FIGURE 51 STM TO ACCOUNT FOR THE HIGHEST SHARE IN THE SPM MARKET IN ROLA IN 2016 Source: Annual Reports, Press Releases, SEC Filings, Investor Presentations, Microscopy Society of America, Canadian Cytometry and Microscopy Association, Chinese Electron Microcopy Society, Australian Microscopy and Microanalysis Society, Journal of Microscopy, Journal of Advanced Microscopy Research, Expert Interviews, and MarketsandMarkets Analysis Scanning Tunneling Microscopes Atomic Force Microscopes Near-field Scanning Microscopes 2016 10.8 4.1 0.8 2021 14.0 5.4 1.0 CAGR 5.2% 5.3% 5.3% 0 2 4 6 8 10 12 14 16 MarketSize(USDMillion)
  • 144.
    144 MICROSCOPY MARKET –GLOBAL FORECAST TO 2021 © MarketsandMarkets TABLE 136 ROLA: SPM MARKET SIZE, BY TYPE, 2014-2021 (USD MILLION) Type 2014 2015 2016 2021 CAGR (2016–2021) STM 9.7 10.3 10.8 14.0 5.3% AFM 3.7 3.9 4.1 5.4 5.3% Near-field Scanning Microscopes 0.7 0.7 0.8 1.0 5.4% Total 14.1 14.9 15.8 20.4 5.3% Source: Annual Reports, Press Releases, SEC Filings, Investor Presentations, Microscopy Society of America, Canadian Cytometry and Microscopy Association, Chinese Electron Microcopy Society, Australian Microscopy and Microanalysis Society, Journal of Microscopy, Journal of Advanced Microscopy Research, Expert Interviews, and MarketsandMarkets Analysis In 2016, the STM segment is expected to account for the largest share of the SPM market in the RoLA. This segment is projected to reach USD 14.0 million by 2021 from USD 10.8 million in 2016, at a CAGR of 5.3% during the forecast period. TABLE 137 ROLA: MICROSCOPY MARKET SIZE, BY APPLICATION, 2014-2021 (USD MILLION) Application 2014 2015 2016 2021 CAGR (2016–2021) Semiconductors 35.1 37.7 40.6 58.4 7.6% Life Sciences 34.1 36.7 39.6 58.0 7.9% Material Sciences 20.1 21.0 22.1 27.6 4.6% Nanotechnology 11.0 12.1 13.4 21.7 10.2% Total 100.3 107.6 115.6 165.7 7.5% Source: Annual Reports, Press Releases, SEC Filings, Investor Presentations, Microscopy Society of America, Canadian Cytometry and Microscopy Association, Chinese Electron Microcopy Society, Australian Microscopy and Microanalysis Society, Journal of Microscopy, Journal of Advanced Microscopy Research, Expert Interviews, and MarketsandMarkets Analysis In 2016, the semiconductors segment is expected to account for the largest share of the microscopy market in the RoLA. This application segment is projected to reach USD 58.4 million by 2021 from USD 40.6 million in 2016, at a CAGR of 7.6% during the forecast period. TABLE 138 ROLA: MICROSCOPY MARKET SIZE, BY END USER, 2014-2021 (USD MILLION) End User 2014 2015 2016 2021 CAGR (2016–2021) Academic Institutes 50.8 55.3 60.3 92.6 9.0% Industries 30.8 32.8 35.0 48.3 6.6% Other End User 18.7 19.4 20.3 24.9 4.2% Total 100.3 107.6 115.6 165.7 7.5% Source: Annual Reports, Press Releases, SEC Filings, Investor Presentations, Microscopy Society of America, Canadian Cytometry and Microscopy Association, Chinese Electron Microcopy Society, Australian Microscopy and Microanalysis Society, Journal of Microscopy, Journal of Advanced Microscopy Research, Expert Interviews, and MarketsandMarkets Analysis In 2016, the academic institutes segment is expected to account for the largest share of the microscopy market in the RoLA. This end-user segment is projected to reach USD 92.6 million by 2021 from USD 60.3 million in 2016, at a CAGR of 9.0% during the forecast period.
  • 145.
    145 MICROSCOPY MARKET –GLOBAL FORECAST TO 2021 © MarketsandMarkets 10 COMPETITIVE LANDSCAPE KEY FINDINGS  New product launches was the most widely adopted growth strategy; it accounted for 82.03% of the total number of strategies pursued by key companies in the microscopy market  Agreements, partnerships, and collaborations was the second-most preferred strategy pursued by companies in the microscopy market; it accounted for a share of 10.94%  Acquisitions accounted for a share of 3.91% of the total number of strategies adopted by companies in the microscopy market  Expansions accounted for a share of 3.13% of the total number of strategies adopted by companies in the microscopy market  Leica Microsystems (Danaher Corporation) (U.S.), Carl Zeiss (Germany), Nikon Corporation (Japan), and FEI Company (Japan) are key companies active in the microscopy market
  • 146.
    146 MICROSCOPY MARKET –GLOBAL FORECAST TO 2021 © MarketsandMarkets 10.1 OVERVIEW This section of the report analyzes the strategies adopted by companies in the microscopy market between 2013 and 2016. Companies have implemented different strategies in order to maintain their positions and ensure long-term growth in the microscopy market. The key strategies implemented by companies in the microscopy market are new product launches; agreements, collaborations, and partnerships; acquisitions; and expansions. FIGURE 52 COMPANIES MAINLY PURSUED THE STRATEGY OF NEW PRODUCT LAUNCHES FROM 2013 TO JULY 2016 Note: Indicates events that will have a significant impact on the market Source: Press Releases, Expert Interviews, and MarketsandMarkets Analysis ORGANIC GROWTH STRATEGIES INORGANIC GROWTH STRATEGIES New Product Launches Agreements, Collaborations, and Partnerships Expansions Acquisitions DANAHER CORPORATION (LEICA MICROSYSTEMS) CARL ZEISS AG BRUKER CORPORATION NIKON CORPORATION FEI CO. • Vutara 352 Super-resolution Microscope • Contour Elite 3D Optical Microscopes • Ultima Investigator Multiphoton Microscope • Opterra Il Multipoint Scanning Confocal Microscope COMPANY NAME • Carl Zeiss acquired Xradia, Inc. (U.S.) • Leica Microsystems Collaborated with Yale University (U.S.) • Leica Microsystems Entered into an Agreement with TrueVision 3D Surgical (U.S.) • ZEISS LSM 880 Confocal Laser Scanning Microscope • ZEISS GeminiSEM and ZEISS Sigma Field Emission Scanning Electron Microscopes • Apreo Scanning Electron Microscope (SEM) • Helios NanoLab G3 DualBeam, a Combination of Electron and Ion Optics Microscopy • ECLIPSE Ts2R, a Compact Inverted Research Microscope • NIS-Elements C-ER High- resolution Confocal Imaging Software • Leica Microsystems Established an Experience Lab in Tokyo, Japan • FEI Co. acquired Lithicon AS, Australia • FEI Co. acquired nanoTechnology Systems Pty. Ltd. (NTS) (Australia) • Partnered with the University of Manchester’s National Graphene Institute (NGI) • Carl Zeiss Entered into a Public-private Partnership with UC Berkeley • Carl Zeiss Collaborated with the University of California, Berkeley • Leica DM4 B and Leica DM6 B Upright Research Microscopes • Leica EM Cryo CLEM Light and Electron Microscope (CLEM) • Leica M530 OH6 Neurosurgical Microscope • FEI Co. Opened a New Technology Center in the Czech Republic • Acquired Vutara Inc. (U.S.) • Acquired Prairie Technologies, Inc. (U.S.) • FEI Company Partnered with NovAliX (France) • FEI Co. collaborated with the Metal Labs at The University of Manchester's Electron Microscopy Centre in the School of Materials
  • 147.
    147 MICROSCOPY MARKET –GLOBAL FORECAST TO 2021 © MarketsandMarkets 10.2 MARKET ANALYSIS In 2015, the global optical microscopes market was dominated by Carl Zeiss (Germany), Leica Microsystems (Germany), Nikon Corporation (Japan), and Olympus Corporation (Japan). The electron microscopes market, on the other hand, was dominated by FEI Co. (U.S.), JEOL (Japan), and Hitachi High- Technologies (Japan). TABLE 139 OPTICAL MICROSCOPES MARKET RANKING, BY KEY COMPANY, 2015 Company Name Ranking Carl Zeiss 1 Nikon Corporation 2 Olympus Corporation 3 Danaher Corporation (Leica Microsystems) 4 Source: Annual Reports, SEC Filings, Press Releases, Investor Presentations, Expert Interviews, and MarketsandMarkets Analysis Among the top four companies in the optical microscopes market, Carl Zeiss held the top position in 2015. The company has strengthened its position in the market through the adoption of organic strategies such as new product launches and collaborations, agreements, and partnerships. Between 2013 and 2016, the company introduced various new products into its portfolio. For instance, in January 2016, Carl Zeiss introduced ZEISS Xradia Versa with FPX, an extension for the ZEISS Xradia Versa 500-series of 3D X-ray microscopes. The company also focuses on entering into collaborative agreements with academic institutions. In accordance with this, in June 2015, Carl Zeiss entered into a public-private partnership with UC Berkeley as part of the Brain Microscopy Innovation Center (BrainMIC), Berkeley BRAIN Initiative. Nikon Corporation held the second position in the optical microscopes market in 2015. The company focuses on launching new products in the microscopy segment. From 2013 to 2016, the company launched a wide range of innovative products, such as the ECLIPSE Ts2R compact inverted research microscope, the NIS-Elements C-ERDS-Ri2 high-resolution confocal imaging software, the DS-Qi2 monochrome microscope camera, the Ti-LAPP laser application system, and a wide range of stereo microscopes. Olympus Corporation held the third position in the optical microscopes market in 2015. The company adopted new product launches as its key strategy to strengthen its position in the market. In the past three years, the company has launched various microscopes, such as measuring microscopes, standalone microscopes, and super-resolution microscopes. Leica Microsystems held the fourth position in the optical microscopes market. The company has a robust product portfolio in the field of microscopy and has maintained its position in the market through continuous launch of products. In 2015, the company launched a wide range of innovative products, such as the Leica DMi8 (an inverted research microscope platform), the Leica DM4 B and the Leica DM6 B upright research microscope series, the Leica DVM6 digital microscope, and the Leica EM Cryo CLEM.
  • 148.
    148 MICROSCOPY MARKET –GLOBAL FORECAST TO 2021 © MarketsandMarkets TABLE 140 ELECTRON MICROSCOPES MARKET RANKING, BY KEY COMPANY, 2015 Company Name Ranking FEI Co. 1 JEOL Ltd. 2 Hitachi High-Technologies Corporation 3 Source: Annual Reports, SEC Filings, Press Releases, Investor Presentations, Expert Interviews, and MarketsandMarkets Analysis FEI Co. dominated the electron microscopes market in 2015. The company has maintained its footprint in the global electron microscopy market through continuous launch of innovative products. In the past three years, the company has launched a wide range of microscopes such as the Apreo scanning electron microscope (SEM), the Helios NanoLab G3 DualBeam —which is a combination of electron and ion optics microscopy, the Teneo VolumeScope (VS), the scanning electron microscope (SEM), and the Titan Halo transmission electron microscope (TEM). JEOL Ltd. accounted for the second position in the electron microscopes market. The company has a wide range of products and a significant global footprint in the microscopy market. To strengthen its position in this market, the company focuses on new product launch as its key strategy. In 2016, JEOL launched the JEM-F200, a multi-purpose transmission electron microscope, and JSM-IT100 InTouchScope scanning electron microscope. Hitachi High-Technologies held the third position in the electron microscopes market in 2015. The company strives to launch advanced electron microscopes and pursues the strategy of expansions in order to strengthen its position in the market. In accordance with this, the company established its Hitachi High- Technologies India Private Limited (Hitachi High-Tech India) subsidiary in Haryana, India, and a new production site in Omuta, Japan. TABLE 141 CONFOCAL MICROSCOPES MARKET RANKING, BY KEY COMPANY, 2015 Company Name Ranking Carl Zeiss 1 Nikon Corporation 2 Danaher Corporation (Leica Microsystems) 3 Olympus Corporation 4 Source: Annual Reports, SEC Filings, Press Releases, Investor Presentations, Expert Interviews, and MarketsandMarkets Analysis Among the top companies in the confocal microscopes segment, Carl Zeiss held the leading position in 2015. The company has retained its global leadership position through its broad range of innovative products. In May 2016, the company launched the ZEISS LSM 880 with Airyscan detector, a new confocal laser scanning microscope. Similarly, it introduced the ZEISS LSM 880 in April 2016, which is a confocal laser scanning microscope for material science and failure analysis; and the Smartproof 5 in January 2016, a widefield confocal microscope for industrial applications.
  • 149.
    149 MICROSCOPY MARKET –GLOBAL FORECAST TO 2021 © MarketsandMarkets TABLE 142 SPM MARKET SHARE, BY KEY COMPANY, 2015 Company Name Ranking Bruker Corporation 1 Asylum Research (Oxford Instruments) 2 NT-MDT 3 Agilent Technologies 4 Source: Annual Reports, SEC Filings, Press Releases, Investor Presentations, Expert Interviews, and MarketsandMarkets Analysis Bruker Corporation was the leading participant in the SPM market in 2015. The company has maintained its footprint in the global SPM market through continuous launches of new and innovative products. In May 2016, Bruker Corporation launched its SENTERRA II, a compact research-grade confocal multi-laser Raman microscope. In addition, in August 2015, the company launched its Opterra II, a multipoint scanning confocal microscope for quantitative live-cell analysis. 10.3 BATTLE FOR MARKET SHARE: NEW PRODUCT LAUNCHES IS THEKEY GROWTH STRATEGY ADOPTED BY MARKET COMPANIES As microscopy is a technology -industry, new product launches is the key strategy employed by market leading companies to remain competitive. 3.1% Expansions 10.9% Agreements, Partnerships, and Collaborations 82.1% New Product Launches 3.9% Acquisitions
  • 150.
    150 MICROSCOPY MARKET –GLOBAL FORECAST TO 2021 © MarketsandMarkets 10.4 NEW PRODUCT LAUNCHES Maximum new product launches were witnessed in the optical microscopes segment. In September 2014, Leica Microsystems launched the Leica DMi8 inverted microscope, which is equipped with additional features such as incident illumination port, infinity port, and laser systems. The strategy of new product launches accounted for the largest share of 82.1% of the total strategic developments in the global microscopy market. Companies adopted this strategy to develop new and advanced products, strengthen their product portfolios, and cater to the unmet needs of their customers. FEI Company (U.S.), Carl Zeiss (Germany), Hitachi High-Technologies (Japan), JEOL (Japan), Bruker Corporation (U.S.), and Asylum Research (U.S.) are among the leading manufacturing companies that adopted this strategy. TABLE 143 NEW PRODUCT LAUNCHES, 2013–2016 Month & Year Company Name Description May 2016 FEI Co. (U.S.) FEI introduced Apreo, a scanning electron microscope (SEM). The product utilizes the proprietary compound final lens design that allows improvement in resolution and backscatter detection at the lowest beam current. April 2016 Carl Zeiss (Germany) Carl Zeiss launched ZEISS LSM 880, a confocal laser scanning microscope for material science and failure analysis. The product comprises of the confocal fluorescence and other contrasting techniques that enables high-precision examination of nanomaterials, metals, polymers, and semiconductors, with maximum information content. The product also offers precise capture of 3D topography and the investigation of nanometer-scaled structures. This launch will help the company strengthen its confocal laser scanning microscope portfolio. December 2015 Bruker Corporation (U.S.) Bruker Corporation introduced Vutara 352, a super resolution microscope with high speed, more imaging depth, better resolution, and real-time quantitative capabilities as well as multimodal imaging. Vutara 352 can perform pair-correlation, co-location, cluster, and live-cell analysis with super resolution. This new launch will help the company to meet growing demand for high-speed imaging in the life science industry. November 2015 Nikon Corporation (Japan) Nikon Corporation launched ECLIPSE Ts2R, a compact inverted research microscope, which is easy to use and offers a wide variety of observation methods for medical and biological research fields. This launch will help the company enhance its brand image and strengthen its market presence. October 2015 Leica Microsystems (U.S.) Leica Microsystems introduced DMi8, an inverted research microscope platform. The product offers observation via an external, remote operation and monitoring, high throughput and complex screening. Leica DMi8 can be configured without the optical components associated with this optical path. Source: Press Releases
  • 151.
    151 MICROSCOPY MARKET –GLOBAL FORECAST TO 2021 © MarketsandMarkets 10.5 AGREEMENTS, PARTNERSHIPS, AND COLLABORATIONS Agreements, partnerships, and collaborations accounted for 10.9% of the total strategic developments in the microscopy market during 2013 to 2016. Companies such as FEI Company (U.S.), Leica Microsystems (Danaher Corporation) (U.S.), Carl Zeiss (Germany), Hitachi High-Technologies Corporation (Japan), JEOL (Japan), Bruker Corporation (U.S.), and Asylum Research (U.S.) adopted this strategy to increase their geographic reach and expand their product portfolios. TABLE 144 AGREEMENTS, PARTNERSHIPS, AND COLLABORATIONS, 2013–2016 Month & Year Company Name Description March 2016 FEI Company (U.S.) and NovAliX (France) FEI Company and NovAliX (France), a contract research organization, entered into a partnership to provide cryo-electron microscopy-based structural biology services for the pharmaceutical and biotech industry. The partnership combines application, training, and support with on-site personnel from FEI. This partnership will help the company to step into the broader commercialization and industrialization of the technology. June 2015 Carl Zeiss (Germany) and UC Berkeley (U.S.) Carl Zeiss entered into a public-private partnership with UC Berkeley (U.S.) as part of the Brain Microscopy Innovation Center (BrainMIC), Berkeley BRAIN Initiative. As part of the initiative, Carl Zeiss has delivered a variety of high performance microscopes and imaging systems. Under the partnership, Carl Zeiss will offer the latest updates of the equipment and, in turn, UC Berkeley researchers will provide feedback on any new or special neurotechnology needs to help Carl Zeiss produce future products best suited for the latest advances in neuroscience research endeavors. September 2014 Leica Microsystems (U.S.) and Yale University (U.S.) Leica Microsystems collaborated with Yale University (U.S.) to establish a new Microscopy Center of Excellence at Yale University’s campus. This collaboration has strengthened the company’s market reach in the U.S. August 2014 JEOL (Japan) with the Oxford University (U.K.), Johnson Matthey (U.K.), and Diamond Light Source (U.K.) JEOL collaborated with Oxford University (U.K.), Johnson Matthey (U.K.), and Diamond Light Source (U.K.), to establish a materials characterization facility at the Harwell Science and Innovation Campus. April 2014 Leica Microsystems (U.S.) and TrueVision 3D Surgical (U.S.) Leica Microsystems entered into an agreement with TrueVision 3D Surgical (U.S.), a neuro and ophthalmic 3D surgical visualization and guidance company. This agreement is aimed to incorporate the computer guidance platform of TrueVision into Leica’s ophthalmic microscopes for cataract and refractive surgeries. This agreement leveraged the expertise of TrueVision for developing technologically advanced products for Leica. Source: Press Releases
  • 152.
    152 MICROSCOPY MARKET –GLOBAL FORECAST TO 2021 © MarketsandMarkets 10.6 ACQUISITIONS Acquisitions accounted for 3.9% of the total strategic developments in the microscopy market. Major companies that adopted this strategy are Bruker Corporation (U.S.), Carl Zeiss (Germany), and FEI Co. (U.S.). TABLE 145 ACQUISITIONS, 2013–2016 Month & Year Company Name Description July 2014 Bruker Corporation (U.S.) acquired Vutara Inc. (U.S.) Bruker Corporation acquired Vutara Inc. (U.S.), a technology leader in high-speed, 3D, and super-resolution fluorescence microscopy, to utilize Vutara’s expertise. This acquisition strengthened Bruker’s biological microscopy segment by leveraging the expertise of Vutara and for including super- resolution and single-molecule localization (SML) microscopy in Bruker’s product portfolio. February 2014 FEI Co. (U.S.) acquired Lithicon AS (Australia) FEI Co. acquired Lithicon AS, Australia. This acquisition was conducted to access Lithicon’s expertise in digital rock technology services and core imaging and analysis. This helped FEI Co. extend its microscopy product line. September 2013 Bruker Corporation (U.S.) acquired Prairie Technologies, Inc. (U.S.) Bruker Corporation acquired Prairie Technologies, Inc. (U.S.), a provider of life science fluorescence microscopy products. This acquisition aimed to leverage Prairie’s expertise in Bruker’s existing life science atomic force microscopy (Bio-AFM) systems. The acquisition has strengthened Bruker’s Nano Surfaces Division in the life sciences market. August 2013 FEI Co. (U.S.) acquired nanoTechnology Systems Pty. Ltd. (NTS) (Australia), FEI Co. acquired nanoTechnology Systems Pty. Ltd. (NTS) (Australia), an electron and ion beam systems supplier. nanoTechnology Systems has been the distributor of FEI’s products for 10 years. This helped FEI expand its business in Australia and the Pacific countries. July 2013 Carl Zeiss (Germany) acquired Xradia, Inc. (U.S.), Carl Zeiss acquired Xradia, Inc. (U.S.), a provider of innovative 3D X-ray microscopes for industrial and academic research applications. Xradia, Inc. is now operating under the new name of Carl Zeiss X-ray Microscopy, Inc. This acquisition was to utilize Xradia’s expertise in Zeiss’ microscopy business, and it has helped Zeiss expand its business from light and electron microscopy to X-ray microscopy solutions. Source: Press Releases
  • 153.
    153 MICROSCOPY MARKET –GLOBAL FORECAST TO 2021 © MarketsandMarkets 10.7 EXPANSIONS Expansions accounted for 3.1% of the total strategic developments adopted by companies in the microscopy market. Companies adopted this strategy to expand their global presence. This key strategy was mainly adopted by FEI Company (U.S.), Hitachi High-Technologies (Japan), JEOL (Japan), Asylum Research (U.S.), and Leica Microsystems (Danaher Corporation) (U.S.). TABLE 146 EXPANSIONS, 2013-2016 Month & Year Company Name Description September 2014 FEI Co. (U.S.) FEI Co. opened a new technology center in the Czech Republic, in which the company invested CZK 800 million (approximately USD 38 million). This new setup is intended to employ about 600 people and produce approximately 60% of FEI’s electron microscopes. This will help the company expand its market in the European region. April 2014 Leica Microsystems (U.S.) Leica Microsystems expanded its business by introducing an Experience Lab in Tokyo, Japan. This expansion helped the company expand its presence and customer base in Japan. July 2014 Asylum Research (U.S.) Asylum Research opened its first Nanotechnology Lab for Atomic Force Microscopy (AFM) in India. This lab is equipped with MFP- 3D Classic and the MFP-3D Origin technology, which adds to the range of industrial analysis tools available for demonstration. This expansion helped the company strengthen its AFM market in the Asia-Pacific region. April 2013 Hitachi High-Technologies (Japan) Hitachi High-Technologies created a subsidiary, Hitachi High- Technologies India Private Limited (Hitachi High-Tech India) in Haryana, India. This new subsidiary mainly focuses on sale of industrial-use equipment, industrial materials, electronic materials and software, and related services. This will help the company increase its sales in the Asia-Pacific region. Source: Press Releases
  • 154.
    154 MICROSCOPY MARKET –GLOBAL FORECAST TO 2021 © MarketsandMarkets 11 COMPANY PROFILES 11.1 INTRODUCTION FIGURE 53 GEOGRAPHIC REVENUE MIX OF THE TOP FIVE MARKET COMPANIES IN 2015 *Note: Geographic shares are derived from the overall revenues of the individual companies in 2015. EMEA - Europe, the Middle East, and Africa Source: Annual Reports, SEC Filings, Press Releases, Investor Presentations, and MarketsandMarkets Analysis COMPANY MEDIUM (20%–40%) VERY HIGH (60% and Above) BRUKER CORPORATION CARL ZEISS AG FEI CO. NIKON CORPORATION DANAHER CORPORATION (LEICA MICROSYSTEMS) LOW *(0%–20%) (40%–60%) HIGH ASIA-PACIFICEMEAAMERICAS
  • 155.
    155 MICROSCOPY MARKET –GLOBAL FORECAST TO 2021 © MarketsandMarkets 11.2 BRUKER CORPORATION 11.2.1 BUSINESS OVERVIEW Founded in 1960, with headquarters in Massachusetts, U.S., Bruker Corporation designs, manufactures, and provides proprietary life science systems based on spectrometry technology platforms in more than 90 countries across the globe. The company develops tools for research on life science and advanced materials based on X-ray technology, and offers a wide range of field analytical systems for substance detection and pathogen identification. Bruker operates through two segments, Bruker Scientific Instruments (BSI) and Bruker Energy & Supercon Technologies (BEST). The BSI segment caters to the company’s microscopy business. The company operates in the U.S., Europe, and the Asia-Pacific region, and its end users include medical companies, private and public research and development laboratories, academic institutions, and government agencies. As of 2015, the company had a headcount of 6,000 employees. FIGURE 54 BRUKER CORPORATION: COMPANY SNAPSHOT *Note: The total for business revenue mix is more than 100% due to eliminations. Source: Company Website, Annual Reports, and SEC Filings Founded: 1960 Headquarters: Massachusetts, U.S. No. of Employees: 6,000 Revenue: USD 1,623.8 Million R&D Expenditure: USD 145.7 Million Ownership: Public COMPANY AT A GLANCE - 2015 GEOGRAPHIC REVENUE MIX BUSINESS REVENUE MIX RECENT FINANCIALS 41.8% 25.6% 23.4% 9.2% Europe Asia-Pacific U.S. Rest of the World 91.8% 8.2% Bruker Scientific Instruments (BSI) Bruker Energy and Supercon Technologies (BEST) 1,839.4 1,808.9 1,623.8 10.4% 9.6% 9.0% 8.0% 8.5% 9.0% 9.5% 10.0% 10.5% 1,500 1,550 1,600 1,650 1,700 1,750 1,800 1,850 1,900 2013 2014 2015 R&DExpenditure(%) TotalRevenue(USDMillion)
  • 156.
    156 MICROSCOPY MARKET –GLOBAL FORECAST TO 2021 © MarketsandMarkets 11.2.2 PRODUCTS OFFERED Category Product Atomic Force Microscopy (AFM)  Dimension FastScan  MultiMode 8  Dimension Icon  BioScope Catalyst  Dimension FastScan Bio  Inspire  Innova-IRIS  Dimension Icon- Raman  BioScope Catalyst-IRIS  Dimension Edge  Innova  Dimension Edge PSS  InSight-450 3DAFM  InSight 3DAFM  Dimension AFP  AFM Probes and Accessories Surface Analysis  Atomic Force Microscopes  3D Optical Microscopes FTIR Microscopes/Raman Microscopes  HYPERION Series FT-IR Microscopes  SENTERRA II Compact Raman Microscope  LUMOS FTIR Microscope 3D Industrial Optical Microscopy  ContourGT-I  ContourGT InMotion  ContourGT-K  ContourGT-X  NPFLEX-LA  NPFLEX  ContourSP  HD9800+ Stylus Profilometry  DektakXT  Dektak XTL Fluorescence Optical Microscopy  Opterra  Opterra II  Opterra Multipoint Confocal  Vutara 350  Vutara 352  Vutara Super-resolution  Ultima  Ultima In Vivo  Ultima Multiphoton
  • 157.
    157 MICROSCOPY MARKET –GLOBAL FORECAST TO 2021 © MarketsandMarkets 11.2.3 RECENT DEVELOPMENTS Month & Year Approach Description May 2016 Product Enhancement Bruker Corporation launched SENTERRA II, a compact research-grade confocal multi-laser Raman microscope. SENTERRA II is the advanced version of SENTERRA with novel features such as compact size, easy- to-use interface, and higher resolution. The microscope has a wide array of applications, including in material science, pharmaceutical and novel nano-materials, life science, forensics, art, and geology. January 2016 Product Enhancement Bruker’s Nano Surfaces Division introduced the MultiMode 8-HR Atomic Force Microscope (AFM) replacing the successor model— MultiMode platform. MultiMode 8-HR offers enhanced capabilities such as high speed and higher resolution imaging for nanomechanics. With this launch, the company has enhanced its visibility in the highly competitive microscopy market. December 2015 New Product Launch Bruker Corporation introduced Vutara 352, a super-resolution microscope with high speed, more imaging depth, better resolution, and real-time quantitative capabilities & multimodal imaging. Vutara 352 can perform pair-correlation, co-location, cluster, and live-cell analysis with super resolution. This new launch will help the company cater to growing demand for high-speed imaging in the life sciences industry. November 2015 New Product Launch Bruker Corporation launched the Ultima Investigator Multiphoton Microscope for high-performance in vivo imaging. For advanced in vivo neural activity research, Ultima Investigator utilizes a rotatable nose piece that allows off-axis imaging, which is useful for brain imaging applications. August 2015 New Product Launch Bruker Corporation launched Opterra II, a multipoint scanning confocal microscope that symbolizes the next generation of quantitative live-cell microscopes. Opterra II has features such as high speed and resolution, illumination uniformity, low photo-toxicity, and photo-bleaching capabilities. May 2015 New Product Launch Bruker Corporation introduced the Contour Elite 3D Optical Microscope, a fully integrated, high-definition microscope with three- dimensional (3D) optical metrology functionality. With features like high-speed operation, accuracy, repeatability, and imaging & display advantage, the microscope is useful for top-level research and development and production QC facilities. September 2014 New Product Launch Bruker Corporation introduced Innova-IRIS, the first guaranteed Tip- enhanced Raman Spectroscopy (TERS) system designed to accelerate the adoption of nano-Raman spectroscopy research. Innova-IRIS is a combination of TERS probes based on high-contrast tuning-fork with nano-Raman spectroscopy and high-performance atomic force microscopy (AFM) capabilities. This launch enabled the company to provide technologically-advanced products to its customers. July 2014 Acquisition Bruker Corporation acquired Vutara Inc. (U.S.), a technology leader in high-speed, 3D, and super-resolution fluorescence microscopy. This acquisition strengthened Bruker’s biological microscopy segment by leveraging the expertise of Vutara and including super-resolution and single-molecule localization (SML) microscopy in Bruker’s product portfolio.
  • 158.
    158 MICROSCOPY MARKET –GLOBAL FORECAST TO 2021 © MarketsandMarkets Month & Year Approach Description July 2014 New Product Launch Bruker Corporation unveiled Inspire, its first integrated scanning probe microscopy (SPM) infrared system. This product is the integration of four technologies, namely, infrared scattering, scanning near-field optical microscope (sSNOM) optics, point-and-click alignment, and PeakForce Tapping. This launch helped the company strengthen its position in the emerging microscopy market. December 2013 New Product Launch Bruker Corporation introduced the Opterra Multipoint Scanning Confocal Microscope at the American Society for Cell Biology Annual Meeting. This microscope is used for the betterment of resolution and fast confocal imaging of live cell preparations. This launch strengthened the company’s product portfolio and provided flexible optical workstations to its end users. Source: Press Releases 11.2.4 MNM VIEW Bruker Corporation is among the leading companies in the microscopy market, owing to its broad product portfolio of atomic force and fluorescence microscopes and its strong geographic presence in North America, Europe, Latin America, Africa, Asia, and Australia. In order to sustain its market position, the company pursues the strategy of new product launches. The company generates a majority of its revenue from the European market, followed by the Asia-Pacific region and the U.S. Hence, international markets present significant growth opportunities for the company. In 2015, the company witnessed a 10.2% dip in its total revenue, as compared to that of 2014. This decline can be attributed to the fluctuating foreign currency rates and divestiture of the company’s former Chemical and Applied Markets (CAM) division. Similarly, the company witnessed a decline in research and development expenditure by 16.4% in 2015 compared to the previous year. This decrease was due to recent divestitures and restructuring actions.
  • 159.
    159 MICROSCOPY MARKET –GLOBAL FORECAST TO 2021 © MarketsandMarkets 11.3 LEICA MICROSYSTEMS GMBH 11.3.1 BUSINESS OVERVIEW Founded in 1969, with headquarters at Washington D.C., U.S., Danaher Corporation designs and manufactures medical, industrial, and commercial products and services. The company conducts its business through five segments, namely, Life Sciences and Diagnostics, Industrial Technologies, Environmental, Dental, and Test & Measurement. In 2005, Danaher Corporation acquired Leica Microsystems and its subsidiaries. Leica Microsystems is a provider of microscopy, camera, and software solutions for the imaging and analysis of macro, micro, and nanostructure. Leica Microsystems has its subsidiaries in the U.K., the U.S., Australia, China, and Singapore; six manufacturing facilities in five countries, with sales and services facilities in 20 countries. Leica Microsystems operates in three divisions, namely, Life Sciences, Industry, and Medical. FIGURE 55 DANAHER CORPORATION: COMPANY SNAPSHOT Source: Company Website, Annual Reports, and SEC Filings Founded: 1969 Headquarters: Washington, U.S. No. of Employees: ~81,000 Total Revenue: USD 20,563.1 Million R&D Expenditure: USD 1,239.1 Million Ownership: Public COMPANY AT A GLANCE - 2015 GEOGRAPHIC REVENUE MIX BUSINESS REVENUE MIX RECENT FINANCIALS 44.1% 9.7% 5.5% 40.7% U.S. China Germany Others 39.9% 17.7% 16.2% 13.3% 12.9% Life Sciences and Diagnostics Environmental Industrial Technologies Dental Test and Measurment 18,283.1 19,154.0 20,563.1 6.0% 6.0% 6.0% 2.5% 3.0% 3.5% 4.0% 4.5% 5.0% 5.5% 6.0% 6.5% 7.0% 17,000 17,500 18,000 18,500 19,000 19,500 20,000 20,500 21,000 2013 2014 2015 R&DExpenditure(%) TotalRevenue(USDMillion)
  • 160.
    160 MICROSCOPY MARKET –GLOBAL FORECAST TO 2021 © MarketsandMarkets 11.3.2 PRODUCTS OFFERED Category Product Super-resolution Microscopes  Leica SR GSD 3D  Leica TCS SP8 STED 3X Confocal Microscopes  Leica TCS SP8  Leica TCS SP8 X  Leica TCS SP8 DLS  Leica TCS SP8 STED 3X  Leica TCS SP8 CARS  Leica TCS SP8 SMD  Leica TCS SPE  Leica DCM8  Leica HyD  Leica HCS A  Leica SD AF Stereo Microscopes and Macroscopes  Macroscopes  Leica DMS300  Leica DMS1000  Leica DMS1000 B  Leica Z6 APO  Leica Z16 APO  Stereo Microscope - Research Manual  Leica M205 C  Leica M165 C  Leica M125  Leica S8 APO  Leica M80  Stereo Microscope - Fluorescence  Leica M205 FA  Leica M165 FC  Leica MZ10F  Leica EL6000  Stereo Microscope - Routine Manual Series  Leica M50  Leica M60  Leica M80  Leica A60 S  Leica A60 F  Leica EZ5  Leica S6  Leica S4 E  Leica S6 E  Leica S6 D  Stereo Microscope - Research Automated  Leica M205 A  Stereo Microscope - Education  Leica EZ4
  • 161.
    161 MICROSCOPY MARKET –GLOBAL FORECAST TO 2021 © MarketsandMarkets Category Product  Leica EZ4 HD  Leica S4 E  Leica S6 E  Leica ES2  Stereo Microscope - Illumination Series  Leica LED3000 RL  Leica LED5000 RL  Leica LED5000 CXI  Leica LED3000 NVI and Leica LED5000 NVI  Leica LED3000 BLI  Leica LED5000 HDI and Leica LED3000 DI  Leica LED3000 SLI, Leica LED5000 SLI  Leica LED3000 MCI, Leica LED5000 MCI  Stereo Microscopes - Ergonomics Light Microscopes  Leica DM4 B & DM6 B  Leica DMi8  Leica DM2500 & DM2500 LED  Leica SFL4000  Leica SFL100  Leica DM4 P, DM2700 P & DM750 P  Leica LMD6 & LMD7  iPad Leica DMshare  Leica DM6 FS  Leica DMD108  Leica DMi1  Leica DM IL LED  Leica DM1000 LED  Leica DMi8  Leica DM2700 M  Leica DM1750 M  Leica DM8000 M  Leica DM12000 M  Leica SD AF  Leica Micromanipulator  Leica Multiviews  Leitz Optilux  Leica DM750 M  Leica DM ILM  LAS X Widefield Systems  Leica DM3000 & DM3000 LED  Leica FS CB  Leica Telatom Digital Microscopes  Leica DVM6  Leica DMS300  Leica DMS1000
  • 162.
    162 MICROSCOPY MARKET –GLOBAL FORECAST TO 2021 © MarketsandMarkets Category Product  Leica DMS1000 B  Leica DCM8 Microscope Cameras  Microscope Camera Series for Education  Microscope Camera Series for Life Science  Microscope Camera Series for Industry  Microscope Camera Series for Fluorescence Microscope Software  Software for Life Science Research  Software for Education  Software for Materials Sciences 11.3.3 RECENT DEVELOPMENTS Month & Year Approach Description October 2015 New Product Launch Leica Microsystems introduced DMi8, an inverted research microscope platform. The product offers observation through an external monitor, remote operation and monitoring, high- throughput, and complex screening. Leica DMi8 can be configured without the optical components associated with the optical path. July 2015 New Product Launch Leica Microsystems launched Leica DM4 B and Leica DM6 B, a series of upright research microscopes. The series has wide applications in life sciences research, laser microdissection, neurosciences and evolutionary biology, materials science, and materials analysis. April 2015 New Product Launch Leica Microsystems launched the Leica DVM6 digital microscope. Leica DVM6 offers integrated illumination options and PlanApo-corrected optics, which ensure high-quality images. The product has wide applications in inspection, analysis, and measurement in quality control, quality assurance, failure analysis, research and development, and forensics. March 2015 New Product Launch Leica Microsystems introduced Leica EM Cryo CLEM, a system that facilitates correlative light and electron microscopy (CLEM). CLEM enables sample study under a fluorescence light microscope and electron microscope, and enables rapid screening of large areas and fast determination of regions of interest. The Leica EM Cryo CLEM system comprises a fluorescence light microscope with cryo stage, cryo objective, and a cyro transfer shuttle. October 2014 New Product Launch Leica Microsystems introduced the Leica M530 OH6 Neurosurgical Microscope. This microscope is armed with technologies such as advanced small angle illumination (SAI), FusionOptics, and apochromatic optics. September 2014 Collaboration Leica Microsystems collaborated with the Yale University (U.S.) to establish a new Microscopy Center of Excellence at the Yale University’s campus. This collaboration strengthened the company’s market presence in the U.S.
  • 163.
    163 MICROSCOPY MARKET –GLOBAL FORECAST TO 2021 © MarketsandMarkets Month & Year Approach Description September 2014 New Product Launch Leica Microsystems introduced the Leica Application Suite X (LAS X) imaging software in the life sciences segment for all widefield, confocal, and super-resolution microscopes. This software is equipped with a basic version known as LAS X Core. This launch has strengthened the company’s microscope software portfolio. September 2014 New Product Launch Leica Microsystems introduced Leica M844 and Leica M822 ophthalmology microscopes with TrueVision 3D visualization, recording, and editing technologies. These microscopes help surgeons and researchers in anterior and posterior surgical techniques. September 2014 New Product Launch Leica Microsystems launched the Leica DMi8 inverted microscope. The microscope is equipped with additional features such as incident illumination port, infinity port, and laser systems. This advanced product launch has helped the company strengthen its portfolio of inverted research microscopes. July 2014 New Product Launch Leica Microsystems launched the new Leica LMD software V7.5.1. The software is equipped with features such as extended toolbox for shape definition, improved AVC software, remote navigation, and extension of time lapse. This advanced product launch helped the company strengthen its portfolio of software solutions. Source: Press Releases 11.3.4 MNM VIEW Leica Microsystems is a pioneer in the microscopy market. Geographically, the company operates in over 20 countries, including the U.S., the U.K., Australia, China, and Singapore. The company offers a strong product portfolio, which includes microscopes, cameras, and software solutions for the imaging and analysis of macro, micro, and nanostructures. The company maintains its strong position in the competitive environment through innovative product launches such as super-resolution microscopes, confocal microscopes, and light microscopes. The company mainly focuses on its super-resolution product line to strengthen its position in the microscopy market. The company is also fortifying its position in the microscopy market by collaborating with universities and entering into agreement with key companies such as TrueVision 3D Surgical (U.S.).
  • 164.
    164 MICROSCOPY MARKET –GLOBAL FORECAST TO 2021 © MarketsandMarkets 11.4 CARL ZEISS AG 11.4.1 BUSINESS OVERVIEW Founded in 1846, with headquarters at Oberkochen, Germany, Carl Zeiss AG operates in the fields of optics and optoelectronics. The company’s operating segments include research and quality technology, medical technology, vision care /consumer optics, semiconductor manufacturing technology, and others. The Microscopy division develops and distributes microscope systems for biomedical research and materials inspection. Geographically, the company operates in Europe, the Americas, and Asia, and its subsidiaries are located across the globe. Carl Zeiss Meditec AG (Germany) is a subsidiary engaged in the development, production, and marketing of diagnostic devices, intraocular lenses, and consumables for eye surgery. Major products offered by the company include surgical microscopes, diagnostic systems, laser surgery equipment, and intraocular lenses. FIGURE 56 CARL ZEISS AG: COMPANY SNAPSHOT Source: Company Website Annual Reports Founded: 1846 Headquarters: Oberkochen, Germany No. of Employees: 24,946 Total Revenue: USD 4,975.8 Million R&D Expenditure: USD 514.0 Million Ownership: Public COMPANY AT A GLANCE - 2015 GEOGRAPHIC REVENUE MIX BUSINESS REVENUE MIX RECENT FINANCIALS 34.4% 26.9% 21.1% 17.5% EMEA Americas APAC Cooperation Partners 30.1% 26.8% 22.3% 19.8% 1.0% Research and Quality Technology Medical Technology Vision Care/Consumer Optics Semiconductor Manufacturing Technology Others 4,621.7 4,728.7 4,975.8 9.9% 10.5% 10.3% 9.5% 9.6% 9.7% 9.8% 9.9% 10.0% 10.1% 10.2% 10.3% 10.4% 10.5% 4,400 4,500 4,600 4,700 4,800 4,900 5,000 5,100 2013 2014 2015 R&DExpenditure(%) TotalRevenue(USDMillion)
  • 165.
    165 MICROSCOPY MARKET –GLOBAL FORECAST TO 2021 © MarketsandMarkets 11.4.2 PRODUCTS OFFERED Category Product Light Microscopes  Upright and Inverted Microscopes  Axio Imager, Observer, Examiner  Axio Scope.A1  Axio Vert.A1  Axio Lab.A1  Primovert  Primo Star  Primo Star iLed  Primotech  Stereo & Zoom Microscopes  Smartzoom 5  Axio Zoom.V16  SteREO Discovery.V20, V12, V8  Stemi 2000, Stemi DV4  Accessories  Digital Microscope  Axio Scan.Z1  O-Select  Smartproof 5  Smartzoom 5  Light Sheet Fluorescence Microscopes  Lightsheet Z.1  Apotome.2  NMI System Confocal Microscopes  Laser Scanning Microscopes  LSM 800  LSM 880  Smartproof 5  Super-resolution Microscopes  ELYRA  Cell Observer SD Electron Microscopes  SEM  GeminiSEM  Sigma Family  MultiSEM 505/506  MERLIN  EVO  Mineralogic Systems  Pre-owned Instruments  ParticleSCAN VP  Focused Ion Beam-SEM  Crossbeam 340 and Crossbeam 540
  • 166.
    166 MICROSCOPY MARKET –GLOBAL FORECAST TO 2021 © MarketsandMarkets Category Product  Multiple Ion Beam Microscopes  ORION NanoFab X-ray Microscopy  ZIESS Xradia Versa Series  ZIESS Xradia Ultra Series  ZIESS Xradia Synchrotron X-ray Imaging Software  ZEN Series  AxioVision Series  SmartSEM  Atlas & Atlas 3D  3DSM  PALM RoboSoftware  Light Lab  Labscope  Matscope Cameras  AxioCam Series Accessories  Filter sets & Fluorescent Dyes  Microbeam Accessories  Micromanipulation  Light Sources  Incubation  Objectives  Multi-discussion System 11.4.3 RECENT DEVELOPMENTS Month & Year Approach Description May 2016 Product Enhancement Carl Zeiss introduced ZEISS LSM 880 with airyscan detector for confocal laser scanning microscopes. This upgradation enables improved signal- to-noise ratio and a four-fold increase in imaging speed, sensitivity, and 1.5x resolution improvement. This product enhancement has helped the company to enhance confocal super resolution imaging for live cell imaging. April 2016 New Product Launch Carl Zeiss launched ZEISS LSM 880, a confocal laser scanning microscope for material science and failure analysis. The product comprises confocal fluorescence and other contrasting techniques that enables high-precision examination of nanomaterials, metals, polymers, and semiconductors with maximum information content. The product also offers precise capture of 3D topography and investigation of nanometer-scaled structures. This launch will help the company strengthen its portfolio of confocal laser scanning microscopes. January 2016 New Product Launch Carl Zeiss launched Smartproof 5, a widefield confocal microscope for industrial applications in quality assurance and quality control departments, production environments, and research and development labs. The microscope offers 3D reconstructions and roughness measurements for a wide range of work piece surfaces.
  • 167.
    167 MICROSCOPY MARKET –GLOBAL FORECAST TO 2021 © MarketsandMarkets Month & Year Approach Description January 2016 Product Enhancement Carl Zeiss introduced EISS Xradia Versa with FPX, an extension for the ZEISS Xradia Versa 500 series of 3D X-ray microscopes. ZEISS FPX enhances image quality and improves workflow, which is useful in industrial development and academic research to examine large samples. June 2015 Partnership Carl Zeiss entered into a public-private partnership with University of California, Berkeley (U.S.) as part of the Brain Microscopy Innovation Center (BrainMIC), Berkeley BRAIN Initiative. Under this partnership, Carl Zeiss will offer the latest updates of the equipment and, in turn, UC Berkeley researchers will provide feedback on any new or special neurotechnology needs to help Carl Zeiss produce future products best suited for the newest advances in neuroscience research endeavors. April 2015 New Product Launch ZEISS introduced ZEISS GeminiSEM and ZEISS Sigma, two product lines of field emission scanning electron microscopes (FE-SEMs) with enhanced Gemini technology. The ZEISS GeminiSEM family provides high-contrast and low-voltage images from any sample; while the ZEISS Sigma microscopes offer high-quality imaging and advanced analytical microscopy. Both products find applications in research, industrial labs, and imaging facilities. January 2015 New Product Launch ZEISS introduced LSM 800, a new compact confocal laser scanning microscope for high-end confocal imaging. ZEISS LSM 800 provides high- image quality and offers enhanced productivity and throughput as well as greater flexibility in live cell imaging. December 2014 New Product Launch ZEISS launched ZEISS Stemi 305 and ZEISS Stemi 508, two new compact Greenough stereo microscopes for education, lab routine, and industrial inspection. The products offers images in true color, 3D, with high contrast, and free of distortion or color fringes. November 2014 New Product Launch ZEISS introduced MultiSEM 505, a new scanning electron microscope (SEM) featured with 61 beams working in parallel. ZEISS MultiSEM 505 is designed for frequent operation and is fitted with the intuitive ZEN Software. October 2014 Collaboration Carl Zeiss collaborated with the University of California, Berkeley, to support the BRAIN Initiative organized by the Berkeley Brain Microscopy Innovation Center (BrainMIC) and supported by the National Institutes of Health (NIH). This initiative aimed to develop the company’s microscopy business by using emerging neurotechnologies. Source: Press Releases
  • 168.
    168 MICROSCOPY MARKET –GLOBAL FORECAST TO 2021 © MarketsandMarkets 11.4.4 MNM VIEW Carl Zeiss maintained its leadership in the microscopy market through its strong distribution network and business operations in Europe, the Americas, Asia, and other geographies. The company focuses on strengthening its position in the market by adopting strategies such as new product launches, collaborations, and alliances. In this regard, in October 2014, the company collaborated with the University of California, Berkeley, to support the BRAIN Initiative organized by the Berkeley Brain Microscopy Innovation Center (BrainMIC) and supported by the National Institutes of Health (NIH). Company focuses on introducing innovative products such as super-resolution microscopy in the market. The company also focuses on aftersales services to ensure customer satisfaction and strengthen its position in the market. In 2015, the company witnessed an increase of 5.2% in its revenue, as compared to that of 2014. The revenue increase was primarily due to a healthy trend in the company’s business and positive currency effects.
  • 169.
    169 MICROSCOPY MARKET –GLOBAL FORECAST TO 2021 © MarketsandMarkets 11.5 NIKON CORPORATION 11.5.1 BUSINESS OVERVIEW Founded in 1917, with headquarters at Tokyo, Japan, Nikon Corporation is a leading manufacturer and supplier of optical instruments. The company operates through four business segments—Imaging Products, Precision Equipment, Instruments, and Others. The Others segment comprises sport optics, space-related equipment, glass, lasers, encoders, and ophthalmic lens businesses. The company offers its microscopy products through the Instruments business segment. Geographically, the company operates in the U.S., Japan, Europe, and China. It has 59 subsidiaries, of which 19 are domestic and 40 are overseas. FIGURE 57 NIKON CORPORATION: COMPANY SNAPSHOT Source: Company Website and Annual Reports Founded: 1917 Headquarters: Tokyo, Japan No. of Employees: 25,415 Revenue: USD 7,138.1 Million R&D Expenditure: USD 555.3 Million Ownership: Public COMPANY AT A GLANCE - 2015 GEOGRAPHIC REVENUE MIX BUSINESS REVENUE MIX RECENT FINANCIALS 24.7% 23.4% 14.3% 14.1% 23.5% Europe U.S. Japan China Others 68.3% 19.9% 8.5% 3.3% Imaging Products Business Precision Equipment Business Instruments Business Others 10,744.2 9,527.4 7,138.1 7.6% 7.6% 7.8% 7.2% 7.3% 7.4% 7.5% 7.6% 7.7% 7.8% 7.9% 0 2,000 4,000 6,000 8,000 10,000 12,000 2013 2014 2015 R&DExpenditure(%) TotalRevenue(USDMillion)
  • 170.
    170 MICROSCOPY MARKET –GLOBAL FORECAST TO 2021 © MarketsandMarkets 11.5.2 PRODUCTS OFFERED Category Product Super-resolution Microscopes  N-SIM  N-SIM E  N-STORM Confocal Microscopes  Singlephoton Confocal Microscopes  Multiphoton Confocal Microscopes  Macro Confocal Microscope System Inverted Microscopes  ECLIPSE Ti  ECLIPSE Ts2R  ECLIPSE Ts2  ECLIPSE TS100/100F  Ti-LAPP Modular Illumination System  White-light TIRF System  NT88-V3 Micromanipulator Systems for IVF Upright Microscopes  ECLIPSE Ni-E/Ni-U  Fixed-stage Microscope ECLIPSE FN1  ECLIPSE Ci-E/Ci-L/Ci-S  ECLIPSE E200  ECLIPSE E100  ECLIPSE LV100ND POL/DS Polarizing Microscopes  Eclipse LV100N POL  Eclipse Ci-POL  Eclipse E200 POL Multi-purpose Zoom Microscopes  MULTIZOOM AZ100  MULTIZOOM AZ100 M Integrated Cell Culture Observation System  BioStation CT Digital Microscope  ShuttlePix Stereoscopic Microscopes  Research Stereo Microscope SMZ25/SMZ18  Stereo Microscope SMZ1270/1270i  Stereo Microscope SMZ800N  Stereo Microscope SMZ745/745T  Stereo Microscopes Accessories Industrial Microscopes  Upright Microscope  Inverted Microscope  Others
  • 171.
    171 MICROSCOPY MARKET –GLOBAL FORECAST TO 2021 © MarketsandMarkets 11.5.3 RECENT DEVELOPMENTS Month & Year Approach Description November 2015 New Product Launch Nikon Corporation launched ECLIPSE Ts2R, a compact inverted research microscope with ease of use and wide variety of observation methods for medical and biological research fields. This launch helped the company enhance its brand image and strengthen its market presence. November 2015 Product Enhancement Nikon Corporation introduced an inverted routine microscope— ECLIPSE Ts2. The product is an advanced version of ECLIPSE TS100, with new features such as emboss contrast, LED illuminator, and with improved workflow. With this launch, the company strengthened its microscopy product portfolio. October 2015 New Software Launch Nikon Corporation launched the high-resolution confocal imaging software, NIS-Elements C-ER, which provides high- resolution confocal images. This software launch helped the company strengthen its software portfolio. March 2015 Product Enhancement Nikon Corporation unveiled the super-resolution microscope N- STORM 4.0. The N-STORM 4.0 is an enhanced version of the super-resolution microscope N-STORM released in 2010. The new enhanced product offers features such as dynamic super- resolution imaging at the nanoscale level and improvement of image quality. This product enhancement helped the company cater to unmet market needs. May 2014 New Product Launch Nikon Corporation launched the DS-Ri2 Microscope Camera and DS-Qi2 Monochrome Microscope Camera. These products are equipped with Nikon’s FX-format CMOS sensor. April 2014 New Product Launch Nikon Corporation expanded its portfolio of stereo microscopes by introducing the SMZ1270, SMZ1270i, and SMZ800N. Of these, the SMZ1270 and SMZ1270i are equipped with new WF series objectives and offer highest-in-class zoom ratio. This launch helped the company strengthen its market share. November 2013 New Product Launch Nikon Corporation launched the new Ti-LAPP laser application system. This system features various combinations of multiple epi-fluorescence modules, with high flexibility, high expandability, an auto-alignment function to simplify TIRF observations, and a DMD module that offers a variety of photo stimulation patterns. May 2013 New Product Launch Nikon Corporation launched two research stereo microscopes, the SMZ25 motorized epi-fluorescence set and the SMZ18 episcopic plain stand set. These products are equipped with large zoom range and enhanced epi-fluorescence imaging. Source: Press Releases
  • 172.
    172 MICROSCOPY MARKET –GLOBAL FORECAST TO 2021 © MarketsandMarkets 11.5.4 MNM VIEW Nikon Corporation is among the world’s leading providers of optical instruments. The company has created a strong business platform that enables it to harness opportunities for continued success despite the economic crisis. The company offers a comprehensive range of microscopes to healthcare professionals globally. Significant investment made by the company have enabled it to expand its international presence by improving IT systems. The company pursues the strategy of new product launches in order to grow its share in the microscopy market. In 2015, the company witnessed a 25.1% decline in its revenue as compare to a decline of 11.3% in 2014. These declines were due to a decrease in the number of units sold in the precision equipment business and delayed recoveries in the European and Chinese markets in the company’s imaging products business. However, the company witnessed positive growth in its research and development expenditure by 23.3% in 2015 as compare to that of the previous year. This shows the company’s continuous involvement in research and development activities to strengthen the Nikon brand, and its efforts to tap unmet market demand.
  • 173.
    173 MICROSCOPY MARKET –GLOBAL FORECAST TO 2021 © MarketsandMarkets 11.6 FEI CO. 11.6.1 BUSINESS OVERVIEW Founded in 1971, with headquarters in Oregon, U.S., FEI Co. mainly focuses on designing, manufacturing, and supplying products based on focused charged-particle beam technology. The company offers ion beam workstations, transmission electron microscopes, and SEM. The company has segmented its business into two subgroups—industry group and science group. The Life Sciences segment caters to the microscopy business. Geographically, the company operates in North America, Europe, Asia-Pacific, and the RoW. In 2015, its employee headcount was 3,060. FIGURE 58 FEI CO.: COMPANY SNAPSHOT Source: Company Website, Annual Reports, and SEC Filings Founded: 1971 Headquarters: Oregon, U.S. No. of Employees: 3,060 Revenue: USD 930.1 Million R&D Expenditure: USD 95.5 Million Ownership: Public COMPANY AT A GLANCE - 2015 GEOGRAPHIC REVENUE MIX BUSINESS REVENUE MIX RECENT FINANCIALS 32.0% 26.5% 41.4% U.S. and Canada Europe APAC and RoW 48.0% 52.0% Industry Group Science Gruop 927.4 956.2 930.1 11.0% 10.7% 10.3% 9.8% 10.0% 10.2% 10.4% 10.6% 10.8% 11.0% 11.2% 910 915 920 925 930 935 940 945 950 955 960 2013 2014 2015 R&DExpenditure(%) TotalRevenue(USDMillion)
  • 174.
    174 MICROSCOPY MARKET –GLOBAL FORECAST TO 2021 © MarketsandMarkets 11.6.2 PRODUCTS OFFERED Category Product Scanning Electron Microscope (SEM)  Quanta SEM  Teneo Family  Verios  Nova NanoSEM  Inspect Family  MLA  QEMSCAN  Aspex Product Group Transmission Electron Microscope (TEM)  Titan  Talos  Tecnai  Metrios DualBeam (FIB/SEM)  Helios NanoLab  Scios  Versa 3D  ExSolve Focused Ion Beam (FIB) System  Vion Plasma Focused Ion Beam  V400ACE Focused Ion Beam  OptiFIB Software  Amira  Argos  EPU  Inspect 3D  Tomography  Auto Slice & View  MAPS  Avizo Accessories  For SEM  For TEM  For Dual Beam
  • 175.
    175 MICROSCOPY MARKET –GLOBAL FORECAST TO 2021 © MarketsandMarkets 11.6.3 RECENT DEVELOPMENTS Month & Year Approach Description May 2016 New Product Launch FEI introduced Apreo, a scanning electron microscope (SEM). The product utilizes the proprietary compound final lens design that allows improvement in resolution and backscatter detection at the lowest beam current. March 2016 Partnership FEI Co. and NovAliX (France), a contract research organization, entered into a partnership to provide cryo-electron microscopy- based structural biology services for the pharmaceutical and biotech industry. The partnership combines application, training, and support with on-site personnel from FEI. September 2014 Expansion FEI Co. established a new technology center in the Czech Republic, for which the company invested CZK 800 million (approximately USD 38 million). This new setup is intended to employ about 600 people and produce approximately 60% of FEI’s electron microscopes. This will help the company expand its market in the European region. September 2014 New Product Launch FEI introduced the Helios NanoLab G3 DualBeam, a combination of electron and ion optics microscopy, which comes in two different workflow-specific configurations for material science research. This product expanded FEI’s transmission electron microscope (TEM) portfolio. September 2014 New Product Launch FEI Co. unveiled the new Teneo VolumeScope (VS) scanning electron microscope (SEM), a fully integrated 3D volume imaging solution. This product is equipped with VolumeScope, an in-chamber microtome and proprietary analytical software. July 2014 New Product Launch FEI Co. launched two new products, namely, the Helios plasma focused ion beam (PFIB) DualBeam and Teneo scanning electron microscope (SEM). These products provide faster analyses in metal research. July 2014 New Product Launch FEI Co. launched a new phase plate solution and the Titan Halo™ transmission electron microscope (TEM). These two products are based on cryo-electron microscopy applications, and enable the analysis of 3D structure of molecules and molecular complexes. June 2014 Collaboration FEI Co. collaborated with the metal labs at The University of Manchester's Electron Microscopy Centre in the School of Materials. This collaboration is aimed for steel and non-ferrous alloy research. February 2014 Acquisition FEI Co. acquired Lithicon AS (Australia). This acquisition was conducted to access Lithicon’s expertise in digital rock technology services and core imaging and analysis. October 2013 New Product Launch FEI Co. introduced the Tecnai Femto ultrafast electron microscope (UEM). This helped the company to become one of the innovative companies in the microscopy market. Source: Press Releases
  • 176.
    176 MICROSCOPY MARKET –GLOBAL FORECAST TO 2021 © MarketsandMarkets 11.6.4 MNM VIEW FEI Co. is one of the key companies in the electron microscopy market. The company has a broad product portfolio of SEM, transmission electron microscopes, and DualBeam (FIB/SEM) and Focused Ion Beam (FIB) systems. The company aims to increase its visibility in the microscopy market by launching several new products. For instance, in May 2016, the company launched Apreo, a scanning electron microscope (SEM). The product utilizes the proprietary compound final lens design that offers improvement in resolution and backscatter detection at the lowest beam current. This launch will strengthen the company’s microscopy product catalogue. The company also focuses on expansions and acquisitions to mark its presence in emerging markets. Emerging markets present significant growth opportunities for the company, as developed markets are gradually getting saturated. In this regard, in September 2014, the company established a new technology center in the Czech Republic. In 2015, the company recorded a decline of 2.7% in its revenue. This decline was due to a drop in sales of the company’s largest business segment—Science Group.
  • 177.
    177 MICROSCOPY MARKET –GLOBAL FORECAST TO 2021 © MarketsandMarkets 11.7 OLYMPUS CORPORATION 11.7.1 BUSINESS OVERVIEW Incorporated in 1919, with headquarters in Tokyo, Japan, Olympus Corporation is a leading player in the global microscopy market. The company primarily operates in four business segments—Medical, Scientific Solution, Imaging, and Others (including information technology and industrial systems). The Scientific Solution segment deals with biological/industrial microscopes, industrial endoscopes, printers, and non- destructive test equipment. The company has widespread presence across the globe, spanning the Americas, Africa, Western/Eastern Europe, the Middle East, Asia, and Oceania. FIGURE 59 OLYMPUS CORPORATION: COMPANY SNAPSHOT *Note: The total of the business revenue mix is more than 100% due to eliminations. Source: Company Website and Annual Reports Founded: 1919 Headquarters: Tokyo, Japan No. of Employees: 31,540 Revenue: USD 7,233.0 Million R&D Expenditure: USD 700.9 Million Ownership: Public COMPANY AT A GLANCE - 2015 GEOGRAPHIC REVENUE MIX BUSINESS REVENUE MIX RECENT FINANCIALS 21.1% 32.7% 25.5% 18.2% 2.5% Japan North America Europe Asia Other Foreign Countries 70.5% 16.5% 10.6% 2.4% Medical Business Scientific Solution Bussiness Imaging Business Other/Corporate 7,036.1 6,746.9 7,233.0 8.5% 9.4% 9.7% 7.8% 8.0% 8.2% 8.4% 8.6% 8.8% 9.0% 9.2% 9.4% 9.6% 9.8% 6,500 6,600 6,700 6,800 6,900 7,000 7,100 7,200 7,300 2013 2014 2015 R&DExpenditure(%) TotalRevenue(USDMillion)
  • 178.
    178 MICROSCOPY MARKET –GLOBAL FORECAST TO 2021 © MarketsandMarkets 11.7.2 PRODUCTS OFFERED Category Product Inverted Microscopes  IX83  IX73  IX53  FSX100  CKX53  ICSI/IMSI Platform Stereo Microscopes  SZX16  SZX10  SZX7  SZ61/SZ51 Disk Confocal Microscope  DSU Upright Microscopes  BX63  BX53  BX43  BX46  CX41  CX31  CX23  BX61WI/BX51WI  BX53-P  CX31-P Research Macro Zoom Microscope  MVX10 Virtual Slide Microscope  VS120 11.7.3 RECENT DEVELOPMENTS Month & Year Approach Description April 2016 Product Enhancement Olympus Corporation launched FLUOVIEW FV3000 and FV3000RS confocal laser scanning microscope series, an enhancement of the FV1200 series. The updated versions include features such as high speed, high-resolution, three-dimensional images, and high sensitivity that capture light even from dim samples. The series also offers high-resolution images for fast, accurate imaging of biological samples. This launch has strengthened the company’s portfolio of confocal laser scanning microscopes. January 2016 Product Enhancement Olympus Corporation unveiled the BX53M/BXFM system microscope. This product is an enhanced version of BXiS with additional and improved features such as aperture adjustment and switching between different observation methods.
  • 179.
    179 MICROSCOPY MARKET –GLOBAL FORECAST TO 2021 © MarketsandMarkets Month & Year Approach Description January 2016 New Software Launch Olympus Corporation launched the OLYMPUS Stream V2.1 software. The new software features the instant multiple image alignment (MIA) function for building composite panorama images. January 2016 New Product Launch Olympus Corporation launched new units for SZX series of stereo microscopes; SZX2-LTTR ergonomic long tilting trinocular and SZX2-EEPA extendable eye point adjuster. November 2015 Product Enhancement Olympus Corporation unveiled the CKX53 culture microscope, an enhanced version of CKX41 and CKX31. The product features a new phase contrast system and LED light source, which delivers clearer images and faster startup. April 2015 Product Enhancement Olympus Corporation introduced the biological microscope CX23, an enhanced version of CX22LED. The microscope is easy to use and thus facilitates the use of these microscopes in educational training at various universities and teaching laboratories. March 2015 New Product Launch Olympus Corporation launched the DSX Series of digital microscopes, comprising DSX510, DSX510i, and DSX110. October 2014 New Product Launch Olympus Corporation launched the STM7 Measuring Microscope. This product can be used for the efficient shape measurement of machine parts, semiconductors, electronic components, and other parts in industrial processes. This product launch helped the company offer an innovative technology to its customer base. However, this product is not available in the European market. October 2014 New Product Launch Olympus Corporation launched the DP27 and DP22 standalone microscope digital cameras. These products can be used with both biological and industrial microscopes. This product launch helped the company further expand its product portfolio. Source: Press Releases
  • 180.
    180 MICROSCOPY MARKET –GLOBAL FORECAST TO 2021 © MarketsandMarkets 11.8 ASYLUM RESEARCH (OXFORD INSTRUMENTS) 11.8.1 BUSINESS OVERVIEW Asylum Research, with headquarters in California, U.S., was established in 1999. Asylum Research is a subsidiary of Oxford Instruments. The company provides instrumentation for nanoscience and nanotechnology applications, and offers scanning probe and AFM for materials and bioscience applications. The company operates in 17 countries worldwide, including the U.S., Canada, and Israel; and has subsidiaries in the U.K., Germany, and Taiwan. In December 2012, Asylum Research was acquired by Oxford Instruments (U.K.), a provider of high- technology tools and systems. As of 2015, the company had a headcount of 2,420 employees. FIGURE 60 OXFORD INSTRUMENTS: COMPANY SNAPSHOT *Note: All the financials mentioned in the company snapshot is for parent company Oxford Instruments Source: Company Website, Annual Reports, and SEC Filings Founded: 1999 Headquarters: California, U.S. No. of Employees: 2,420 Revenue: USD 510.6 Million R&D Expenditure: USD 30.8 Million Ownership: Public COMPANY AT A GLANCE - 2015 GEOGRAPHIC REVENUE MIX BUSINESS REVENUE MIX RECENT FINANCIALS 32.8% 14.4% 9.6% 8.2% 6.7% 13.3% 11.5% 3.5% U.S. China U.K. Japan Germany 54.6%27.7% 17.7% Nanotechnology Tools Industrial Products Services 464.7 477.0 510.6 6.9% 7.0% 8.0% 6.2% 6.4% 6.6% 6.8% 7.0% 7.2% 7.4% 7.6% 7.8% 8.0% 8.2% 440 450 460 470 480 490 500 510 520 2013 2014 2015 R&DExpenditure(%) TotalRevenue(USDMillion)
  • 181.
    181 MICROSCOPY MARKET –GLOBAL FORECAST TO 2021 © MarketsandMarkets 11.8.2 PRODUCTS OFFERED Category Product Atomic Force Microscopy (AFM)  Cypher ES Environmental AFM  Cypher S  MFP-3D Infinity  MFP-3D Origin  MFP-3D BIO  MFP-3D Classic Accessories  Cypher Options and Accessories Summary  MFP-3D Options and Accessories Summary 11.8.3 RECENT DEVELOPMENTS Month & Year Approach Description September 2015 New Product Launch Asylum Research launched Cypher ES Polymer Edition, an atomic force microscope optimized for polymer research. The product offers highest resolution, fast scanning, heating, and the most comprehensive suite of nanomechanical characterization tools. Cypher ES polymer is useful for polymer and material science applications. August 2014 New Product Launch Asylum Research launched AM-FM Viscoelastic Mapping Mode, a new nanomechanical imaging technique. This technique is a combination of quantitative abilities of normal tapping mode (AM) with a high-sensitivity frequency modulation mode (FM). This launch strengthened the company’s NanomechPro toolkit product line. July 2014 Expansion Asylum Research opened its first Nanotechnology Lab for Atomic Force Microscopy (AFM) in India. This lab is equipped with MFP-3D Classic and the MFP-3D Origin technology, which adds to the range of industrial analysis tools available for demonstration. This expansion helped the company strengthen its presence in the Asia- Pacific region. April 2014 New Product Launch Asylum Research introduced its new MFP-3D Infinity atomic force microscope (AFM) with new nanomechanical measurement capabilities. This launch benefited the company in the expansion of the MFP-3D AFM portfolio. January 2014 New Product Launch Asylum Research unveiled the new atomic force microscope technique, namely, Scanning Microwave Impedance Microscopy (sMIM). This new AFM technique enables nanoscale mapping of permittivity and conductivity with unprecedented sensitivity and resolution on any material, including conductors, semiconductors, and insulators. This launch strengthened the company’s MFP-3D and Cypher AFMs portfolio and provided it a competitive edge in the market. November 2013 New Product Launch Asylum Research introduced blueDrive Photothermal Excitation, a technology for the Asylum’s Cypher AFM (AFMs) family. This technology is simple, stable, and enables accurate tapping mode
  • 182.
    182 MICROSCOPY MARKET –GLOBAL FORECAST TO 2021 © MarketsandMarkets Month & Year Approach Description imaging. This launch extended the company’s product portfolio in the microscopy market. September 2013 New Product Launch Asylum Research introduced the Contact Resonance Viscoelastic Mapping Mode technique. This new technique enables high- resolution, quantitative imaging, particularly suited for characterizing moderate-to-high modulus materials. This launch helped the company to augment its current product offerings in NanomechPro Toolkit. August 2013 New Product Launch Asylum Research unveiled the new GetReal Automated Probe Calibration feature for atomic force microscopes (AFM). This technology provides consistent and accurate results, and has strengthened the company’s position in the microscopy market. May 2013 New Product Launch Asylum Research launched the new MFP-3D Origin atomic force microscope (AFM). The technology has superior performance and is affordable as compared to the existing technologies in the AFM portfolio. This new launch will help the company extend its range of AFMs and strengthen its position in this market. Source: Press Releases
  • 183.
    183 MICROSCOPY MARKET –GLOBAL FORECAST TO 2021 © MarketsandMarkets 11.9 DANISH MICRO ENGINEERING 11.9.1 BUSINESS OVERVIEW Established in 1979, with headquarters in Copenhagen, Denmark, Danish Micro Engineering (DME) is a major developer and manufacturer of AFM. The company has expertise in scanning probe microbes technology. The company’s product series, Rasterscope and DualScope, are its main business segments. As of 2015, the company had a headcount of seven employees and generated a revenue of USD 1.5 million. Danish Micro Engineering is a privately held company and no financial information is available in the public domain. Hence, financial details have not been provided in this section. 11.9.2 PRODUCTS OFFERED Category Product Atomic Force Microscopy (AFM) Systems  DS 95 Scanner  DS 95 AFM System  Compact Granite  ProberStation 150  Navigator 220  Igloo  AFM Objective for Optical Microscope  BRR-SEM-AFM Integration Ultra-high Vacuum (UHV) and Special Constructions  SPM for Ultra High Vacuum  UHV Scanning Tunnelling Microscope (STM)  STM for Electrochemical measurements  DX STM0 Head to Head STM  UHV Tip Enhanced Raman Spectroscopy System  Scanning Nearfield Optical Microscopy (SNOMs)  Controlled Atmosphere High Temperature (CAHT) AFM Software  DME ScanTool 11.9.3 RECENT DEVELOPMENTS No significant developments have been reported by the company in the microscopy segment between 2012 and 2016.
  • 184.
    184 MICROSCOPY MARKET –GLOBAL FORECAST TO 2021 © MarketsandMarkets 11.10 JEOL LTD. 11.10.1 BUSINESS OVERVIEW Founded in 1949, with headquarters in Tokyo, Japan, JEOL Ltd. manufactures and markets scientific instruments (electron optical instruments and analytical instruments) and measuring instruments; semiconductor, industrial, and medical equipment; and processing & maintenance services for related products and accessories. The company has three business segments—Scientific and Measurement Instruments, Industrial Equipment, and Medical Equipment. The Scientific and Measurement Instruments segment caters to the company’s microscopy business. JEOL offers products in more than 30 countries across North America, Europe, Australia, and Asia; and operates through six subsidiaries in Germany, the Netherlands, and Sweden. FIGURE 61 JEOL LTD.: COMPANY SNAPSHOT Source: Company Website and Annual Reports Founded: 1949 Headquarters: Tokyo, Japan No. of Employees: 2,952 Revenue: USD 902.2 Million R&D Expenditure: USD 52.2 Million Ownership: Public COMPANY AT A GLANCE - 2015 BUSINESS REVENUE MIX RECENT FINANCIALS 72.6% 19.6% 7.8% Scientific and Measurement Instruments Medical Equipment Industrial Equipment 753.2 939.6 902.2 5.4% 4.5% 5.8% 0.0% 1.0% 2.0% 3.0% 4.0% 5.0% 6.0% 7.0% 0 100 200 300 400 500 600 700 800 900 1,000 2013 2014 2015 R&DExpenditure(%) TotalRevenue(USDMillion)
  • 185.
    185 MICROSCOPY MARKET –GLOBAL FORECAST TO 2021 © MarketsandMarkets 11.10.2 PRODUCTS OFFERED Category Product Transmission Electron Microscopes (TEMs)  JEM-1000 Ultra-high Voltage Electron Microscope  JEM-3200FS Field Emission Energy Filter Electron Microscope  JEM-ARM200F Atomic Resolution Analytical Electron Microscope  JEM-ARM300F GRAND ARM Atomic Resolution Electron Microscope  JEM-2200FS Field Emission Electron Microscope  JEM-F200 Multi-purpose Electron Microscope  JEM-2100F Field Emission Electron Microscope  JEM-2100 Plus Electron Microscope  JEM-2800 High Throughput Electron Microscope  JEM-1400Plus Electron Microscope  JED-2300T Energy Dispersive X-ray Spectrometer  EM-05500TGP TEM Tomograph System Scanning Electron Microscopes (SEMs)  JSM-7800F Schottky Field Emission Scanning Electron Microscope  JSM-7800F Schottky Field Emission Scanning Electron Microscope  JSM-7200F Schottky Field Emission Scanning Electron Microscope  JSM-7610F Schottky Field Emission Scanning Electron Microscope  JSM-7500F Field Emission Scanning Electron Microscope  JSM-7100F Schottky Field Emission Scanning Electron Microscope  JSM-IT300 Scanning Electron Microscope  JSM-6510 Series Scanning Electron Microscope  JASM-6200 ClairScope Atmospheric Pressure Scanning Electron Microscope  JSM-6010PLUS/LA InTouchScope Multiple touch panel scanning electron microscope  JCM-6000Plus Versatile Benchtop SEM  JED-2300/2300F Energy dispersive X-ray Analyzer  miXcroscopy Linked Optical & Scanning Electron Microscopy System  Serial Block-face SEM JSM-7100F・7800F/Gatan 3View2XP MultiBeam Systems (SEM-FIB)  JIB-4601F Multi Beam System  JIB-4501 Multi Beam SEM-FIB System  JIB-4000 Focused Ion Beam Milling & Imaging System
  • 186.
    186 MICROSCOPY MARKET –GLOBAL FORECAST TO 2021 © MarketsandMarkets 11.10.3 RECENT DEVELOPMENTS Month & Year Approach Description January 2016 New Product Launch JEOL Ltd. launched JEM-F200, a multi-purpose transmission electron microscope. JEM-F200 offers features such as quad- lens condenser system, advanced scan system, Pico stage drive, and dual SDD. November 2016 New Product Launch JEOL Ltd. unveiled its scanning electron microscope, JSM- IT100 InTouchScope. This product features a compact design, space-efficient configuration, easy-to-use software interface, and EDS functions such as area analysis and line scans. August 2015 New Product Launch JEOL Ltd. introduced JSM-7200F, a field emission scanning electron microscope. JSM-7200F utilizes the JEOL proprietary in-lens Schottky Plus technology that allows high resolution at low accelerating voltages. August 2015 New Product Launch JEOL Ltd. introduced a benchtop scanning electron microscope, JCM-6000Plus NeoScope, equipped with high-sensitivity semiconductor detector, high-vacuum functionality, and secondary electron detector. This microscope offers a sleek exterior design, high-image quality, user-friendly interface with touch panel, and automated function for easy operation. August 2014 Collaboration JEOL collaborated with Oxford University (U.K.), Johnson Matthey (U.K.), and Diamond Light Source (U.K.), to establish a materials characterization facility at the Harwell Science and Innovation Campus. July 2014 New Product Launch JEOL launched the new JEM-ARM300F atomic resolution electron microscope. This product is equipped with a 300kV atomic resolution and aberration corrector. This helped the company to strengthen its market presence. October 2013 Partnership JEOL partnered with Gatan, Inc. (U.S.) to Serial Block Face imaging for SEM (SBFSEM) by integrating Gatan's 3View2.XP system on its JSM-7100F FE-SEM. September 2013 New Product Launch JEOL introduced the Scanning Electron Microscope JSM-IT300 series. This product is designed with a user interface and can be applied to research, material testing/assessment/defect analysis, quality assurance, and analytical tests. April 2013 New Product Launch JEOL launched MiXcroscopy, a new correlative microscope system that is a combination of optical microscopy and scanning electron microscopy. The company designed MiXcroscopy in collaboration with Nikon Corporation (Japan). This has fortified the company’s microscopy portfolio and strengthened its position in the market. Source: Press Releases
  • 187.
    187 MICROSCOPY MARKET –GLOBAL FORECAST TO 2021 © MarketsandMarkets 11.11 HITACHI HIGH-TECHNOLOGIES CORPORATION 11.11.1 BUSINESS OVERVIEW Hitachi High-Technologies Corporation, a subsidiary of Hitachi, Ltd., was established in 2001. It has headquarters in Tokyo, Japan. The company offers products through five distinct segments̶—Science and Medical Systems, Electronic Device Systems, Fine Technology Systems, Industrial and IT Systems, and Advanced Industrial Products. Hitachi-High Technologies Corporation was formed through the merger of three companies—The Instruments Group of Hitachi Ltd, the Semiconductor Manufacturing Equipment Group, and the Nissei Sangyo Co. Ltd.; Hitachi Electronics Engineering Co., Ltd. merged with this organization in 2004. The Electronic Devices Systems segment carries out the microscopy business. The company operates in Japan, North America, Europe, Asia, the Middle East, and Oceania. FIGURE 62 HITACHI HIGH-TECHNOLOGIES CORPORATION: COMPANY SNAPSHOT *Note: The total of the business revenue mix is more than 100% due to eliminations. Source: Company Website and Annual Reports Founded: 2001 Headquarters: Tokyo, Japan No. of Employees: 10,504 Revenue: USD 5,591.7 Million R&D Expenditure: USD 179.2 Million Ownership: Public COMPANY AT A GLANCE - 2015 GEOGRAPHIC REVENUE MIX BUSINESS REVENUE MIX RECENT FINANCIALS 40.7% 34.8% 14.0% 9.4% 1.1% Japan Asia Europe North America Others 40.4% 28.0% 16.3% 12.8% 2.3% 0.2% Advanced Industrial Products Science and Medical Systems Electronic Device Systems Industrial and IT Systems Fine Technology Systems Others 6,008.0 5,183.8 5,591.7 3.2% 3.2% 3.2% 2.5% 3.0% 3.5% 4.0% 4.5% 5.0% 4,600 4,800 5,000 5,200 5,400 5,600 5,800 6,000 6,200 2014 2015 2016 R&DExpenditure(%) TotalRevenue(USDMillion)
  • 188.
    188 MICROSCOPY MARKET –GLOBAL FORECAST TO 2021 © MarketsandMarkets 11.11.2 PRODUCTS OFFERED Category Product Transmission Electron Microscopes  Field Emission Transmission Electron Microscope HF-3300 System  Transmission Electron Microscope H-9500  Hitachi Spherical Aberration Corrected STEM/SEM HD-2700  Transmission Electron Microscope HT7700 Focused Ion Beam Systems  Focused Ion Beam System FB2000  Focused Ion & Electron Beam System nanoDUE’T NB5000  Micro-Sampling System  3D Analysis Holder  Real-time 3D Analytical FIB-SEM NX9000  CAD Navigation System Navigation System for Failure Analysis (NASFA)  Focused Ion and Electron Beam System & Triple Beam System NX2000  Focused Ion Beam System MI4050 Field Emission Scanning Electron Microscope  Ultra-high Resolution Scanning Electron Microscope Series  Schottky Field Emission Scanning Electron Microscope SU5000  Analytical UHR Schottky Emission Scanning Electron Microscope Series  Ultra-high Resolution Scanning Electron Microscope SU9000 SEM  Scanning Electron Microscope SU3500  Scanning Electron Microscope S-3700N  Scanning Electron Microscope SU1510  Scanning Electron Microscope FlexSEM 1000 Tabletop Microscopes  Tabletop Microscope TM3030 Series  Energy Dispersive X-ray Spectrometer Quantax70  Optional Accessory for Tabletop Microscope TM3030/TM3000 3D-VIEW  Energy Dispersive X-Ray Spectrometers AZtecOne /AZtecOneGO Nano-Probing System  Electron Beam Absorbed Current (EBAC) Characterization System nanoEBAC NE4000 AFM  Probe Station AFM5000II/Real Tunell  Scanning Probe Microscope AFM5500M  General-purpose Small Unit AFM5100N  Environmental Control Unit AFM5300E
  • 189.
    189 MICROSCOPY MARKET –GLOBAL FORECAST TO 2021 © MarketsandMarkets 11.11.3 RECENT DEVELOPMENTS Month & Year Approach Description April 2016 New Product Launch Hitachi High-Technologies Corporation launched the FlexSEM 1000 scanning electron microscope (SEM). The new compact size scanning electron microscope offers high-resolution, high-throughput imaging, and user-friendly design with automated functions. March 2016 New Product Launch Hitachi High-Tech Science Corporation, a subsidiary of Hitachi High- Technologies Corporation, introduced the AFM5500M scanning probe microscope (SPM). The product offers accuracy in measurement and is more suitable for nano-scale fundamental research, quality control, and industrial instrumentation field. August 2014 New Product Launch Hitachi High-Tech Science Corporation, an affiliated company of Hitachi High-Technologies Corporation, launched AFM5000II, a scanning probe microscope (SPM) controller, and the PS3500DDII, a sequential high-resolution ICP optical emission spectrometer. August 2014 New Product Launch Hitachi High-Technologies Corporation launched the TM3030Plus, a new tabletop electron microscope. This new microscope is equipped with a highly sensitive detector to observe secondary electron images under low-vacuum conditions. As of September 2014, the company had shipped over 2,700 tabletop microscopes. July 2014 New Product Launch Hitachi High-Technologies Corporation launched the SU5000, a Schottky field emission scanning electron microscope. This product is equipped with a new user interface and the EM Wizard, and has a maximum power current of 200nA. May 2013 New Product Launch Hitachi High-Technologies Corporation launched the SU8200, a field emission-scanning electron microscope (FE-SEM). This microscope is characterized by a novel cold field emission (CFE) gun. This launch has fortified the company’s microscopy portfolio and strengthened its position in the market. May 2013 New Product Launch Hitachi High-Technologies Corporation launched the TM3030, a tabletop microscope that can provide high-resolution images. This has extended the company’s portfolio of tabletop microscopes. April 2013 Expansion Hitachi High-Technologies established Hitachi High-Technologies India Private Limited (Hitachi High-Tech India) in Haryana, India. This new subsidiary mainly focuses on the sale of industrial-use equipment, industrial materials, electronic materials and software, and related services. This will help the company increase sales in the Asia-Pacific region. Source: Press Releases
  • 190.
    190 MICROSCOPY MARKET –GLOBAL FORECAST TO 2021 © MarketsandMarkets 12 APPENDIX 12.1 INSIGHTS OF INDUSTRY EXPERTS The global microscopy market is expected to grow at a CAGR of 7% to 8% from 2016 to 2021. Super-resolution microscopy is the upcoming trend in the global microscopy market. Emerging markets such as China, India, Brazil, and the Middle East offer significant growth opportunities for players in the microscopy market.
  • 191.
    191 MICROSCOPY MARKET –GLOBAL FORECAST TO 2021 © MarketsandMarkets 12.2 DISCUSSION GUIDE Q. 1. What are your views on the growth perspective of the global microscopy market? What is the current scenario of the market and at what rate is it expected to grow in the coming five years? Primary’s Viewpoint: _________________________________________________________________ Q. 2. Kindly provide the market sizes as well as projected growth rates of the following regional segments and their respective countries to the microscopy market in 2016. Region Market Size (%), 2016 CAGR% (2016–2021) North America  U.S.  Canada Europe  Germany  U.K.  France  Rest of Europe (RoE) Asia-Pacific Rest of the World (RoW)  Brazil  Mexico  Argentina  Rest of Latin America Primary’s Viewpoint: ________________________________________________________________
  • 192.
    192 MICROSCOPY MARKET –GLOBAL FORECAST TO 2021 © MarketsandMarkets Q. 3. Kindly provide the market sizes as well as projected growth rates of the following product segments of the global microscopy market. Which segment is expected to grow at the fastest rate and why? (Kindly validate the market segmentation and let me know if there are other product segments or if there is any overlap between these segments) Product Market Share (%), 2016 CAGR% (2016–2021) Optical Microscopes  Fluorescence Microscopes  Super-resolution Microscopes Confocal Microscopes  Spinning Disk Confocal Microscopes  Multiphoton Confocal Microscopes Electron Microscopes  Transmission Electron Microscopes  Scanning Electron Microscopes Scanning Probe Microscopes  Scanning Tunneling Microscopes  Atomic Force Microscopes  Near-field Scanning Optical Microscopes Primary’s Viewpoint: _________________________________________________________________ Q. 4. Kindly provide the market sizes as well as the projected growth rates of the following application segments of the global microscopy market. What is the key factor that will drive the fastest-growing segment of the market in the next five years? (Kindly validate the market segmentation and let me know if there are other applications or if there is any overlap between these segments) Application Market Share (%), 2016 CAGR% (2016–2021) Semiconductors Life Sciences Material Sciences Nanotechnology Primary’s Viewpoint: _________________________________________________________________
  • 193.
    193 MICROSCOPY MARKET –GLOBAL FORECAST TO 2021 © MarketsandMarkets Q. 5. Kindly provide the market sizes as well as the projected growth rates of the following end-user segments of the global microscopy market. What is the key factor that will drive the fastest-growing end-user segment of the market in the next five years? (Kindly validate the market segmentation and let me know if there are other end users or if there is any overlap between these segments) End User Market Share (%), 2016 CAGR% (2016–2021) Academic Institutes Industries (biotechnology and pharmaceutical, semiconductor, textile, mining, and natural resources industries) Other End Users (Government Research Institutions and Private Laboratories) Primary’s Viewpoint: _________________________________________________________________ Q. 6. What are the market shares of the following key companies in the global microscopy market? (Kindly validate the key companies and let me know if there are any other major companies in this market) Company Name Market Share (%), 2015 Carl Zeiss Leica Microsystems Nikon Corporation Olympus FEI Co. Primary’s Viewpoint: _________________________________________________________________ Q. 7. Please provide your insights on the key strengths, weaknesses, opportunities, and threats for the key companies mentioned in the table below? According to you, which company will win the market share race in the next five years and why? Company Name Strength Weakness Opportunity Threat Carl Zeiss Leica Microsystems Nikon Corporation Olympus FEI Co. Primary’s Viewpoint: _________________________________________________________________
  • 194.
    194 MICROSCOPY MARKET –GLOBAL FORECAST TO 2021 © MarketsandMarkets Q. 8. Kindly validate the drivers, restraints, opportunities, and challenges in the global microscopy market and let me know if there are any other factors affecting this market? Parameter Drivers  Rising global focus on nanotechnology  Government support and corporate funding  Technological advancements Restraints  High cost of advanced microscopes  Implementation of excise tax by the U.S. government  Heavy custom duty on medical devices Opportunities  Emerging markets (China, Brazil, India, and the Middle East)  New application areas such as quantum dots and optogenetics Challenges  Sample preparation  Requirement of a high degree of technical expertise Primary’s Viewpoint: _________________________________________________________________ Q. 9. What are the upcoming products that will have a significant impact on the market in the future? Primary’s Viewpoint: _________________________________________________________________ Q. 10. What will be the revenue pockets for the market in the next five years? Primary’s Viewpoint: ________________________________________________________________ Q. 11. How do you see your company’s position in this market in the next five years? Primary’s Viewpoint: _________________________________________________________________
  • 195.
    195 MICROSCOPY MARKET –GLOBAL FORECAST TO 2021 © MarketsandMarkets 12.3 OTHER DEVELOPMENTS Month & Year Approach Description May 2016 Product Enhancement Bruker Corporation launched SENTERRA II, a compact research grade confocal multi laser Raman microscope. SENTERRA II is the advanced version of SENTERRA with novel features such as compact size, easy to use interface, and higher resolution. SENTERRA II has wide array of applications which includes material science, pharmaceutical and novel nano-materials, life science, forensics, art, and geology. This product launch will extend the company’s microscopic portfolio in the market. April 2016 New Product Launch Carl Zeiss launched ZEISS LSM 880, a confocal laser scanning microscope for material science and failure analysis. The product comprises of the confocal fluorescence and other contrasting techniques which enables high-precision examination of nanomaterials, metals, polymers, and semiconductors with maximum information content. The product also offers precise capture of 3D topography and the investigation of nanometer-scaled structures. This launch will help the company to strengthen its confocal laser scanning microscope portfolio. April 2016 Product Enhancement Olympus Corporation launched FLUOVIEW FV3000 and FV3000RS confocal laser scanning microscopes series, an enhancement in the FV1200 series. The updated version includes features such as high speed, high-resolution, three-dimensional images, and high sensitivity that capture light even from dim samples. The series also offers high-resolution images for fast, accurate imaging of biological samples. With this launch company will strengthen confocal laser scanning microscopes portfolio. April 2016 New Product Launch Hitachi High-Technologies Corporation launched scanning electron microscope (SEM), FlexSEM 1000. The new compact size scanning electron microscope offers high resolution, high-throughput imaging, and user friendly design with automated functions. March 2016 New Product Launch Hitachi High-Tech Science Corporation a subsidiary of Hitachi High- Technologies Corporation introduced AFM5500M scanning probe microscope (SPM). The product offers accuracy in measurement and is more suitable for nano-scale fundamental research, quality control, and industrial instrumentation field. January 2016 Product Enhancement Bruker’s Nano Surfaces Division introduced MultiMode 8-HR Atomic Force Microscope (AFM) replacing the successor model, MultiMode platform. MultiMode 8-HR offers enhanced capabilities like high speed and higher resolution imaging for nanomechanics. With this launch the company enhanced its visibility in the highly competitive microscopy market. January 2016 New Product Launch Carl Zeiss launched Smartproof 5, a widefield confocal microscope for industrial applications in quality assurance and quality control departments, production environments, and research and development labs. The microscope offers 3D reconstructions and roughness measurements for a wide range of work piece surfaces. January 2016 Product Enhancement Carl Zeiss introduced EISS Xradia Versa with FPX, an extension for the ZEISS Xradia Versa 500-series of 3D X-ray microscopes. ZEISS FPX enhances image quality and improves workflow which is useful
  • 196.
    196 MICROSCOPY MARKET –GLOBAL FORECAST TO 2021 © MarketsandMarkets Month & Year Approach Description in the industrial development and academic research to examine large samples. January 2016 Product Enhancement Olympus Corporation unveiled BX53M/BXFM system microscope. BX53M/BXFM system microscope is an enhanced version of BXiS with the additional and improved features such as aperture adjustment and switching between different observation methods. January 2016 New Software Launch Olympus Corporation presented OLYMPUS Stream V2.1 software. The new software enables the instant MIA function for building composite panorama images. This launch helped the company to strengthen its software portfolio. January 2016 New Product Launch Olympus Corporation launched new units for SZX series of stereo microscopes; SZX2-LTTR ergonomic long tilting trinocular and SZX2- EEPA extendable eye point adjuster. The new launch helped to increase productivity and reduce the fatigue associated with microscope use. January 2016 New Product Launch JEOL Ltd. launched JEM-F200, a multi-purpose transmission electron microscope. JEM-F200 offers features such as quad-lens condenser system, advanced scan system, Pico stage drive, dual SDD and environment friendly with ECO mode energy saving system. September 2015 New Product Launch Oxford Instruments Asylum Research launched Cypher ES Polymer Edition, an atomic force microscope optimized for polymer research. The product offers highest resolution, fast scanning, heating, and the most comprehensive suite of nanomechanical characterization tools. Cypher ES polymer is useful for polymer and material science applications. August 2015 New Product Launch Bruker Corporation launched multipoint scanning confocal microscope; Opterra II, which symbolizes the next generation of quantitative live-cell microscopes. Opterra II includes features such as high speed and resolution, illumination uniformity, low photo- toxicity, and photo-bleaching capabilities. August 2015 New Product Launch JEOL Ltd. introduced JSM-7200F, a field emission scanning electron microscope. JSM-7200F utilizes JEOL proprietary in-lens Schottky Plus technology that allows high resolution at low accelerating voltages. August 2015 New Product Launch JEOL Ltd. introduced benchtop scanning electron microscope, JCM- 6000Plus NeoScope, equipped with high-sensitivity semiconductor detector, high-vacuum functionality, and secondary electron detector. This microscope offers sleek exterior design, high image quality, user friendly interface with touch panel, and automated function for easy operation. July 2015 New Product Launch Leica Microsystems launched Leica DM4 B and Leica DM6 B, an upright research microscopes series. The series has wide application in life science research, laser microdissection, neurosciences and evolutionary biology, materials science, and materials analysis. May 2015 New Product Launch Bruker Corporation introduced Contour Elite 3D Optical Microscopes, a fully integrate high-definition microscope with three- dimensional (3D) optical metrology functionality. With the features like high-speed operation, accuracy, repeatability, and imaging and
  • 197.
    197 MICROSCOPY MARKET –GLOBAL FORECAST TO 2021 © MarketsandMarkets Month & Year Approach Description display advantage it is useful to top-level research and development and production QC facilities. With this launch the company strengthened its optical microscopes portfolio. April 2015 New Product Launch ZEISS introduced ZEISS GeminiSEM and ZEISS Sigma– two product line of field emission scanning electron microscopes (FE-SEMs) with enhanced Gemini technology. The ZEISS GeminiSEM family provides high contrast and low voltage images from any sample. In addition, the ZEISS Sigma microscopes offer high quality imaging and advanced analytical microscopy. Both the product has wide range of applications in research, industrial labs, and imaging facilities. The proven Gemini design offers efficient detection, high resolution, and ease-of-use. April 2015 New Product Launch Leica Microsystems launched the Leica DVM6 digital microscope. Leica DVM6 offers Integrated illumination options and PlanApo- corrected optics ensure high quality images. The product has wide applications in inspection, analysis, and measurement in quality control, quality assurance, failure analysis, research and development, and forensics. April 2015 Product Enhancement Olympus Corporation introduced biological microscope CX23, an enhanced version of CX22LED. The microscope is easy to use and thus facilitates the use of these microscopes in educational training at various universities and other teaching laboratories. March 2015 Product Enhancement Nikon Corporation unveiled super resolution microscope N-STORM 4.0. N-STORM 4.0 is an enhanced version of the super resolution microscope, N-STORM which was released in 2010. The new enhanced product offers features such as dynamic super resolution imaging at the nanoscale level and improvement of image quality. This product enhancement helped the company to cater the unmet market needs. March 2015 New Product Launch Leica Microsystems introduced Leica EM Cryo CLEM, a system facilitates correlative light and electron microscopy (CLEM). CLEM enables sample study under fluorescence light microscope and the electron microscope and also allows rapid screening of large areas and fast determination of regions of interest. The Leica EM Cryo CLEM system comprises of a fluorescence light microscope with cryo stage, cryo objective, and a cyro transfer shuttle. March 2015 New Product Launch Olympus Corporation launched DSX Series of digital microscopes, the DSX510, DSX510i, and DSX110. Reliability and ease-of-use are the key features of this series. January 2015 New Product Launch ZEISS introduced LSM 800, a new compact confocal laser scanning microscope for high-end confocal imaging. ZEISS LSM 800 provides high image quality and offers enhanced productivity and throughput, as well as greater flexibility in live cell imaging. December 2014 New product launch ZEISS launched ZEISS Stemi 305 and ZEISS Stemi 508, two new compact Greenough stereo microscopes for education, lab routine and industrial inspection. The product offers images in true color, 3D, with high contrast and free of distortion or color fringes. November 2014 New product launch ZEISS introduced MultiSEM 505, a new scanning electron microscope (SEM) featured with 61 beams working in parallel, and
  • 198.
    198 MICROSCOPY MARKET –GLOBAL FORECAST TO 2021 © MarketsandMarkets Month & Year Approach Description offers an unrivaled capture speed. ZEISS MultiSEM 505 is designed for frequent operation and fitted with the intuitive ZEN Software. October 2014 New Product Launch Olympus Corporation launched the STM7 Measuring Microscope. This product can be used for efficient shape measurement of machine parts, semiconductors, electronic components, and other parts in industrial processes. This product launch helped the company to offer innovative technology to its customer base. However, this product is not available in Europe market. October 2014 New Product Launch Leica Microsystems introduced Leica M530 OH6 Neurosurgical Microscope. This microscope is armed with technologies such as advanced small angle illumination (SAI), FusionOptics, and apochromatic optics. This launch helped the company to strengthen its neurosurgical microscope portfolio. October 2014 Collaboration Carl Zeiss collaborated with University of California, Berkeley, to support BRAIN Initiative organized by the Berkeley Brain Microscopy Innovation Centre (BrainMIC). This BRAIN Initiative is supported by the National Institutes of Health (NIH). This initiative aimed to develop the company’s microscopy business by using emerging neurotechnologies. October 2014 New Product Launch Olympus Corporation launched the DP27 and DP22 standalone microscope digital cameras. These products can be used with both biological and industrial microscopes. This product launch helped the company to further expand its product portfolio. September 2014 New Product Launch Bruker Corporation introduced Innova-IRIS, the first guaranteed Tip- enhanced Raman Spectroscopy (TERS) system designed to accelerate the adoption of nano-Raman spectroscopy research. Innova-IRIS is a combination of TERS probes based on high-contrast tuning-fork with nano-Raman spectroscopy and high-performance Atomic Force Microscopy (AFM) capabilities. This launch enables the company to provide technologically advanced products to its customers. September 2014 Agreement Carl Zeiss signed an agreement with Howard Hughes Medical Institute (U.S.) to commercialize the Bessel beam plane illumination microscopy, also known as lattice light sheet microscopy. This technique offers high-speed 3D fluorescence imaging of living cellular and multicellular specimens. September 2014 New Product Launch Leica Microsystems introduced Leica Application Suite X (LAS X) imaging software in the life sciences segment for all widefield, confocal, and super-resolution microscopes. This software is equipped with a basic version known as LAS X Core. This launch strengthened the company’s microscope software portfolio. September 2014 New Product Launch Leica Microsystems introduced Leica M844 and Leica M822 ophthalmology microscopes with TrueVision 3D visualization, recording, and editing technologies. These microscopes help surgeons and researchers in anterior and posterior surgical techniques. September 2014 New Product Launch Leica Microsystems launched Leica DMi8 inverted microscope. The microscope is equipped with additional features such as incident illumination port, infinity port, and laser systems. This advanced
  • 199.
    199 MICROSCOPY MARKET –GLOBAL FORECAST TO 2021 © MarketsandMarkets Month & Year Approach Description product launch helped the company to strengthen its portfolio for inverted research microscopes. September 2014 Product Development Olympus Corporation developed its FV-OSR super-resolution technology. This product can be combined with the FV10-OSRASW biological confocal laser scanning microscope. This development helped the company to strengthen its customer base. September 2014 New Product Launch FEI introduced the Helios NanoLab G3 DualBeam, a combination of electron and ion optics microscopy, which comes in two different workflow-specific configurations for material science research. This product expanded FEI’s transmission electron microscope (TEM) portfolio. September 2014 New Product Launch FEI Co. unveiled the new Teneo VolumeScope (VS) scanning electron microscope (SEM), a fully integrated 3D volume imaging solution. This product is equipped with VolumeScope, an in-chamber microtome and proprietary analytical software. August 2014 New Product Launch Hitachi High-Technologies Corporation launched the TM3030Plus, a new tabletop electron microscope. This new microscope is equipped with a highly sensitive detector to observe secondary electron images under low-vacuum conditions. As of September 2014, the company has shipped over 2,700 Tabletop Microscopes. August 2014 New Product Launch Asylum Research, an Oxford Instruments company, launched AM-FM Viscoelastic Mapping Mode, a new nanomechanical imaging technique. This technique is a combination of quantitative abilities of normal tapping mode (AM) with high-sensitivity frequency modulation mode (FM). This launch strengthened the company’s NanomechPro toolkit product line. August 2014 New Product Launch Hitachi High-Tech Science Corporation, an affiliated company of Hitachi High-Technologies Corporation, launched AFM5000II, a Scanning Probe Microscope (SPM) controller, and the PS3500DDII, a sequential high-resolution ICP Optical Emission Spectrometer. July 2014 New Product Launch Bruker Corporation unveiled Inspire, its first integrated scanning probe microscopy (SPM) infrared system. This product is the integration of four technologies, namely, infrared scattering, scanning near-field optical microscope (sSNOM) optics, point-and- click alignment, and PeakForce Tapping. This launch helped the company to build its position in the emerging microscopy market. July 2014 New Product Launch Carl Zeiss introduced LSM 880 with Airyscan, a new confocal microscope. This microscope is equipped with increased sensitivity, resolution, and speed, leading to improved quantitative imaging and productivity. This launch helped the company to strengthen its market share and provide technologically developed solutions to its customers. July 2014 New Product Launch Leica Microsystems launched the new Leica LMD software V7.5.1. The software is equipped with features such as extended toolbox for shape definition, improved AVC software, remote navigation, and extension of time lapse. This advanced product launch helped the company to strengthen its portfolio of software solutions. July 2014 New Product Launch Leica Microsystems launched the new Leica Planapo 2.0x CORR objective for the Leica M series stereo microscope. The system can
  • 200.
    200 MICROSCOPY MARKET –GLOBAL FORECAST TO 2021 © MarketsandMarkets Month & Year Approach Description be used for imaging in aqueous solutions and provides users with sharp specimen visualization. This advanced product launch helped the company to strengthen its stereo microscope portfolio. July 2014 New Product Launch FEI Co. launched two new products, namely, the Helios plasma focused ion beam (PFIB) DualBeam and Teneo scanning electron microscope (SEM). These products can provide faster analyses in metal research. July 2014 New Product Launch JEOL launched the new JEM-ARM300F atomic resolution electron microscope. This product is equipped with a 300kV atomic resolution and aberration corrector. This helped the company to strengthen its market presence. July 2014 New Product Launch Hitachi High-Technologies Corporation launched the SU5000, a Schottky field emission scanning electron microscope. This product is equipped with a new user interface, the EM Wizard, and has a maximum power current of 200nA. July 2014 New Product Launch FEI Co. launched two new products, namely, a new phase plate solution and the Titan Halo transmission electron microscope (TEM). These two products are based on cryo-electron microscopy applications and enable analysis of 3D structure of molecules and molecular complexes. June 2014 New Product Launch Leica Microsystems introduced a new software platform - Leica Application Suite Advanced Fluorescence (LAS AF). This platform is used in widefield and confocal microscopy (v4.0) for advanced life science research. This product launch helped the company to strengthen its portfolio of software solutions. June 2014 New Product Launch Leica Microsystems launched the new Leica DMi1, an inverted microscope. The microscope is armed with LED illumination which delivers constant color temperature. June 2014 Partnership Leica Microsystems partnered with its distributors in Turkey, Mikro- Optik Tıbbi Malzeme Ithalat Ihracat ve Ticaret Limited and Gantenbein Ticaret Mürsel Gelincik ve Ortağı Adi Komandit Sirketi. This partnership will help the company strengthen its market presence in Turkey. June 2014 Collaboration FEI Co. collaborated with the metal labs at The University of Manchester's Electron Microscopy Centre in the School of Materials. This collaboration is aimed for steel and non-ferrous alloy research. May 2014 New Product Launch Nikon launched the DS-Ri2 Microscope Camera and DS-Qi2 Monochrome Microscope Camera. These products are equipped Nikon’s FX-format CMOS sensor. May 2014 New Product Launch Leica Microsystems along with Med X Change, Inc. (U.S.) launched the new EvolutionHD 2D Medical Video Recorder (EVO). The recorder delivers surgical content automatically to Apple iPad and iPhone devices and provides high-definition video recording. This launch helped the company to provide advanced technologies to its customers. May 2014 Product Development Leica Microsystems released Leica M320 F12, a clinic ear, nose, and throat (ENT) surgical microscope, with additional features of multifocal objective lens and a fully integrated HD 1080p camera. This product development helped surgeons to improve the efficiency
  • 201.
    201 MICROSCOPY MARKET –GLOBAL FORECAST TO 2021 © MarketsandMarkets Month & Year Approach Description at point of care. This launch strengthened the company’s product portfolio of surgical microscopes. May 2014 Product Enhancement Leica Microsystems unveiled Leica M320 F12 and Leica M720 OH5, for ear, nose, and throat (ENT) surgeries, at Combined Otolaryngology Spring Meetings (COSM). The M320 F12 is equipped with new Leica M320 MultiFoc objective lens, whereas, M720 OH5 is equipped with integrated TrueVision 3D technology. This launch helped the company to strengthen its surgical microscope portfolio. May 2014 Product Enhancement Leica Microsystems introduced the new version of Leica Steel Expert 2.0 software. This software is used for quick quality control upgradation in steel processing and manufacturing. This enhanced product helped the company to provide advanced technology-based products to its customers. May 2014 New Product Launch Leica Microsystems launched the new Leica TCS SP8 STED 3X, super-resolution system. The system’s main feature is its stimulated emission depletion (STED) technology. This product launch helped the company to strengthen its microscopy portfolio. April 2014 New Product Launch Nikon expanded its stereo microscope portfolio by introducing new products, namely, the SMZ1270, the SMZ1270i, and the SMZ800N. Of these, the SMZ1270 and SMZ1270i are equipped with new WF series objectives and offer highest-in-class zoom ratio. This product launch helped the company to strengthen its market share. April 2014 Product Enhancement Leica Microsystems introduced the new enhanced versions of Leica DM100 and Leica DM300 Educational Microscopes. These products are now equipped with new high-performance achromat objectives, ISO-labeled plan achromat objectives, new open monocular tubes, and improved optical correction for binocular tubes. This product enhancement helped the company strengthen its product portfolio by unveiling microscopes with the latest technologies for its customers. April 2014 Partnership Leica Microsystems extended its alliance with TrueVision 3D Surgical (U.S.). This partnership resulted in the integration of TrueVision’s 3D technology with Leica’s ophthalmic microscopes. This extended partnership enhanced Leica’s existing ophthalmic microscope product line. April 2014 New Product Launch Asylum Research introduced its new MFP-3D Infinity atomic force microscope (AFM), with new nanomechanical measurement capabilities. This launch benefited the company in the expansion of the MFP-3D AFM portfolio. March 2014 New Product Launch Carl Zeiss introduced ZEISS Primotech, a new imaging system for material analysis, at the Laser World of Photonics China 2014 trade show. This microscope is equipped with integrated camera and can quickly and reproducibly analyze products. This launch helped the company expand its product portfolio. March 2014 New Product Launch Leica Microsystems introduced the new Leica EM AFS2 Remote Monitoring Solution. This solution enabled remote monitoring of a freeze substitution program running on a Leica EM AFS2 unit. Such technologically advanced solutions aid the company to provide its customers with valuable solutions, and ultimately strengthen its
  • 202.
    202 MICROSCOPY MARKET –GLOBAL FORECAST TO 2021 © MarketsandMarkets Month & Year Approach Description customer base. February 2014 New Product Launch Leica Microsystems introduced Leica DCM8, a 3D surface metrology solution. This solution is equipped with interferometric optical and confocal profiler and provides experience of both technologies needed for surface analysis of materials. This new product launch helped the company to strengthen its confocal microscopy portfolio. February 2014 New Product Launch Leica Microsystems introduced Leica EM TIC 3X which can be used for the cross section of any material. This product uses the ion beam etching technique for scanning electron microscope (SEM) microstructure analysis. This new launch helped the company to strengthen its scanning electron microscopy portfolio. January 2014 New Product Launch Asylum Research unveiled the new atomic force microscope technique, namely, Scanning Microwave Impedance Microscopy (sMIM). This new AFM technique enables nanoscale mapping of permittivity and conductivity with unprecedented sensitivity and resolution on any material including conductors, semiconductors, and insulators. This launch strengthened the company’s MFP-3D and Cypher AFMs portfolio and provided it a competitive edge in the market. December 2013 New Product Launch Bruker Corporation introduced Opterra Multipoint Scanning Confocal Microscope at the American Society for Cell Biology Annual Meeting 2013. This microscope is used for the betterment of resolution and fast confocal imaging of live cell preparations. The launch strengthened the company’s product portfolio and provided flexible optical workstations to its end users. December 2013 New Product Launch Bruker Corporation launched ContourSP 3D optical microscope to measure each layer of the printed circuit board (PCB) panels during production. This launch extended the company’s product offerings for metrology systems. December 2013 New Product Launch Leica Microsystems introduced Steel Expert 2.0 software, for non- metallic inclusion analysis in steel alloys. This software is used to identify samples for non-metallic inclusions using automatic steel inclusion rating programs, which provides fast, accurate, and reproducible purity measurements in steel. This launch helped the company strengthen its product portfolio. November 2013 New Product Launch Nikon Corp. launched the new Ti-LAPP System, a laser application system. This system is featured with various combinations of multiple epi-fluorescence modules, with high flexibility, high expandability, an auto-alignment function to simplify TIRF observations, and a DMD Module that offers a variety of photo stimulation patterns. November 2013 Agreement Carl Zeiss granted a license for patents to Lumencor, Inc. (U.S.) for LED fluorescence excitation used in microscopy. This agreement benefited Zeiss to increase its market share in the U.S. market. November 2013 New Product Launch Asylum Research introduced blueDrive Photothermal Excitation, a technology for the Asylum’s Cypher AFM (AFMs) family. This technology is simple, stable, and enables accurate tapping mode imaging. This launch extended the company’s product portfolio in the microscopy market.
  • 203.
    203 MICROSCOPY MARKET –GLOBAL FORECAST TO 2021 © MarketsandMarkets Month & Year Approach Description November 2013 Product Development Leica Microsystems released Laser Microdissection Software Version 7.4. This software has features such as Leica laser screw, image overlay, and lasing within fluorescence. This development helped the company to maintain its position in the market by offering products with latest technologies in the microscopy market. November 2013 New Product Launch Carl Zeiss unveiled Photoactivated Localization Microscopy (PALM) in 3D as a new technology for 3D super-resolution microscopy at the Society for Neuroscience Annual Meeting in California. This launch helped the company expand its 3D microscopy portfolio. October 2013 New Product Launch FEI Co. introduced the Tecnai Femto ultrafast electron microscope (UEM). This product was first installed by the University of Minnesota in November 2013. This helped the company to become one of the innovative companies in the microscopy market. October 2013 Partnership JEOL partnered with Gatan, Inc. (U.S.), to encourage the technique of the Serial Block Face SEM (SBFSEM) by integrating Gatan's 3View2.XP system on its JSM-7100F FE-SEM. October 2013 New Product Launch FEI Co. introduced ExSolve, a high-throughput sample preparation workflow for transmission electron microscopy (TEM) analysis. This product enables site-specific TEM lamella preparation, giving semiconductor manufacturers more information than conventional approaches. September 2013 New Product Launch JEOL introduced the Scanning Electron Microscope JSM-IT300 series. This product is designed with a user interface and can be applied to research, material testing/assessment/defect analysis, quality assurance, and analytical tests. September 2013 New Product Launch Bruker Corporation launched the new LumiMap Electroluminescence System for control of epi process quality. This product provides reliable electrical and optical epi wafer measurements. September 2013 New Product Launch Carl Zeiss unveiled Gemini I VP (Variable Pressure) Focused Ion Beam (FIB) Column and Gemini II Column. These two products enable fast and precise material processing in 3D nanotomography and nanofabrication. This launch helped the company to strengthen its scanning electron microscope (SEM) portfolio. September 2013 New Product Launch Asylum Research introduced Contact Resonance Viscoelastic Mapping Mode technique. This new technique enables high- resolution, quantitative imaging particularly suited for characterizing moderate-to-high modulus materials. This launch helped the company to augment its current product offerings in NanomechPro Toolkit. August 2013 New Product Launch Carl Zeiss introduced the new ZEISS Xradia 810 Ultra, an X-ray microscopy (XRM) solution that increases throughput for 3D imaging at the nanoscale by up to 10 times. This launch expanded the company’s product offerings in the microscopy business. August 2013 New Product Launch Carl Zeiss unveiled the next-generation EVO series for scanning electron microscope for material and life science applications. The EVO series reduces workflow from 400 steps to 15 steps. This launch helped the company to broaden its product offerings and to increase its customer base.
  • 204.
    204 MICROSCOPY MARKET –GLOBAL FORECAST TO 2021 © MarketsandMarkets Month & Year Approach Description August 2013 New Product Launch FEI Co. launched three new TEMs, namely, the Metrios TEM, the Talos TEM, and the Titan Themis TEM. These three new microscopes can perform efficiently and effectively in the semiconductor manufacturing, material and life sciences, and atomic-scale measurement applications. August 2013 New Product Launch Asylum Research unveiled the new GetReal Automated Probe Calibration feature for the atomic force microscope (AFM). This technology enables consistent and accurate results, and strengthened the company’s position in the microscopy market. July 2013 New Product Launch FEI Co. unveiled two new DualBeam systems, namely, Scios DualBeam and Helios NanoLab 660 DualBeam. Both systems are specially designed for imaging materials. June 2013 New Product Launch FEI co. introduced the Helios NanoLab 1200AT, a new DualBeam system. This system is equipped with an automated front-opening universal pod (FOUP) loader. June 2013 Collaboration FEI Co. collaborated with the University of Oklahoma to establish the FEI-OU Pore Scale Characterization Laboratory at the Mewborne School of Petroleum and Geological Engineering (MPGE). The collaboration agreement includes FEI's Helios NanoLab 650 DualBeam and QEMSCAN automated mineralogy tool for evaluation of organic particles. May 2013 New Product Launch Nikon launched two research stereo microscopes, the SMZ25 motorized epi-fluorescence set and the SMZ18 episcopic plain stand set. These products are equipped with large zoom range and enhanced epi-fluorescence imaging. May 2013 New Product Launch Asylum Research launched the new MFP-3D Origin atomic force microscope (AFM). The technology has superior performance and is affordable as compared to the existing technologies in the AFM portfolio. This new launch helped the company extend its range of AFMs and strengthened its position in this market. May 2013 New Product Launch Hitachi High-Technologies Corporation launched the SU8200, a Field Emission-Scanning Electron Microscopes (FE-SEM). This microscope is characterized by a novel cold field emission (CFE) gun. This fortified the company’s microscopy portfolio and strengthened its position in the market. May 2013 New Product Launch Hitachi High-Technologies Corporation launched the TM3030, a tabletop microscope that can provide high-resolution images. This extended the company’s portfolio of tabletop microscopes. May 2013 New Product Launch Olympus Corporation launched the LEXT OLS4100 3D, a measuring laser microscope, equipped for performing 3D observations and measurements of surface features on microelectronic devices. April 2013 Product Enhancement Bruker Corporation developed its PeakForce Tapping technology to form Dimension Edge-Scan Asyst platform. This product is an expansion of the proprietary PeakForce Tapping technology. This modified tool helped the company to provide advanced technological solutions to its customers. April 2013 New Product Launch JEOL launched a new correlative microscope system, ‘MiXcroscopy’, a combination of optical microscopy and scanning electron
  • 205.
    205 MICROSCOPY MARKET –GLOBAL FORECAST TO 2021 © MarketsandMarkets Month & Year Approach Description microscopy. The company designed MiXcroscopy in collaboration with Nikon Corporation (Japan). This has fortified the company’s microscopy portfolio and strengthened its position in the market. April 2013 Partnership Bruker Corporation partnered with the University of Manchester’s National Graphene Institute (NGI), a leader in graphene research, to provide its Dimension FastScan Atomic Force Microscope (AFM). This partnership leveraged Bruker’s expertise in the microscopy segment. March 2013 New Product Launch Bruker Corporation launched new products at Pittcon 2013, an annual conference and exposition for laboratory science. The launched products include ContourGT-K 3D optical microscope and SkyScan 1272, a high-resolution X-ray micro-CT 3D microscope. At the Pittcon 2013, the company unveiled various new products to mark its presence in the microscopy market. March 2013 New Product Launch Olympus Corporation unveiled a series of IX3 series units and the cellSens V1.8 imaging software for inverted microscopes. The IX3 series units efficiently work with the upgraded version of Olympus' cellSens V1.8 microscope imaging software. March 2013 New Product Launch FEI Co. released a new combined scanning electron microscope (SEM) and X-ray spectrometer, the ASPEX CleanCHK analyzer. This product is equipped with an automated electron beam-based particulate contamination monitor. Source: Press Releases
  • 206.
    206 MICROSCOPY MARKET –GLOBAL FORECAST TO 2021 © MarketsandMarkets 12.4 KNOWLEDGE STORE: MARKETSANDMARKETS’ SUBSCRIPTION PORTAL Knowledge Store contains MarketsandMarkets’ unique market insights. As a subscriber you have access to all of the published titles and any new ones added over the course of the subscription period. You can subscribe to specific number of reports or domains of your interest. Knowledge Store enables you to:  View & download all subscribed reports from a single, online platform  Contact our analysts to answer any questions related to our reports or request a custom research  Share comments on specific reports with the other users of your organization  Suggest titles/topics to our research teams that you would like us to cover in our future reports  Identify reports published on the high growth markets within your industry Get started now by requesting a demo and learning more about Knowledge store - www.mnmks.com MARKETSANDMARKETS KNOWLEDGE STORE SNAPSHOT
  • 207.
    207 MICROSCOPY MARKET –GLOBAL FORECAST TO 2021 © MarketsandMarkets MARKETSANDMARKETS KNOWLEDGE STORE: HEALTHCARE INDUSTRY SNAPSHOT
  • 208.
    208 MICROSCOPY MARKET –GLOBAL FORECAST TO 2021 © MarketsandMarkets 12.5 INTRODUCING RT: REAL-TIME MARKET INTELLIGENCE Revenue Tree (RT) is an interactive platform that systematically helps users enhance revenues by identifying high-potential growth markets and tracking them on a real-time basis, at a competitive, customer-centric, and ecosystem level. The in-built intelligence of the tool auto-identifies competitors, allied markets, market values, and customers, and helps users identify tangible hotspots of revenue growth, both in existing and new markets. The unique feature of RT is the ecosystem, which is linked across a wide range of industries and markets. Features and Benefits of RT:  Visual presentation of market data  Real-time information on market trends and developments  Information specific to an application, type, or geography  Competitive intelligence (by tracking developments of major companies)  Forward integration in the value chain to find potential clients  Comparison of two or more markets Value Chain
  • 209.
    209 MICROSCOPY MARKET –GLOBAL FORECAST TO 2021 © MarketsandMarkets Market Dashboard 12.6 AVAILABLE CUSTOMIZATIONS With the given market data, MarketsandMarkets offers customizations as per the company’s specific needs. The following customization options are available for the report: Geographical Analysis  Further breakdown of the Asia-Pacific microscopy market into India, China, and Rest of Asia- Pacific Company Information  Detailed analysis and profiling of additional market companies (Up to five)  Market by volume
  • 210.
    210 MICROSCOPY MARKET –GLOBAL FORECAST TO 2021 © MarketsandMarkets 12.7 RELATED REPORTS Sr. No. Report Title Published Date 1 EUROPEAN MICROSCOPY MARKET By Product (Optical (Fluorescence, Super-Resolution), Confocal, Electron (Transmission), Scanning (AFM)), Application (Semiconductor, Life Science, Nanotechnology), End User (Academic Institute, Industries) - Forecast to 2020 http://www.marketsandmarkets.com/Market-Reports/european-microscopy-market- 9816453.html May 2015 2 PROTEIN LABELING MARKET By Product (Reagents, Kits, & Services), Labeling Method (In Vitro Labeling, In Vivo Labeling), Application (Cell-Based Assay, Fluorescence Microscopy, Immunological Technique), & Region - Global Forecast to 2020 http://www.marketsandmarkets.com/Market-Reports/protein-labeling-market- 16300533.html December 2015
  • 211.
    211 MICROSCOPY MARKET –GLOBAL FORECAST TO 2021 © MarketsandMarkets Disclaimer: MarketsandMarkets strategic analysis services are limited publications containing valuable market information provided to a select group of customers in response to orders. Our customers acknowledge, when ordering, that MarketsandMarkets strategic analysis services are for our customers’ internal use and not for general publication or disclosure to third parties. Quantitative market information is based primarily on interviews and therefore, is subject to fluctuation. MarketsandMarkets does not endorse any vendor, product or service depicted in its research publications. MarketsandMarkets strategic analysis publications consist of the opinions of MarketsandMarkets' research and should not be construed as statements of fact. MarketsandMarkets disclaims all warranties, expressed or implied, with respect to this research, including any warranties of merchantability or fitness for a particular purpose. MarketsandMarkets takes no responsibility for any incorrect information supplied to us by manufacturers or users. All trademarks, copyrights and other forms of intellectual property belong to their respective owners and may be protected by copyright. Under no circumstance may any of these be reproduced in any form without the prior written agreement of their owner. No part of this strategic analysis service may be given, lent, resold or disclosed to non-customers without written permission. Reproduction and/or transmission in any form and by any means including photocopying, mechanical, electronic, recording or otherwise, without the permission of the publisher is prohibited. For information regarding permission, contact: Tel: 1-888-600-6441 Email: sales@marketsandmarkets.com