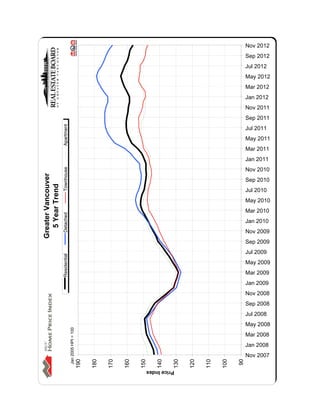
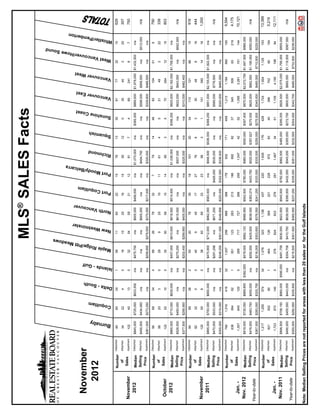
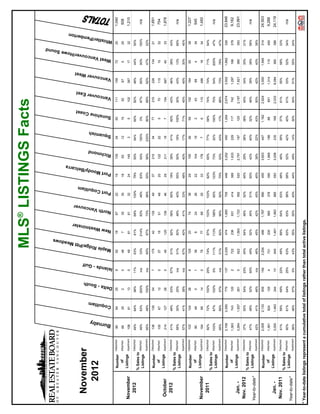
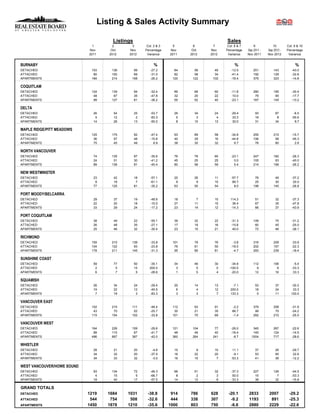
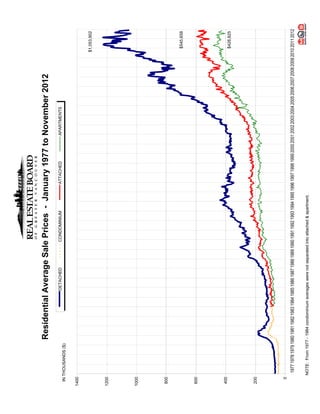
News Release
 Greater Vancouver residential property sale and listing
activity below 10-year averages in November
Vancouver, B.C. – December 4, 2012 – Over the past six months, the Greater Vancouver
housing market has seen a reduction in the number of homes listed for sale, a gradual moderation
in home prices and a decrease in property sales compared to historical averages.

The Real Estate Board of Greater Vancouver (REBGV) reports that residential property sales of
detached, attached and apartment properties reached 1,686 on the region’s Multiple Listing
Service® (MLS®) in November, a 28.6 per cent decline compared to the 2,360 sales in
November 2011 and a 12.7 per cent decline compared to the 1,931 home sales in October 2012.

November sales were 30.3 per cent below the 10-year November sales average of 2,420.

“Home sellers appear more inclined to remove their properties from the market today rather than
lower prices to sell their properties. On the other hand, buyers appear to be expecting prices to
moderate,” Eugen Klein, REBGV president said.

New listings for detached, attached and apartment properties in Greater Vancouver totalled 2,758
in November. This represents a 14.4 per cent decline compared to November 2011 when 3,222
properties were listed for sale on the MLS® and a 36.2 per cent decline compared to the 4,323
new listings in October 2012.

New listings were 12.9 per cent below the 10-year November average of 3,168.

At 15,689, the total number of residential property listings on the MLS® increased 13 per cent
from this time last year and declined 9.7 per cent compared to October 2012. Total listings in the
region have declined by nearly 3,000 properties since reaching a peak of 18,493 in June.

The region’s sales-to-active-listings ratio was unchanged from October at 11 per cent.

“Home prices in Greater Vancouver have generally declined between three and five and a half
per cent, depending on property type, since reaching a peak six months ago,” Klein said.
“Changes in home prices vary per municipality and neighbourhood. It’s good to check local
market statistics with your REALTOR®.”

Since reaching a peak in May of $625,100, the MLS® Home Price Index composite benchmark
price for all residential properties in Greater Vancouver has declined 4.5 per cent to $596,900.
This represents a 1.7 per cent decline when we compared to this time last year.
Sales of detached properties in Greater Vancouver reached 629 in November, a decrease of 31.3
per cent from the 916 detached sales recorded in November 2011, and a 40.1 per cent decrease
from the 1,050 units sold in November 2010. Since reaching a peak in May, the benchmark price
for a detached property in Greater Vancouver has declined 5.5 per cent to $914,500.

Sales of apartment properties reached 750 in November 2012, a 25 per cent decrease compared
to the 1,000 sales in November 2011, and a decrease of 28.7 per cent compared to the 1,052 sales
in November 2010. Since reaching a peak in May, the benchmark price for an apartment
property in Greater Vancouver has declined 3.9 per cent to $364,900.

Attached property sales in November 2012 totalled 307, a 30.9 per cent decrease compared to the
444 sales in November 2011, and a 24.6 per cent decrease from the 407 attached properties sold
in November 2010. Since reaching a peak in April, the benchmark price for an attached property
in Greater Vancouver has declined 3.6 per cent to $454,300.

Feature Facts:

    •    Of the 15,689 homes currently for sale on the MLS® in Greater Vancouver, 49.6 per cent
         are listed for $600,000 or less. Of those, 1,321 are detached properties, 5,039 are
         condominiums and 1,419 are townhomes.

    •    Of the 1,686 homes that sold in Greater Vancouver in November, 273 (16%) sold for $1
         million or more.

                                                      -30-

The real estate industry is a key economic driver in British Columbia. In 2011, 32,390 homes changed ownership in
the Board's area, generating $1.36 billion in spin-off activity and 9,069 jobs. The total dollar value of residential
sales transacted through the MLS® system in Greater Vancouver totalled $25 billion in 2011. The Real Estate Board
of Greater Vancouver is an association representing more than 11,000 REALTORS® and their companies. The
Board provides a variety of member services, including the Multiple Listing Service®. For more information on real
estate, statistics, and buying or selling a home, contact a local REALTOR® or visit www.rebgv.org.

For more information please contact:
Craig Munn, Assistant Manager of Communication
Real Estate Board of Greater Vancouver
Phone: (604) 730-3146
cmunn@rebgv.org
*                            November 2012


                                                                                         Benchmark                  Price             1 Month  3 Month  6 Month  1 Year   3 Year   5 Year
           Property Type                                       Area
                                                                                           Price                    Index            Change % Change % Change % Change % Change % Change %

   Residential / Composite                       Lower Mainland                             $538,100                 151.9               -0.9%               -1.9%   -3.6%   -0.9%     7.6%     6.6%
                                                 Greater Vancouver                          $596,900                 156.5               -1.1%               -2.1%   -4.5%   -1.7%     8.6%     9.1%
                                                 Bowen Island                               $573,800                 124.4               -2.1%               -3.7%   -8.3%   -1.7%    -5.9%    -8.9%
                                                 Burnaby East                               $551,000                 152.1               -2.2%               -1.9%   -4.0%    0.5%     5.8%     6.7%
                                                 Burnaby North                              $505,900                 151.1               -0.5%               -1.2%   -4.1%   -2.4%     6.0%     6.6%
                                                 Burnaby South                              $565,700                 159.5               -1.1%               -1.2%   -3.1%   -1.8%    10.8%   12.8%
                                                 Coquitlam                                  $501,400                 148.3               -0.3%               -0.8%   -2.1%    1.6%     8.0%     5.5%
                                                 Ladner                                     $514,400                 143.1               -2.3%               -6.2%   -8.2%   -4.1%     4.5%     5.1%
                                                 Maple Ridge                                $388,700                 131.4               -0.8%               -0.3%   -0.9%   -0.2%     0.2%    -4.6%
                                                 New Westminster                            $358,800                 154.0               -1.3%               -2.2%   -3.6%   -1.2%     5.1%     4.1%
                                                 North Vancouver                            $639,900                 144.8               -1.3%               -2.2%   -3.6%    1.8%     5.6%     4.5%
                                                 Pitt Meadows                               $387,400                 140.3                2.0%               2.9%    2.3%    1.2%      3.8%    -0.3%
                                                 Port Coquitlam                             $396,000                 140.6               -0.7%               -0.1%   -3.2%   -1.1%     0.7%    -1.5%
                                                 Port Moody                                 $512,700                 141.6                0.3%               -0.2%    0.3%   5.9%      4.7%     1.2%
                                                 Richmond                                   $569,900                 165.5               -0.5%               -1.3%   -4.5%   -2.2%    11.1%   17.0%
                                                 Squamish                                   $385,900                 124.6               -1.8%               -5.0%   -4.5%    3.3%    -1.0%    -4.2%
                                                 Sunshine Coast                             $353,100                 123.7               -3.3%               -3.6%   -4.2%   -2.1%    -6.4%    -9.5%
                                                 Tsawwassen                                 $589,300                 148.5               -1.3%               -2.9%   -3.9%   -0.6%     9.0%     7.3%
                                                 Vancouver East                             $605,000                 177.0               -0.5%               -1.4%   -2.2%    1.1%   15.3%    19.6%
                                                 Vancouver West                             $789,100                 166.3               -0.3%               -1.7%   -6.1%   -3.6%    10.5%   11.5%
                                                 West Vancouver                            $1,501,500                161.2               -3.0%               -6.2%   -9.1%   -2.4%   19.8%    11.6%
                                                 Whistler                                   $453,300                 108.0               -2.2%               -6.2%   -7.8%    0.5%   -11.3%   -16.4%
   Single Family Detached                        Lower Mainland                             $749,600                 159.3               -1.1%               -2.3%   -3.9%   -0.9%   14.8%    14.4%
                                                 Greater Vancouver                          $914,500                 169.0               -1.4%               -2.9%   -5.5%   -2.3%   17.8%    19.8%
                                                 Bowen Island                               $573,800                 124.4               -2.1%               -3.7%   -8.3%   -1.7%   -5.9%    -8.9%
                                                 Burnaby East                               $719,100                 160.8               -3.1%               -4.7%   -6.3%    0.6%   11.9%    15.3%
                                                 Burnaby North                              $909,800                 175.6               -0.6%               -0.4%   -3.7%    1.3%   21.0%    24.6%
                                                 Burnaby South                              $976,600                 187.2               -1.2%               -2.9%   -2.6%    1.5%   29.5%    34.5%
                                                 Coquitlam                                  $705,000                 156.2               -0.4%               -1.4%   -1.9%    2.6%   14.1%    13.0%
                                                 Ladner                                     $591,800                 142.8               -2.5%               -7.2%   -9.7%   -4.5%    5.5%     5.9%
                                                 Maple Ridge                                $459,200                 130.5               -1.7%               -0.8%   -1.4%    1.0%    1.3%    -3.1%
                                                 New Westminster                            $645,400                 160.1               -2.1%               -4.1%   -6.1%   -0.9%   11.8%    15.0%
                                                 North Vancouver                            $931,100                 148.6               -1.5%               -2.6%   -5.4%    0.3%    9.6%     8.5%
                                                 Pitt Meadows                               $503,100                 140.4                0.0%               1.4%    -0.1%   -0.8%    4.1%     2.4%
                                                 Port Coquitlam                             $553,400                 147.8               -0.5%               -1.1%   -1.7%    1.4%    7.9%     7.5%
                                                 Port Moody                                 $833,300                 154.4               -2.3%               -1.7%   -1.0%    4.7%   13.4%    10.3%
                                                 Richmond                                   $955,500                 192.4               -1.0%               -2.0%   -6.2%   -4.2%   25.5%    34.9%
                                                 Squamish                                   $483,800                 130.7               -2.2%               -3.8%   -4.0%   -2.8%    1.5%     0.8%
                                                 Sunshine Coast                             $352,200                 123.4               -3.4%               -3.4%   -4.0%   -2.4%   -6.5%    -9.7%
                                                 Tsawwassen                                 $712,000                 153.3               -1.5%               -2.3%   -3.6%    1.4%   14.1%    10.8%
                                                 Vancouver East                             $835,100                 184.4               -0.9%               -2.8%   -3.2%    0.5%   23.5%    30.0%
                                                 Vancouver West                            $2,029,300                208.5               -1.6%               -4.1%   -9.7%   -8.4%   27.8%    33.6%
                                                 West Vancouver                            $1,772,800                168.8               -2.8%               -6.4%   -9.0%   -1.1%   24.9%    17.0%
                                                 Whistler                                   $877,000                 121.4                3.8%               4.2%    6.0%    -1.6%   -3.7%    -7.7%
HOW TO READ THE TABLE:
• Benchmark Price: Estimated sale price of a benchmark property. Benchmarks represent a typical property within each market.

• Price Index: Index numbers estimate the percentage change in price on typical and constant quality properties over time. All figures are based on past sales.

• x Month/Year Change %: Percentage change of index over a period of x month(s)/year(s)                                                                                                                *
  In January 2005, the indexes are set to 100.

  Townhome properties are similar to Attached properties, a category that was used in the previous MLSLink HPI, but do not included duplexes.

  The above info is deemed reliable, but is not guaranteed. All dollar amounts in CDN.


* MLS®, Multiple Listing Service®, and all related graphics are trademarks of The Canadian Real Estate Association                                                                                1 of 10
*                            November 2012


                                                                                         Benchmark                  Price             1 Month  3 Month  6 Month  1 Year   3 Year   5 Year
           Property Type                                       Area
                                                                                           Price                    Index            Change % Change % Change % Change % Change % Change %

             Townhouse                           Lower Mainland                             $389,500                 141.4               -0.1%               -1.6%   -3.2%   -2.0%    3.1%     1.9%
                                                 Greater Vancouver                          $454,300                 147.4               -0.7%               -1.7%   -3.3%   -2.1%    5.1%     6.0%
                                                 Burnaby East                               $414,000                 148.5               -0.3%               -1.4%   -1.7%    1.8%    4.7%     7.0%
                                                 Burnaby North                              $385,300                 143.7               -0.6%               -2.9%   -3.2%   -8.6%    2.1%     2.0%
                                                 Burnaby South                              $415,800                 149.2               0.9%                -0.1%   -2.1%   -1.2%    5.8%     8.7%
                                                 Coquitlam                                  $388,700                 142.8               0.2%                1.6%    1.5%     5.1%    5.2%     3.5%
                                                 Ladner                                     $434,600                 144.0               -3.5%               -3.3%   -5.2%   -0.9%    4.0%     3.6%
                                                 Maple Ridge                                $270,700                 131.5               -0.3%               -1.2%   -1.6%   -3.5%   -2.7%    -6.9%
                                                 New Westminster                            $383,900                 144.2               -3.6%               -1.4%   -3.4%   -1.5%    4.5%     5.0%
                                                 North Vancouver                            $575,700                 137.8               -0.5%               -2.4%   -4.4%   -3.1%    0.8%     3.1%
                                                 Pitt Meadows                               $332,100                 143.7               3.1%                3.3%    3.4%     3.8%    6.9%     2.6%
                                                 Port Coquitlam                             $370,100                 140.9               -0.1%                1.6%   -2.3%   -0.3%    1.4%    -0.8%
                                                 Port Moody                                 $413,400                 139.7               0.5%                1.3%    1.6%     2.7%    2.7%    -0.9%
                                                 Richmond                                   $492,500                 159.2               -0.6%               -2.0%   -3.3%   -3.3%   10.5%    15.7%
                                                 Squamish                                   $328,200                 119.1               -2.8%               -7.5%   -7.2%   13.2%   -7.1%    -5.9%
                                                 Tsawwassen                                 $447,600                 138.4               -3.2%               -2.4%   -6.0%   -6.8%    0.0%    -0.4%
                                                 Vancouver East                             $499,600                 164.7               -0.8%               -2.5%   -3.7%   -3.1%    8.6%    10.4%
                                                 Vancouver West                             $679,000                 153.6               0.2%                -1.4%   -4.4%   -1.9%    7.9%    10.3%
                                                 Whistler                                   $443,600                 119.5               1.4%                -3.8%   -7.0%   17.9%    1.4%    -3.7%
              Apartment                          Lower Mainland                             $334,600                 146.8               -1.0%               -1.5%   -3.4%   -0.5%     0.6%    -1.2%
                                                 Greater Vancouver                          $364,900                 147.5               -1.1%               -1.4%   -3.9%   -1.0%     1.0%     0.1%
                                                 Burnaby East                               $357,500                 135.7               -2.4%                4.7%   -2.9%   -1.5%    -9.2%   -13.1%
                                                 Burnaby North                              $327,700                 138.5               -0.4%               -0.8%   -4.2%   -2.2%    -2.3%    -3.1%
                                                 Burnaby South                              $367,600                 147.6               -1.6%                0.1%   -3.7%   -4.7%     2.0%     2.4%
                                                 Coquitlam                                  $251,100                 138.2               -0.1%               -0.9%   -3.9%   -1.8%    -0.4%    -5.3%
                                                 Ladner                                     $302,100                 143.2               -0.6%               -6.0%   -5.2%   -5.0%     1.5%     3.5%
                                                 Maple Ridge                                $186,800                 136.2               2.1%                2.9%    3.2%     0.4%    0.0%     -8.6%
                                                 New Westminster                            $267,500                 152.9               -0.8%               -1.6%   -2.6%   -1.4%     2.8%     0.8%
                                                 North Vancouver                            $349,000                 141.7               -1.3%               -1.9%   -1.0%    5.6%     2.3%    -0.1%
                                                 Pitt Meadows                               $232,700                 137.5               4.5%                5.2%    6.3%     2.7%    1.0%     -7.7%
                                                 Port Coquitlam                             $220,000                 130.4               -1.4%                0.0%   -6.1%   -5.2%    -8.9%   -13.6%
                                                 Port Moody                                 $320,600                 133.6               2.5%                -0.3%   0.2%     9.2%    -0.5%    -3.7%
                                                 Richmond                                   $339,600                 144.0               -0.1%               -0.2%   -3.4%    0.2%    -2.8%     0.5%
                                                 Squamish                                   $241,100                 116.0               -0.3%               -6.0%   -3.4%   16.2%    -1.4%   -13.6%
                                                 Tsawwassen                                 $323,500                 136.1               -0.4%               -5.4%   -4.8%   -5.2%    -3.5%    -1.7%
                                                 Vancouver East                             $308,300                 170.1               -0.1%                0.4%   -0.8%    3.1%     6.5%     8.4%
                                                 Vancouver West                             $468,400                 151.6               0.4%                -0.5%   -4.1%   -1.0%     2.8%     2.3%
                                                 West Vancouver                             $590,400                 129.0               -3.4%               -3.7%   -9.1%   -8.1%    -2.4%   -11.4%
                                                 Whistler                                   $227,000                 81.5                -5.5%               -8.2%   -7.7%   -0.5%   -33.7%   -38.4%


HOW TO READ THE TABLE:
• Benchmark Price: Estimated sale price of a benchmark property. Benchmarks represent a typical property within each market.

• Price Index: Index numbers estimate the percentage change in price on typical and constant quality properties over time. All figures are based on past sales.

• x Month/Year Change %: Percentage change of index over a period of x month(s)/year(s)

  In January 2005, the indexes are set to 100.                                                                                                                                                         *
  Townhome properties are similar to attached properties, a category that was used in the previous MLSLink HPI, but do not included duplexes.

  Lower Mainland includes areas serviced by both Real Estate Board of Greater Vancouver & Fraser Valley Real Estate Board.

  The above info is deemed reliable, but is not guaranteed. All dollar amounts in CDN.


* MLS®, Multiple Listing Service®, and all related graphics are trademarks of The Canadian Real Estate Association                                                                                2 of 10
Nov 2012
                                                                                                                                                       Sep 2012
                                                                                                                                                       Jul 2012
                                                                                                                                                       May 2012
                                                                                                                                                       Mar 2012
                                                                                                                                                       Jan 2012
                                                                                                                                                       Nov 2011
                                                                                                                                                       Sep 2011
                                                   Apartment


                                                                                                                                                       Jul 2011
                                                                                                                                                       May 2011
                                                                                                                                                       Mar 2011
                                                                                                                                                       Jan 2011
                                                                                                                                                       Nov 2010
                                                   Townhouse
Greater Vancouver


                                                                                                                                                       Sep 2010
   5 Year Trend


                                                                                                                                                       Jul 2010
                                                                                                                                                       May 2010
                                                                                                                                                       Mar 2010
                                                   Detached


                                                                                                                                                       Jan 2010
                                                                                                                                                       Nov 2009
                                                                                                                                                       Sep 2009
                                                                                                                                                       Jul 2009
                                                   Residential


                                                                                                                                                       May 2009
                                                                                                                                                       Mar 2009
  C:DATAMonthEndHpiexporthi_resgv-hpi2.tif


                                                                                                                                                       Jan 2009
                                                                                                                                                       Nov 2008
                                                                                                                                                       Sep 2008
                                                                                                                                                       Jul 2008
                                                                                                                                                       May 2008
                                                                 Jan 2005 HPI = 100


                                                                                                                                                       Mar 2008
                                                                                                                                                       Jan 2008
                                                                                                                                                       Nov 2007
                                                                                                                                                  90
                                                                                      190

                                                                                            180

                                                                                                  170

                                                                                                        160

                                                                                                              150

                                                                                                                    140

                                                                                                                          130

                                                                                                                                120

                                                                                                                                      110

                                                                                                                                            100


                                                                                                                Price Index
11               19      2012                                                                                            MLS® SALES Facts
                                                                                                                                                                                                                                                                                                                            Sound


                                                                                                                             dows
                                                                                                                                                                                                                                                                                                                                owe


                                                                                                                                           er


                                                                                                                      itt Mea
                                                                                                                                                st
                                                                                                                                                                                                            elcarra
                                                                                                                                                                                                                                                                                                      est


                                                                                                                                                                                         m
                                                                                                                                                                                                                                                              ast
                                                                                                                                                                                                                                                                                 ast
                                                                                                                                                                                                                                                                                                                                                    berton


                                                                                                                                                                  uver
                                                                                                                                                                                                                                                                                                                         ouver/H


    November


                                            y
                                                                                              - Gulf
                                                                                                                                                                                                                                           ish


                                                                                                                                          estmin


                                                            lam
                                                                                                               Ridge/P
                                                                                                                                                                                                      oody/B
                                                                                                                                                                                                                              ond
                                                                                                                                                                                                                                                        ine Co


                                                                            South
                                                                                                                                                                                  oquitla
                                                                                                                                                                                                                                                                           uver E
                                                                                                                                                                                                                                                                                               uver W


                                                                                                                                                             Vanco
                                                                                                                                                                                                                                                                                                                                              er/Pem


      2012
                                                                                                                                                                                                                                                                                                                  t Vanc


                                          Burnab
                                                                                                                                                                                                                                                                      Vanco
                                                                                                                                                                                                                                                                                          Vanco
                                                                                                                                                                                                                                                                                                               Wes


                                                     Coquit
                                                                                                         Maple
                                                                                                                                    New W
                                                                                                                                                       North
                                                                                                                                                                           Port C
                                                                                                                                                                                               Port M
                                                                                                                                                                                                                        Richm
                                                                                                                                                                                                                                      Squam
                                                                                                                                                                                                                                                   Sunsh
                                                                                                                                                                                                                                                                                                                                        Whistl


                                                                    Delta -
                                                                                      Islands
                            Detached       49         60             24                 1                 58                        11                  60                  22                  15                       76            13           30                 91                  77                   32                       10                   629
                  Number
                    of      Attached       34         22              4                 0                 16                        15                  25                  16                  15                       50            12           0                  35                  40                    3                       20                   307
  November         Sales    Apartment     102         40             13                 0                 32                        54                  59                  21                  12                       81            7            4                  69                 241                    8                        7                   750
    2012                    Detached    $845,000   $725,000       $633,500             n/a             $475,750                     n/a              $905,000            $499,000               n/a               $1,070,000           n/a       $365,000           $869,000           $1,878,000           $1,432,500                   n/a
                  Median
                  Selling   Attached    $490,000   $434,950          n/a               n/a                n/a                       n/a              $605,000               n/a                 n/a                   $494,750         n/a          n/a             $598,000           $908,500                 n/a                   $512,000                n/a
                   Price    Apartment   $361,000   $273,250          n/a               n/a             $259,950                $278,500              $375,000            $217,000               n/a                   $320,000         n/a          n/a             $339,800           $468,500                 n/a                      n/a
                            Detached       56         68             34                 4                 89                        26                  78                  32                   7                       79            14           46                 93                 104                   51                        9                   790
                  Number
                    of      Attached       58         20              3                 0                 29                         9                  25                  19                  11                       61            4            5                  21                  49                    2                       22                   338
   October         Sales    Apartment     122         52             10                 0                 30                        50                  56                  15                  14                       85            3            5                  70                 264                   12                       15                   803
    2012                    Detached    $860,000   $710,000       $639,000             n/a             $457,000                $610,000              $918,500            $514,000               n/a               $1,038,000           n/a       $356,250           $825,000           $2,182,500           $1,758,000                   n/a
                  Median
                  Selling   Attached    $526,000   $450,000          n/a               n/a             $275,250                     n/a              $615,000               n/a                 n/a                   $507,000         n/a          n/a             $622,000           $843,000                 n/a                   $602,500                n/a
                   Price    Apartment   $377,500   $256,900          n/a               n/a             $202,450                $299,950              $405,000               n/a                 n/a                   $325,000         n/a          n/a             $310,000           $482,450                 n/a                      n/a
                            Detached       84         89             26                 2                 93                        20                  76                  39                  18                      101            20           34                112                 121                   66                       15                   916
                  Number
                    of      Attached       82         32              5                 0                 40                         9                  45                  17                  27                       76            6            3                  30                  48                    8                       16                   444
  November         Sales    Apartment     120         55              8                 0                 38                        63                  80                  23                  23                       95            3            1                 101                 360                   14                       16                  1,000
    2011                    Detached    $895,000   $700,000       $650,000             n/a             $470,900                $712,000              $962,000            $583,000               n/a                   $948,500      $536,000     $369,250           $851,000           $2,155,500           $1,822,500                   n/a
                  Median
                  Selling   Attached    $470,000   $533,000          n/a               n/a             $291,298                     n/a              $671,200               n/a              $426,000                 $530,000         n/a          n/a             $585,000           $778,500                 n/a                      n/a                  n/a
                   Price    Apartment   $355,000   $319,000          n/a               n/a             $248,250                $301,000              $349,858            $220,000            $322,500                 $336,500         n/a          n/a             $320,000           $465,000                 n/a                      n/a
                            Detached      780       1,016           419                32               1,007                       258                888                 368                 178                      932           171          458               1,213               1,194                 580                      100                  9,594
                  Number
                    of      Attached      638        364             62                 1                351                        123                283                 213                 186                      692            92           37                345                 506                   63                      219                  4,175
   Jan. -          Sales    Apartment    1,357       645            120                 0                289                        717                727                 266                 208                     1,047           42           52               1,095               3,261                 151                      144                  10,121
  Nov. 2012                 Detached    $918,000   $735,000       $669,800          $362,500           $478,000                $662,133              $988,900            $542,500            $780,000                 $980,000      $500,000     $397,400           $870,000           $2,072,750           $1,847,500                $966,300
                  Median
                  Selling   Attached    $476,000   $463,750       $450,000             n/a             $292,500                $425,000              $638,000            $383,274            $433,750                 $520,000      $357,627     $275,000           $625,000           $862,500             $1,190,000                $550,000                n/a
Year-to-date       Price    Apartment   $367,000   $283,000       $325,750             n/a             $216,000                $303,650              $376,000            $241,250            $333,500                 $335,000      $259,000     $270,500           $345,000           $480,000             $710,000                  $229,000
                            Detached     1,217      1,255           574                34               1,076                       323               1,138                437                 220                     1,645          176          428               1,724               1,924                1,125                     103                  13,399
                  Number
                    of      Attached      821        502             80                 1                464                        126                369                 221                 228                      972            83           40                396                 702                   60                      154                  5,219
   Jan. -          Sales    Apartment    1,723       670            140                 0                276                        824                833                 276                 261                     1,467           34           51               1,105               4,159                 198                       94                  12,111
  Nov. 2011                 Detached    $898,500   $708,150       $660,000          $595,000           $481,759                $630,000              $923,500            $545,000            $792,500                 $992,500      $485,000     $395,000           $825,000           $2,075,000           $1,795,000                $855,000
                  Median
                  Selling   Attached    $490,000   $455,500       $443,000             n/a             $304,706                $410,750              $639,000            $390,000            $432,500                 $545,000      $355,000     $272,750           $600,000           $865,000             $1,119,500                $567,500                n/a
 Year-to-date      Price    Apartment   $355,000   $292,500       $335,500             n/a             $215,500                $301,500              $365,000            $237,250            $335,000                 $351,000      $232,500     $304,000           $342,700           $485,000             $732,500                  $238,000


Note: Median Selling Prices are not reported for areas with less than 20 sales or for the Gulf Islands
11               19       2012                                                                      MLS® LISTINGS Facts
                                                                                                                                                                                                                                                                                                         Sound


                                                                                                                       dows
                                                                                                                                                                                                                                                                                                             owe


                                                                                                                                      er


                                                                                                                itt Mea
                                                                                                                                           st
                                                                                                                                                                                                  elcarra
                                                                                                                                                                                                                                                                                     est


                                                                                                                                                                                 m
                                                                                                                                                                                                                                                ast
                                                                                                                                                                                                                                                                  ast
                                                                                                                                                                                                                                                                                                                               berton


                                                                                                                                                            uver
                                                                                                                                                                                                                                                                                                      ouver/H


     November


                                            y
                                                                                         - Gulf
                                                                                                                                                                                                                              ish


                                                                                                                                     estmin


                                                           lam
                                                                                                         Ridge/P
                                                                                                                                                                                            oody/B
                                                                                                                                                                                                                   ond
                                                                                                                                                                                                                                          ine Co


                                                                         South
                                                                                                                                                                          oquitla
                                                                                                                                                                                                                                                            uver E
                                                                                                                                                                                                                                                                              uver W


                                                                                                                                                       Vanco
                                                                                                                                                                                                                                                                                                                         er/Pem


       2012
                                                                                                                                                                                                                                                                                               t Vanc


                                          Burnab
                                                    Coquit
                                                                                                   Maple
                                                                                                                                                 North
                                                                                                                                                                   Port C
                                                                                                                                                                                     Port M
                                                                                                                                                                                                             Richm
                                                                                                                                                                                                                         Squam
                                                                                                                                                                                                                                     Sunsh
                                                                                                                                                                                                                                                       Vanco
                                                                                                                                                                                                                                                                         Vanco
                                                                                                                                                                                                                                                                                            Wes


                                                                                                                               New W
                                                                                                                                                                                                                                                                                                                   Whistl


                                                                 Delta -
                                                                                 Islands
                              Detached     99       94            25               9               92                          18                87                 22                19                    139           24         50               111               159                 72                      20                  1,040
                  Number
                     of       Attached     69       35             2               0               48                           7                30                 35                18                     93           12         15                52                67                   5                     20                   508
  November        Listings    Apartment   158       81            13               0               49                          81                81                 32                24                    145           3           5               102               387                 17                      32                  1,210
    2012                      Detached    49%      64%           96%             11%              63%                         61%               69%                100%              79%                    55%          54%        60%               82%               48%                44%                     50%
                 % Sales to
                              Attached    49%      63%           200%            n/a              33%                         214%              83%                46%               83%                    54%          100%        0%               67%               60%                60%                     100%                  n/a
                  Listings
                              Apartment   65%      49%           100%            n/a              65%                         67%               73%                66%               50%                    56%          233%       80%               68%               62%                47%                     22%
                              Detached    136      139            54               7              175                          42               135                 49                37                    210           34         77               215               226                134                      21                  1,691
                  Number
                     of       Attached    100       67            12               0               57                          18                51                 48                20                    122           22          5                70               115                 15                      32                   754
   October        Listings    Apartment   214      127            26               0               45                         125               136                 46                29                    211           18          7               154               667                 40                      33                  1,878
    2012                      Detached    41%      49%           63%             57%              51%                         62%               58%                65%               19%                    38%          41%        60%               43%               46%                38%                     43%
                 % Sales to
                              Attached    58%      30%           25%             n/a              51%                         50%               49%                40%               55%                    50%          18%        100%              30%               43%                13%                     69%                   n/a
                  Listings
                              Apartment   57%      41%           38%             n/a              67%                         40%               41%                33%               48%                    40%          17%        71%               45%               40%                30%                     45%
                              Detached    103      124            26               8              125                          23                74                 38                29                    155           26         59               152               164                 93                      28                  1,227
                  Number
                     of       Attached     80       48             5               1               36                           8                24                 26                22                    104           19          2                43                89                   4                     34                   545
  November        Listings    Apartment   184       99            14               0               75                          77                89                 25                33                    178           7           6               115               496                 18                      34                  1,450
    2011                      Detached    82%      72%           100%            25%              74%                         87%               103%               103%              62%                    65%          77%        58%               74%               74%                71%                     54%
                 % Sales to
                              Attached    103%     67%           100%            0%               111%                        113%              188%               65%               123%                   73%          32%        150%              70%               54%                200%                    47%                   n/a
                  Listings
                              Apartment   65%      56%           57%             n/a              51%                         82%               90%                92%               70%                    53%          43%        17%               88%               73%                78%                     47%
                              Detached    2,108    2,050         775             137              2,229                       474               1,850              705               448                    3,252        450        1,204             2,674             3,502              1,662                   326                  23,846
                  Number
                     of       Attached    1,363    743           120               2              722                         236               631                414               369                    1,633        229        117               742               1,297              166                     378                  9,162
   Jan. -         Listings    Apartment   3,264    1,557         261               0              622                         1,583             1,723              592               520                    2,791        187        120               2,187             7,821              380                     383                  23,991
  Nov. 2012                   Detached    37%      50%           54%             23%              45%                         54%               48%                52%               40%                    29%          38%        38%               45%               34%                35%                     31%
                 % Sales to
                              Attached    47%      49%           52%             50%              49%                         52%               45%                51%               50%                    42%          40%        32%               46%               39%                38%                     58%                   n/a
                  Listings
 Year-to-date*                Apartment   42%      41%           46%             n/a              46%                         45%               42%                45%               40%                    38%          22%        43%               50%               42%                40%                     38%
                              Detached    2,009    2,133         835             154              2,204                       466               1,767              690               455                    3,603        447        1,162             2,824             3,500              1,940                   314                  24,503
                  Number
                     of       Attached    1,361    824           125               4              731                         200               585                378               395                    1,869        198         88               651               1,314              115                     450                  9,288
   Jan. -         Listings    Apartment   3,055    1,463         244              10              640                         1,491             1,663              685               593                    3,008        235        169               2,033             8,084              360                     386                  24,119
  Nov. 2011                   Detached    61%      59%           69%             22%              49%                         69%               64%                63%               48%                    46%          39%        37%               61%               55%                58%                     33%
                 % Sales to
                              Attached    60%      61%           64%             25%              63%                         63%               63%                58%               58%                    52%          42%        45%               61%               53%                52%                     34%                   n/a
                  Listings
 Year-to-date*                Apartment   56%      46%           57%             0%               43%                         55%               50%                40%               44%                    49%          14%        30%               54%               51%                55%                     24%


* Year-to-date listings represent a cumulative total of listings rather than total active listings.
Listing & Sales Activity Summary

                                        Listings                                           Sales
                              1         2       3        Col. 2 & 3     5      6      7     Col. 6 & 7       9           10        Col. 9 & 10
                            Nov        Oct    Nov       Percentage    Nov     Oct   Nov    Percentage    Sep 2011 -   Sep 2012 -   Percentage
                            2011      2012    2012       Variance     2011   2012   2012    Variance     Nov 2011     Nov 2012      Variance


BURNABY                                                      %                                  %                                       %
DETACHED                     103       136      99         -27.2        84     56     49      -12.5          251          143         -43.0
ATTACHED                      80       100      69         -31.0        82     58     34      -41.4          192          129         -32.8
APARTMENTS                   184       214     158         -26.2       120    122    102      -16.4          379          323         -14.8

COQUITLAM
DETACHED                     124       139         94      -32.4        89     68     60      -11.8          280          195         -30.4
ATTACHED                      48        67         35      -47.8        32     20     22       10.0           79           65         -17.7
APARTMENTS                    99       127         81      -36.2        55     52     40      -23.1          167          145         -13.2

DELTA
DETACHED                      26        54         25      -53.7        26     34     24      -29.4           93           87          -6.5
ATTACHED                       5        12          2      -83.3         5      3      4       33.3           18            8         -55.6
APARTMENTS                    14        26         13      -50.0         8     10     13       30.0           31           34           9.7

MAPLE RIDGE/PITT MEADOWS
DETACHED                     125       175         92      -47.4        93     89     58      -34.8          255          215         -15.7
ATTACHED                      36        57         48      -15.8        40     29     16      -44.8          106           58         -45.3
APARTMENTS                    75        45         49        8.9        38     30     32        6.7           78           80           2.6

NORTH VANCOUVER
DETACHED                      74       135         87      -35.6        76     78     60      -23.1          247          182         -26.3
ATTACHED                      24        51         30      -41.2        45     25     25        0.0          105           63         -40.0
APARTMENTS                    89       136         81      -40.4        80     56     59        5.4          214          158         -26.2

NEW WESTMINSTER
DETACHED                      23        42         18      -57.1        20     26     11      -57.7           78           49         -37.2
ATTACHED                       8        18          7      -61.1         9      9     15       66.7           25           30          20.0
APARTMENTS                    77       125         81      -35.2        63     50     54        8.0          198          145         -26.8

PORT MOODY/BELCARRA
DETACHED                      29        37         19      -48.6        18      7     15      114.3           51           32         -37.3
ATTACHED                      22        20         18      -10.0        27     11     15       36.4           67           35         -47.8
APARTMENTS                    33        29         24      -17.2        23     14     12      -14.3           66           37         -43.9

PORT COQUITLAM
DETACHED                      38        49         22      -55.1        39     32     22      -31.3          109           75         -31.2
ATTACHED                      26        48         35      -27.1        17     19     16      -15.8           60           45         -25.0
APARTMENTS                    25        46         32      -30.4        23     15     21       40.0           72           46         -36.1

RICHMOND
DETACHED                     155       210     139         -33.8       101     79     76       -3.8          316          209         -33.9
ATTACHED                     104       122      93         -23.8        76     61     50      -18.0          202          157         -22.3
APARTMENTS                   178       211     145         -31.3        95     85     81       -4.7          293          239         -18.4

SUNSHINE COAST
DETACHED                      59        77         50      -35.1        34     46     30      -34.8          112          106          -5.4
ATTACHED                       2         5         15      200.0         3      5      0     -100.0            9            6         -33.3
APARTMENTS                     6         7          5      -28.6         1      5      4      -20.0           12           16          33.3

SQUAMISH
DETACHED                      26        34         24      -29.4        20     14     13       -7.1           53           37         -30.2
ATTACHED                      19        22         12      -45.5         6      4     12      200.0           18           24          33.3
APARTMENTS                     7        18          3      -83.3         3      3      7      133.3            5           11         120.0

VANCOUVER EAST
DETACHED                     152       215     111         -48.4       112     93     91       -2.2          379          258         -31.9
ATTACHED                      43        70      52         -25.7        30     21     35       66.7           99           75         -24.2
APARTMENTS                   115       154     102         -33.8       101     70     69       -1.4          282          210         -25.5

VANCOUVER WEST
DETACHED                     164       226     159         -29.6       121    104     77      -26.0         345           267         -22.6
ATTACHED                      89       115      67         -41.7        48     49     40      -18.4         145           124         -14.5
APARTMENTS                   496       667     387         -42.0       360    264    241       -8.7        1004           717         -28.6

WHISTLER
DETACHED                      28        21         20       -4.8        15      9     10       11.1           37           26         -29.7
ATTACHED                      34        32         20      -37.5        16     22     20       -9.1           53           65          22.6
APARTMENTS                    34        33         32       -3.0        16     15      7      -53.3           41           36         -12.2

WEST VANCOUVER/HOWE SOUND
DETACHED                      93       134         72      -46.3        66     51     32      -37.3          227          126         -44.5
ATTACHED                       4        15          5      -66.7         8      2      3       50.0           15            7         -53.3
APARTMENTS                    18        40         17      -57.5        14     12      8      -33.3           38           32         -15.8

GRAND TOTALS
DETACHED                    1219     1684    1031        -38.8         914   786    628     -20.1         2833         2007         -29.2
ATTACHED                     544      754     508        -32.6         444   338    307      -9.2         1193          891         -25.3
APARTMENTS                  1450     1878    1210        -35.6        1000   803    750      -6.6         2880         2229         -22.6
Residential Average Sale Prices - January 1977 to November 2012
                                                  DETACHED                  CONDOMINIUM                   ATTACHED                 APARTMENTS
 IN THOUSANDS ($)


1400


                                                                                                                                                                              $1,053,902


1200


1000


800


                                                                                                                                                                                $545,658


600


400
                                                                                                                                                                                $428,825


200


  0
        1977 1978 1979 1980 1981 1982 1983 1984 1985 1986 1987 1988 1989 1990 1991 1992 1993 1994 1995 1996 1997 1998 1999 2000 2001 2002 2003 2004 2005 2006 2007 2008 2009 2010 2011 2012

       NOTE: From 1977 - 1984 condominium averages were not separated into attached & apartment.

Nov 2012 rebgv stats

  • 1.
    News Release GreaterVancouver residential property sale and listing activity below 10-year averages in November Vancouver, B.C. – December 4, 2012 – Over the past six months, the Greater Vancouver housing market has seen a reduction in the number of homes listed for sale, a gradual moderation in home prices and a decrease in property sales compared to historical averages. The Real Estate Board of Greater Vancouver (REBGV) reports that residential property sales of detached, attached and apartment properties reached 1,686 on the region’s Multiple Listing Service® (MLS®) in November, a 28.6 per cent decline compared to the 2,360 sales in November 2011 and a 12.7 per cent decline compared to the 1,931 home sales in October 2012. November sales were 30.3 per cent below the 10-year November sales average of 2,420. “Home sellers appear more inclined to remove their properties from the market today rather than lower prices to sell their properties. On the other hand, buyers appear to be expecting prices to moderate,” Eugen Klein, REBGV president said. New listings for detached, attached and apartment properties in Greater Vancouver totalled 2,758 in November. This represents a 14.4 per cent decline compared to November 2011 when 3,222 properties were listed for sale on the MLS® and a 36.2 per cent decline compared to the 4,323 new listings in October 2012. New listings were 12.9 per cent below the 10-year November average of 3,168. At 15,689, the total number of residential property listings on the MLS® increased 13 per cent from this time last year and declined 9.7 per cent compared to October 2012. Total listings in the region have declined by nearly 3,000 properties since reaching a peak of 18,493 in June. The region’s sales-to-active-listings ratio was unchanged from October at 11 per cent. “Home prices in Greater Vancouver have generally declined between three and five and a half per cent, depending on property type, since reaching a peak six months ago,” Klein said. “Changes in home prices vary per municipality and neighbourhood. It’s good to check local market statistics with your REALTOR®.” Since reaching a peak in May of $625,100, the MLS® Home Price Index composite benchmark price for all residential properties in Greater Vancouver has declined 4.5 per cent to $596,900. This represents a 1.7 per cent decline when we compared to this time last year.
  • 2.
    Sales of detachedproperties in Greater Vancouver reached 629 in November, a decrease of 31.3 per cent from the 916 detached sales recorded in November 2011, and a 40.1 per cent decrease from the 1,050 units sold in November 2010. Since reaching a peak in May, the benchmark price for a detached property in Greater Vancouver has declined 5.5 per cent to $914,500. Sales of apartment properties reached 750 in November 2012, a 25 per cent decrease compared to the 1,000 sales in November 2011, and a decrease of 28.7 per cent compared to the 1,052 sales in November 2010. Since reaching a peak in May, the benchmark price for an apartment property in Greater Vancouver has declined 3.9 per cent to $364,900. Attached property sales in November 2012 totalled 307, a 30.9 per cent decrease compared to the 444 sales in November 2011, and a 24.6 per cent decrease from the 407 attached properties sold in November 2010. Since reaching a peak in April, the benchmark price for an attached property in Greater Vancouver has declined 3.6 per cent to $454,300. Feature Facts: • Of the 15,689 homes currently for sale on the MLS® in Greater Vancouver, 49.6 per cent are listed for $600,000 or less. Of those, 1,321 are detached properties, 5,039 are condominiums and 1,419 are townhomes. • Of the 1,686 homes that sold in Greater Vancouver in November, 273 (16%) sold for $1 million or more. -30- The real estate industry is a key economic driver in British Columbia. In 2011, 32,390 homes changed ownership in the Board's area, generating $1.36 billion in spin-off activity and 9,069 jobs. The total dollar value of residential sales transacted through the MLS® system in Greater Vancouver totalled $25 billion in 2011. The Real Estate Board of Greater Vancouver is an association representing more than 11,000 REALTORS® and their companies. The Board provides a variety of member services, including the Multiple Listing Service®. For more information on real estate, statistics, and buying or selling a home, contact a local REALTOR® or visit www.rebgv.org. For more information please contact: Craig Munn, Assistant Manager of Communication Real Estate Board of Greater Vancouver Phone: (604) 730-3146 cmunn@rebgv.org
  • 3.
    * November 2012 Benchmark Price 1 Month 3 Month 6 Month 1 Year 3 Year 5 Year Property Type Area Price Index Change % Change % Change % Change % Change % Change % Residential / Composite Lower Mainland $538,100 151.9 -0.9% -1.9% -3.6% -0.9% 7.6% 6.6% Greater Vancouver $596,900 156.5 -1.1% -2.1% -4.5% -1.7% 8.6% 9.1% Bowen Island $573,800 124.4 -2.1% -3.7% -8.3% -1.7% -5.9% -8.9% Burnaby East $551,000 152.1 -2.2% -1.9% -4.0% 0.5% 5.8% 6.7% Burnaby North $505,900 151.1 -0.5% -1.2% -4.1% -2.4% 6.0% 6.6% Burnaby South $565,700 159.5 -1.1% -1.2% -3.1% -1.8% 10.8% 12.8% Coquitlam $501,400 148.3 -0.3% -0.8% -2.1% 1.6% 8.0% 5.5% Ladner $514,400 143.1 -2.3% -6.2% -8.2% -4.1% 4.5% 5.1% Maple Ridge $388,700 131.4 -0.8% -0.3% -0.9% -0.2% 0.2% -4.6% New Westminster $358,800 154.0 -1.3% -2.2% -3.6% -1.2% 5.1% 4.1% North Vancouver $639,900 144.8 -1.3% -2.2% -3.6% 1.8% 5.6% 4.5% Pitt Meadows $387,400 140.3 2.0% 2.9% 2.3% 1.2% 3.8% -0.3% Port Coquitlam $396,000 140.6 -0.7% -0.1% -3.2% -1.1% 0.7% -1.5% Port Moody $512,700 141.6 0.3% -0.2% 0.3% 5.9% 4.7% 1.2% Richmond $569,900 165.5 -0.5% -1.3% -4.5% -2.2% 11.1% 17.0% Squamish $385,900 124.6 -1.8% -5.0% -4.5% 3.3% -1.0% -4.2% Sunshine Coast $353,100 123.7 -3.3% -3.6% -4.2% -2.1% -6.4% -9.5% Tsawwassen $589,300 148.5 -1.3% -2.9% -3.9% -0.6% 9.0% 7.3% Vancouver East $605,000 177.0 -0.5% -1.4% -2.2% 1.1% 15.3% 19.6% Vancouver West $789,100 166.3 -0.3% -1.7% -6.1% -3.6% 10.5% 11.5% West Vancouver $1,501,500 161.2 -3.0% -6.2% -9.1% -2.4% 19.8% 11.6% Whistler $453,300 108.0 -2.2% -6.2% -7.8% 0.5% -11.3% -16.4% Single Family Detached Lower Mainland $749,600 159.3 -1.1% -2.3% -3.9% -0.9% 14.8% 14.4% Greater Vancouver $914,500 169.0 -1.4% -2.9% -5.5% -2.3% 17.8% 19.8% Bowen Island $573,800 124.4 -2.1% -3.7% -8.3% -1.7% -5.9% -8.9% Burnaby East $719,100 160.8 -3.1% -4.7% -6.3% 0.6% 11.9% 15.3% Burnaby North $909,800 175.6 -0.6% -0.4% -3.7% 1.3% 21.0% 24.6% Burnaby South $976,600 187.2 -1.2% -2.9% -2.6% 1.5% 29.5% 34.5% Coquitlam $705,000 156.2 -0.4% -1.4% -1.9% 2.6% 14.1% 13.0% Ladner $591,800 142.8 -2.5% -7.2% -9.7% -4.5% 5.5% 5.9% Maple Ridge $459,200 130.5 -1.7% -0.8% -1.4% 1.0% 1.3% -3.1% New Westminster $645,400 160.1 -2.1% -4.1% -6.1% -0.9% 11.8% 15.0% North Vancouver $931,100 148.6 -1.5% -2.6% -5.4% 0.3% 9.6% 8.5% Pitt Meadows $503,100 140.4 0.0% 1.4% -0.1% -0.8% 4.1% 2.4% Port Coquitlam $553,400 147.8 -0.5% -1.1% -1.7% 1.4% 7.9% 7.5% Port Moody $833,300 154.4 -2.3% -1.7% -1.0% 4.7% 13.4% 10.3% Richmond $955,500 192.4 -1.0% -2.0% -6.2% -4.2% 25.5% 34.9% Squamish $483,800 130.7 -2.2% -3.8% -4.0% -2.8% 1.5% 0.8% Sunshine Coast $352,200 123.4 -3.4% -3.4% -4.0% -2.4% -6.5% -9.7% Tsawwassen $712,000 153.3 -1.5% -2.3% -3.6% 1.4% 14.1% 10.8% Vancouver East $835,100 184.4 -0.9% -2.8% -3.2% 0.5% 23.5% 30.0% Vancouver West $2,029,300 208.5 -1.6% -4.1% -9.7% -8.4% 27.8% 33.6% West Vancouver $1,772,800 168.8 -2.8% -6.4% -9.0% -1.1% 24.9% 17.0% Whistler $877,000 121.4 3.8% 4.2% 6.0% -1.6% -3.7% -7.7% HOW TO READ THE TABLE: • Benchmark Price: Estimated sale price of a benchmark property. Benchmarks represent a typical property within each market. • Price Index: Index numbers estimate the percentage change in price on typical and constant quality properties over time. All figures are based on past sales. • x Month/Year Change %: Percentage change of index over a period of x month(s)/year(s) * In January 2005, the indexes are set to 100. Townhome properties are similar to Attached properties, a category that was used in the previous MLSLink HPI, but do not included duplexes. The above info is deemed reliable, but is not guaranteed. All dollar amounts in CDN. * MLS®, Multiple Listing Service®, and all related graphics are trademarks of The Canadian Real Estate Association 1 of 10
  • 4.
    * November 2012 Benchmark Price 1 Month 3 Month 6 Month 1 Year 3 Year 5 Year Property Type Area Price Index Change % Change % Change % Change % Change % Change % Townhouse Lower Mainland $389,500 141.4 -0.1% -1.6% -3.2% -2.0% 3.1% 1.9% Greater Vancouver $454,300 147.4 -0.7% -1.7% -3.3% -2.1% 5.1% 6.0% Burnaby East $414,000 148.5 -0.3% -1.4% -1.7% 1.8% 4.7% 7.0% Burnaby North $385,300 143.7 -0.6% -2.9% -3.2% -8.6% 2.1% 2.0% Burnaby South $415,800 149.2 0.9% -0.1% -2.1% -1.2% 5.8% 8.7% Coquitlam $388,700 142.8 0.2% 1.6% 1.5% 5.1% 5.2% 3.5% Ladner $434,600 144.0 -3.5% -3.3% -5.2% -0.9% 4.0% 3.6% Maple Ridge $270,700 131.5 -0.3% -1.2% -1.6% -3.5% -2.7% -6.9% New Westminster $383,900 144.2 -3.6% -1.4% -3.4% -1.5% 4.5% 5.0% North Vancouver $575,700 137.8 -0.5% -2.4% -4.4% -3.1% 0.8% 3.1% Pitt Meadows $332,100 143.7 3.1% 3.3% 3.4% 3.8% 6.9% 2.6% Port Coquitlam $370,100 140.9 -0.1% 1.6% -2.3% -0.3% 1.4% -0.8% Port Moody $413,400 139.7 0.5% 1.3% 1.6% 2.7% 2.7% -0.9% Richmond $492,500 159.2 -0.6% -2.0% -3.3% -3.3% 10.5% 15.7% Squamish $328,200 119.1 -2.8% -7.5% -7.2% 13.2% -7.1% -5.9% Tsawwassen $447,600 138.4 -3.2% -2.4% -6.0% -6.8% 0.0% -0.4% Vancouver East $499,600 164.7 -0.8% -2.5% -3.7% -3.1% 8.6% 10.4% Vancouver West $679,000 153.6 0.2% -1.4% -4.4% -1.9% 7.9% 10.3% Whistler $443,600 119.5 1.4% -3.8% -7.0% 17.9% 1.4% -3.7% Apartment Lower Mainland $334,600 146.8 -1.0% -1.5% -3.4% -0.5% 0.6% -1.2% Greater Vancouver $364,900 147.5 -1.1% -1.4% -3.9% -1.0% 1.0% 0.1% Burnaby East $357,500 135.7 -2.4% 4.7% -2.9% -1.5% -9.2% -13.1% Burnaby North $327,700 138.5 -0.4% -0.8% -4.2% -2.2% -2.3% -3.1% Burnaby South $367,600 147.6 -1.6% 0.1% -3.7% -4.7% 2.0% 2.4% Coquitlam $251,100 138.2 -0.1% -0.9% -3.9% -1.8% -0.4% -5.3% Ladner $302,100 143.2 -0.6% -6.0% -5.2% -5.0% 1.5% 3.5% Maple Ridge $186,800 136.2 2.1% 2.9% 3.2% 0.4% 0.0% -8.6% New Westminster $267,500 152.9 -0.8% -1.6% -2.6% -1.4% 2.8% 0.8% North Vancouver $349,000 141.7 -1.3% -1.9% -1.0% 5.6% 2.3% -0.1% Pitt Meadows $232,700 137.5 4.5% 5.2% 6.3% 2.7% 1.0% -7.7% Port Coquitlam $220,000 130.4 -1.4% 0.0% -6.1% -5.2% -8.9% -13.6% Port Moody $320,600 133.6 2.5% -0.3% 0.2% 9.2% -0.5% -3.7% Richmond $339,600 144.0 -0.1% -0.2% -3.4% 0.2% -2.8% 0.5% Squamish $241,100 116.0 -0.3% -6.0% -3.4% 16.2% -1.4% -13.6% Tsawwassen $323,500 136.1 -0.4% -5.4% -4.8% -5.2% -3.5% -1.7% Vancouver East $308,300 170.1 -0.1% 0.4% -0.8% 3.1% 6.5% 8.4% Vancouver West $468,400 151.6 0.4% -0.5% -4.1% -1.0% 2.8% 2.3% West Vancouver $590,400 129.0 -3.4% -3.7% -9.1% -8.1% -2.4% -11.4% Whistler $227,000 81.5 -5.5% -8.2% -7.7% -0.5% -33.7% -38.4% HOW TO READ THE TABLE: • Benchmark Price: Estimated sale price of a benchmark property. Benchmarks represent a typical property within each market. • Price Index: Index numbers estimate the percentage change in price on typical and constant quality properties over time. All figures are based on past sales. • x Month/Year Change %: Percentage change of index over a period of x month(s)/year(s) In January 2005, the indexes are set to 100. * Townhome properties are similar to attached properties, a category that was used in the previous MLSLink HPI, but do not included duplexes. Lower Mainland includes areas serviced by both Real Estate Board of Greater Vancouver & Fraser Valley Real Estate Board. The above info is deemed reliable, but is not guaranteed. All dollar amounts in CDN. * MLS®, Multiple Listing Service®, and all related graphics are trademarks of The Canadian Real Estate Association 2 of 10
  • 5.
    Nov 2012 Sep 2012 Jul 2012 May 2012 Mar 2012 Jan 2012 Nov 2011 Sep 2011 Apartment Jul 2011 May 2011 Mar 2011 Jan 2011 Nov 2010 Townhouse Greater Vancouver Sep 2010 5 Year Trend Jul 2010 May 2010 Mar 2010 Detached Jan 2010 Nov 2009 Sep 2009 Jul 2009 Residential May 2009 Mar 2009 C:DATAMonthEndHpiexporthi_resgv-hpi2.tif Jan 2009 Nov 2008 Sep 2008 Jul 2008 May 2008 Jan 2005 HPI = 100 Mar 2008 Jan 2008 Nov 2007 90 190 180 170 160 150 140 130 120 110 100 Price Index
  • 6.
    11 19 2012 MLS® SALES Facts Sound dows owe er itt Mea st elcarra est m ast ast berton uver ouver/H November y - Gulf ish estmin lam Ridge/P oody/B ond ine Co South oquitla uver E uver W Vanco er/Pem 2012 t Vanc Burnab Vanco Vanco Wes Coquit Maple New W North Port C Port M Richm Squam Sunsh Whistl Delta - Islands Detached 49 60 24 1 58 11 60 22 15 76 13 30 91 77 32 10 629 Number of Attached 34 22 4 0 16 15 25 16 15 50 12 0 35 40 3 20 307 November Sales Apartment 102 40 13 0 32 54 59 21 12 81 7 4 69 241 8 7 750 2012 Detached $845,000 $725,000 $633,500 n/a $475,750 n/a $905,000 $499,000 n/a $1,070,000 n/a $365,000 $869,000 $1,878,000 $1,432,500 n/a Median Selling Attached $490,000 $434,950 n/a n/a n/a n/a $605,000 n/a n/a $494,750 n/a n/a $598,000 $908,500 n/a $512,000 n/a Price Apartment $361,000 $273,250 n/a n/a $259,950 $278,500 $375,000 $217,000 n/a $320,000 n/a n/a $339,800 $468,500 n/a n/a Detached 56 68 34 4 89 26 78 32 7 79 14 46 93 104 51 9 790 Number of Attached 58 20 3 0 29 9 25 19 11 61 4 5 21 49 2 22 338 October Sales Apartment 122 52 10 0 30 50 56 15 14 85 3 5 70 264 12 15 803 2012 Detached $860,000 $710,000 $639,000 n/a $457,000 $610,000 $918,500 $514,000 n/a $1,038,000 n/a $356,250 $825,000 $2,182,500 $1,758,000 n/a Median Selling Attached $526,000 $450,000 n/a n/a $275,250 n/a $615,000 n/a n/a $507,000 n/a n/a $622,000 $843,000 n/a $602,500 n/a Price Apartment $377,500 $256,900 n/a n/a $202,450 $299,950 $405,000 n/a n/a $325,000 n/a n/a $310,000 $482,450 n/a n/a Detached 84 89 26 2 93 20 76 39 18 101 20 34 112 121 66 15 916 Number of Attached 82 32 5 0 40 9 45 17 27 76 6 3 30 48 8 16 444 November Sales Apartment 120 55 8 0 38 63 80 23 23 95 3 1 101 360 14 16 1,000 2011 Detached $895,000 $700,000 $650,000 n/a $470,900 $712,000 $962,000 $583,000 n/a $948,500 $536,000 $369,250 $851,000 $2,155,500 $1,822,500 n/a Median Selling Attached $470,000 $533,000 n/a n/a $291,298 n/a $671,200 n/a $426,000 $530,000 n/a n/a $585,000 $778,500 n/a n/a n/a Price Apartment $355,000 $319,000 n/a n/a $248,250 $301,000 $349,858 $220,000 $322,500 $336,500 n/a n/a $320,000 $465,000 n/a n/a Detached 780 1,016 419 32 1,007 258 888 368 178 932 171 458 1,213 1,194 580 100 9,594 Number of Attached 638 364 62 1 351 123 283 213 186 692 92 37 345 506 63 219 4,175 Jan. - Sales Apartment 1,357 645 120 0 289 717 727 266 208 1,047 42 52 1,095 3,261 151 144 10,121 Nov. 2012 Detached $918,000 $735,000 $669,800 $362,500 $478,000 $662,133 $988,900 $542,500 $780,000 $980,000 $500,000 $397,400 $870,000 $2,072,750 $1,847,500 $966,300 Median Selling Attached $476,000 $463,750 $450,000 n/a $292,500 $425,000 $638,000 $383,274 $433,750 $520,000 $357,627 $275,000 $625,000 $862,500 $1,190,000 $550,000 n/a Year-to-date Price Apartment $367,000 $283,000 $325,750 n/a $216,000 $303,650 $376,000 $241,250 $333,500 $335,000 $259,000 $270,500 $345,000 $480,000 $710,000 $229,000 Detached 1,217 1,255 574 34 1,076 323 1,138 437 220 1,645 176 428 1,724 1,924 1,125 103 13,399 Number of Attached 821 502 80 1 464 126 369 221 228 972 83 40 396 702 60 154 5,219 Jan. - Sales Apartment 1,723 670 140 0 276 824 833 276 261 1,467 34 51 1,105 4,159 198 94 12,111 Nov. 2011 Detached $898,500 $708,150 $660,000 $595,000 $481,759 $630,000 $923,500 $545,000 $792,500 $992,500 $485,000 $395,000 $825,000 $2,075,000 $1,795,000 $855,000 Median Selling Attached $490,000 $455,500 $443,000 n/a $304,706 $410,750 $639,000 $390,000 $432,500 $545,000 $355,000 $272,750 $600,000 $865,000 $1,119,500 $567,500 n/a Year-to-date Price Apartment $355,000 $292,500 $335,500 n/a $215,500 $301,500 $365,000 $237,250 $335,000 $351,000 $232,500 $304,000 $342,700 $485,000 $732,500 $238,000 Note: Median Selling Prices are not reported for areas with less than 20 sales or for the Gulf Islands
  • 7.
    11 19 2012 MLS® LISTINGS Facts Sound dows owe er itt Mea st elcarra est m ast ast berton uver ouver/H November y - Gulf ish estmin lam Ridge/P oody/B ond ine Co South oquitla uver E uver W Vanco er/Pem 2012 t Vanc Burnab Coquit Maple North Port C Port M Richm Squam Sunsh Vanco Vanco Wes New W Whistl Delta - Islands Detached 99 94 25 9 92 18 87 22 19 139 24 50 111 159 72 20 1,040 Number of Attached 69 35 2 0 48 7 30 35 18 93 12 15 52 67 5 20 508 November Listings Apartment 158 81 13 0 49 81 81 32 24 145 3 5 102 387 17 32 1,210 2012 Detached 49% 64% 96% 11% 63% 61% 69% 100% 79% 55% 54% 60% 82% 48% 44% 50% % Sales to Attached 49% 63% 200% n/a 33% 214% 83% 46% 83% 54% 100% 0% 67% 60% 60% 100% n/a Listings Apartment 65% 49% 100% n/a 65% 67% 73% 66% 50% 56% 233% 80% 68% 62% 47% 22% Detached 136 139 54 7 175 42 135 49 37 210 34 77 215 226 134 21 1,691 Number of Attached 100 67 12 0 57 18 51 48 20 122 22 5 70 115 15 32 754 October Listings Apartment 214 127 26 0 45 125 136 46 29 211 18 7 154 667 40 33 1,878 2012 Detached 41% 49% 63% 57% 51% 62% 58% 65% 19% 38% 41% 60% 43% 46% 38% 43% % Sales to Attached 58% 30% 25% n/a 51% 50% 49% 40% 55% 50% 18% 100% 30% 43% 13% 69% n/a Listings Apartment 57% 41% 38% n/a 67% 40% 41% 33% 48% 40% 17% 71% 45% 40% 30% 45% Detached 103 124 26 8 125 23 74 38 29 155 26 59 152 164 93 28 1,227 Number of Attached 80 48 5 1 36 8 24 26 22 104 19 2 43 89 4 34 545 November Listings Apartment 184 99 14 0 75 77 89 25 33 178 7 6 115 496 18 34 1,450 2011 Detached 82% 72% 100% 25% 74% 87% 103% 103% 62% 65% 77% 58% 74% 74% 71% 54% % Sales to Attached 103% 67% 100% 0% 111% 113% 188% 65% 123% 73% 32% 150% 70% 54% 200% 47% n/a Listings Apartment 65% 56% 57% n/a 51% 82% 90% 92% 70% 53% 43% 17% 88% 73% 78% 47% Detached 2,108 2,050 775 137 2,229 474 1,850 705 448 3,252 450 1,204 2,674 3,502 1,662 326 23,846 Number of Attached 1,363 743 120 2 722 236 631 414 369 1,633 229 117 742 1,297 166 378 9,162 Jan. - Listings Apartment 3,264 1,557 261 0 622 1,583 1,723 592 520 2,791 187 120 2,187 7,821 380 383 23,991 Nov. 2012 Detached 37% 50% 54% 23% 45% 54% 48% 52% 40% 29% 38% 38% 45% 34% 35% 31% % Sales to Attached 47% 49% 52% 50% 49% 52% 45% 51% 50% 42% 40% 32% 46% 39% 38% 58% n/a Listings Year-to-date* Apartment 42% 41% 46% n/a 46% 45% 42% 45% 40% 38% 22% 43% 50% 42% 40% 38% Detached 2,009 2,133 835 154 2,204 466 1,767 690 455 3,603 447 1,162 2,824 3,500 1,940 314 24,503 Number of Attached 1,361 824 125 4 731 200 585 378 395 1,869 198 88 651 1,314 115 450 9,288 Jan. - Listings Apartment 3,055 1,463 244 10 640 1,491 1,663 685 593 3,008 235 169 2,033 8,084 360 386 24,119 Nov. 2011 Detached 61% 59% 69% 22% 49% 69% 64% 63% 48% 46% 39% 37% 61% 55% 58% 33% % Sales to Attached 60% 61% 64% 25% 63% 63% 63% 58% 58% 52% 42% 45% 61% 53% 52% 34% n/a Listings Year-to-date* Apartment 56% 46% 57% 0% 43% 55% 50% 40% 44% 49% 14% 30% 54% 51% 55% 24% * Year-to-date listings represent a cumulative total of listings rather than total active listings.
  • 8.
    Listing & SalesActivity Summary Listings Sales 1 2 3 Col. 2 & 3 5 6 7 Col. 6 & 7 9 10 Col. 9 & 10 Nov Oct Nov Percentage Nov Oct Nov Percentage Sep 2011 - Sep 2012 - Percentage 2011 2012 2012 Variance 2011 2012 2012 Variance Nov 2011 Nov 2012 Variance BURNABY % % % DETACHED 103 136 99 -27.2 84 56 49 -12.5 251 143 -43.0 ATTACHED 80 100 69 -31.0 82 58 34 -41.4 192 129 -32.8 APARTMENTS 184 214 158 -26.2 120 122 102 -16.4 379 323 -14.8 COQUITLAM DETACHED 124 139 94 -32.4 89 68 60 -11.8 280 195 -30.4 ATTACHED 48 67 35 -47.8 32 20 22 10.0 79 65 -17.7 APARTMENTS 99 127 81 -36.2 55 52 40 -23.1 167 145 -13.2 DELTA DETACHED 26 54 25 -53.7 26 34 24 -29.4 93 87 -6.5 ATTACHED 5 12 2 -83.3 5 3 4 33.3 18 8 -55.6 APARTMENTS 14 26 13 -50.0 8 10 13 30.0 31 34 9.7 MAPLE RIDGE/PITT MEADOWS DETACHED 125 175 92 -47.4 93 89 58 -34.8 255 215 -15.7 ATTACHED 36 57 48 -15.8 40 29 16 -44.8 106 58 -45.3 APARTMENTS 75 45 49 8.9 38 30 32 6.7 78 80 2.6 NORTH VANCOUVER DETACHED 74 135 87 -35.6 76 78 60 -23.1 247 182 -26.3 ATTACHED 24 51 30 -41.2 45 25 25 0.0 105 63 -40.0 APARTMENTS 89 136 81 -40.4 80 56 59 5.4 214 158 -26.2 NEW WESTMINSTER DETACHED 23 42 18 -57.1 20 26 11 -57.7 78 49 -37.2 ATTACHED 8 18 7 -61.1 9 9 15 66.7 25 30 20.0 APARTMENTS 77 125 81 -35.2 63 50 54 8.0 198 145 -26.8 PORT MOODY/BELCARRA DETACHED 29 37 19 -48.6 18 7 15 114.3 51 32 -37.3 ATTACHED 22 20 18 -10.0 27 11 15 36.4 67 35 -47.8 APARTMENTS 33 29 24 -17.2 23 14 12 -14.3 66 37 -43.9 PORT COQUITLAM DETACHED 38 49 22 -55.1 39 32 22 -31.3 109 75 -31.2 ATTACHED 26 48 35 -27.1 17 19 16 -15.8 60 45 -25.0 APARTMENTS 25 46 32 -30.4 23 15 21 40.0 72 46 -36.1 RICHMOND DETACHED 155 210 139 -33.8 101 79 76 -3.8 316 209 -33.9 ATTACHED 104 122 93 -23.8 76 61 50 -18.0 202 157 -22.3 APARTMENTS 178 211 145 -31.3 95 85 81 -4.7 293 239 -18.4 SUNSHINE COAST DETACHED 59 77 50 -35.1 34 46 30 -34.8 112 106 -5.4 ATTACHED 2 5 15 200.0 3 5 0 -100.0 9 6 -33.3 APARTMENTS 6 7 5 -28.6 1 5 4 -20.0 12 16 33.3 SQUAMISH DETACHED 26 34 24 -29.4 20 14 13 -7.1 53 37 -30.2 ATTACHED 19 22 12 -45.5 6 4 12 200.0 18 24 33.3 APARTMENTS 7 18 3 -83.3 3 3 7 133.3 5 11 120.0 VANCOUVER EAST DETACHED 152 215 111 -48.4 112 93 91 -2.2 379 258 -31.9 ATTACHED 43 70 52 -25.7 30 21 35 66.7 99 75 -24.2 APARTMENTS 115 154 102 -33.8 101 70 69 -1.4 282 210 -25.5 VANCOUVER WEST DETACHED 164 226 159 -29.6 121 104 77 -26.0 345 267 -22.6 ATTACHED 89 115 67 -41.7 48 49 40 -18.4 145 124 -14.5 APARTMENTS 496 667 387 -42.0 360 264 241 -8.7 1004 717 -28.6 WHISTLER DETACHED 28 21 20 -4.8 15 9 10 11.1 37 26 -29.7 ATTACHED 34 32 20 -37.5 16 22 20 -9.1 53 65 22.6 APARTMENTS 34 33 32 -3.0 16 15 7 -53.3 41 36 -12.2 WEST VANCOUVER/HOWE SOUND DETACHED 93 134 72 -46.3 66 51 32 -37.3 227 126 -44.5 ATTACHED 4 15 5 -66.7 8 2 3 50.0 15 7 -53.3 APARTMENTS 18 40 17 -57.5 14 12 8 -33.3 38 32 -15.8 GRAND TOTALS DETACHED 1219 1684 1031 -38.8 914 786 628 -20.1 2833 2007 -29.2 ATTACHED 544 754 508 -32.6 444 338 307 -9.2 1193 891 -25.3 APARTMENTS 1450 1878 1210 -35.6 1000 803 750 -6.6 2880 2229 -22.6
  • 9.
    Residential Average SalePrices - January 1977 to November 2012 DETACHED CONDOMINIUM ATTACHED APARTMENTS IN THOUSANDS ($) 1400 $1,053,902 1200 1000 800 $545,658 600 400 $428,825 200 0 1977 1978 1979 1980 1981 1982 1983 1984 1985 1986 1987 1988 1989 1990 1991 1992 1993 1994 1995 1996 1997 1998 1999 2000 2001 2002 2003 2004 2005 2006 2007 2008 2009 2010 2011 2012 NOTE: From 1977 - 1984 condominium averages were not separated into attached & apartment.