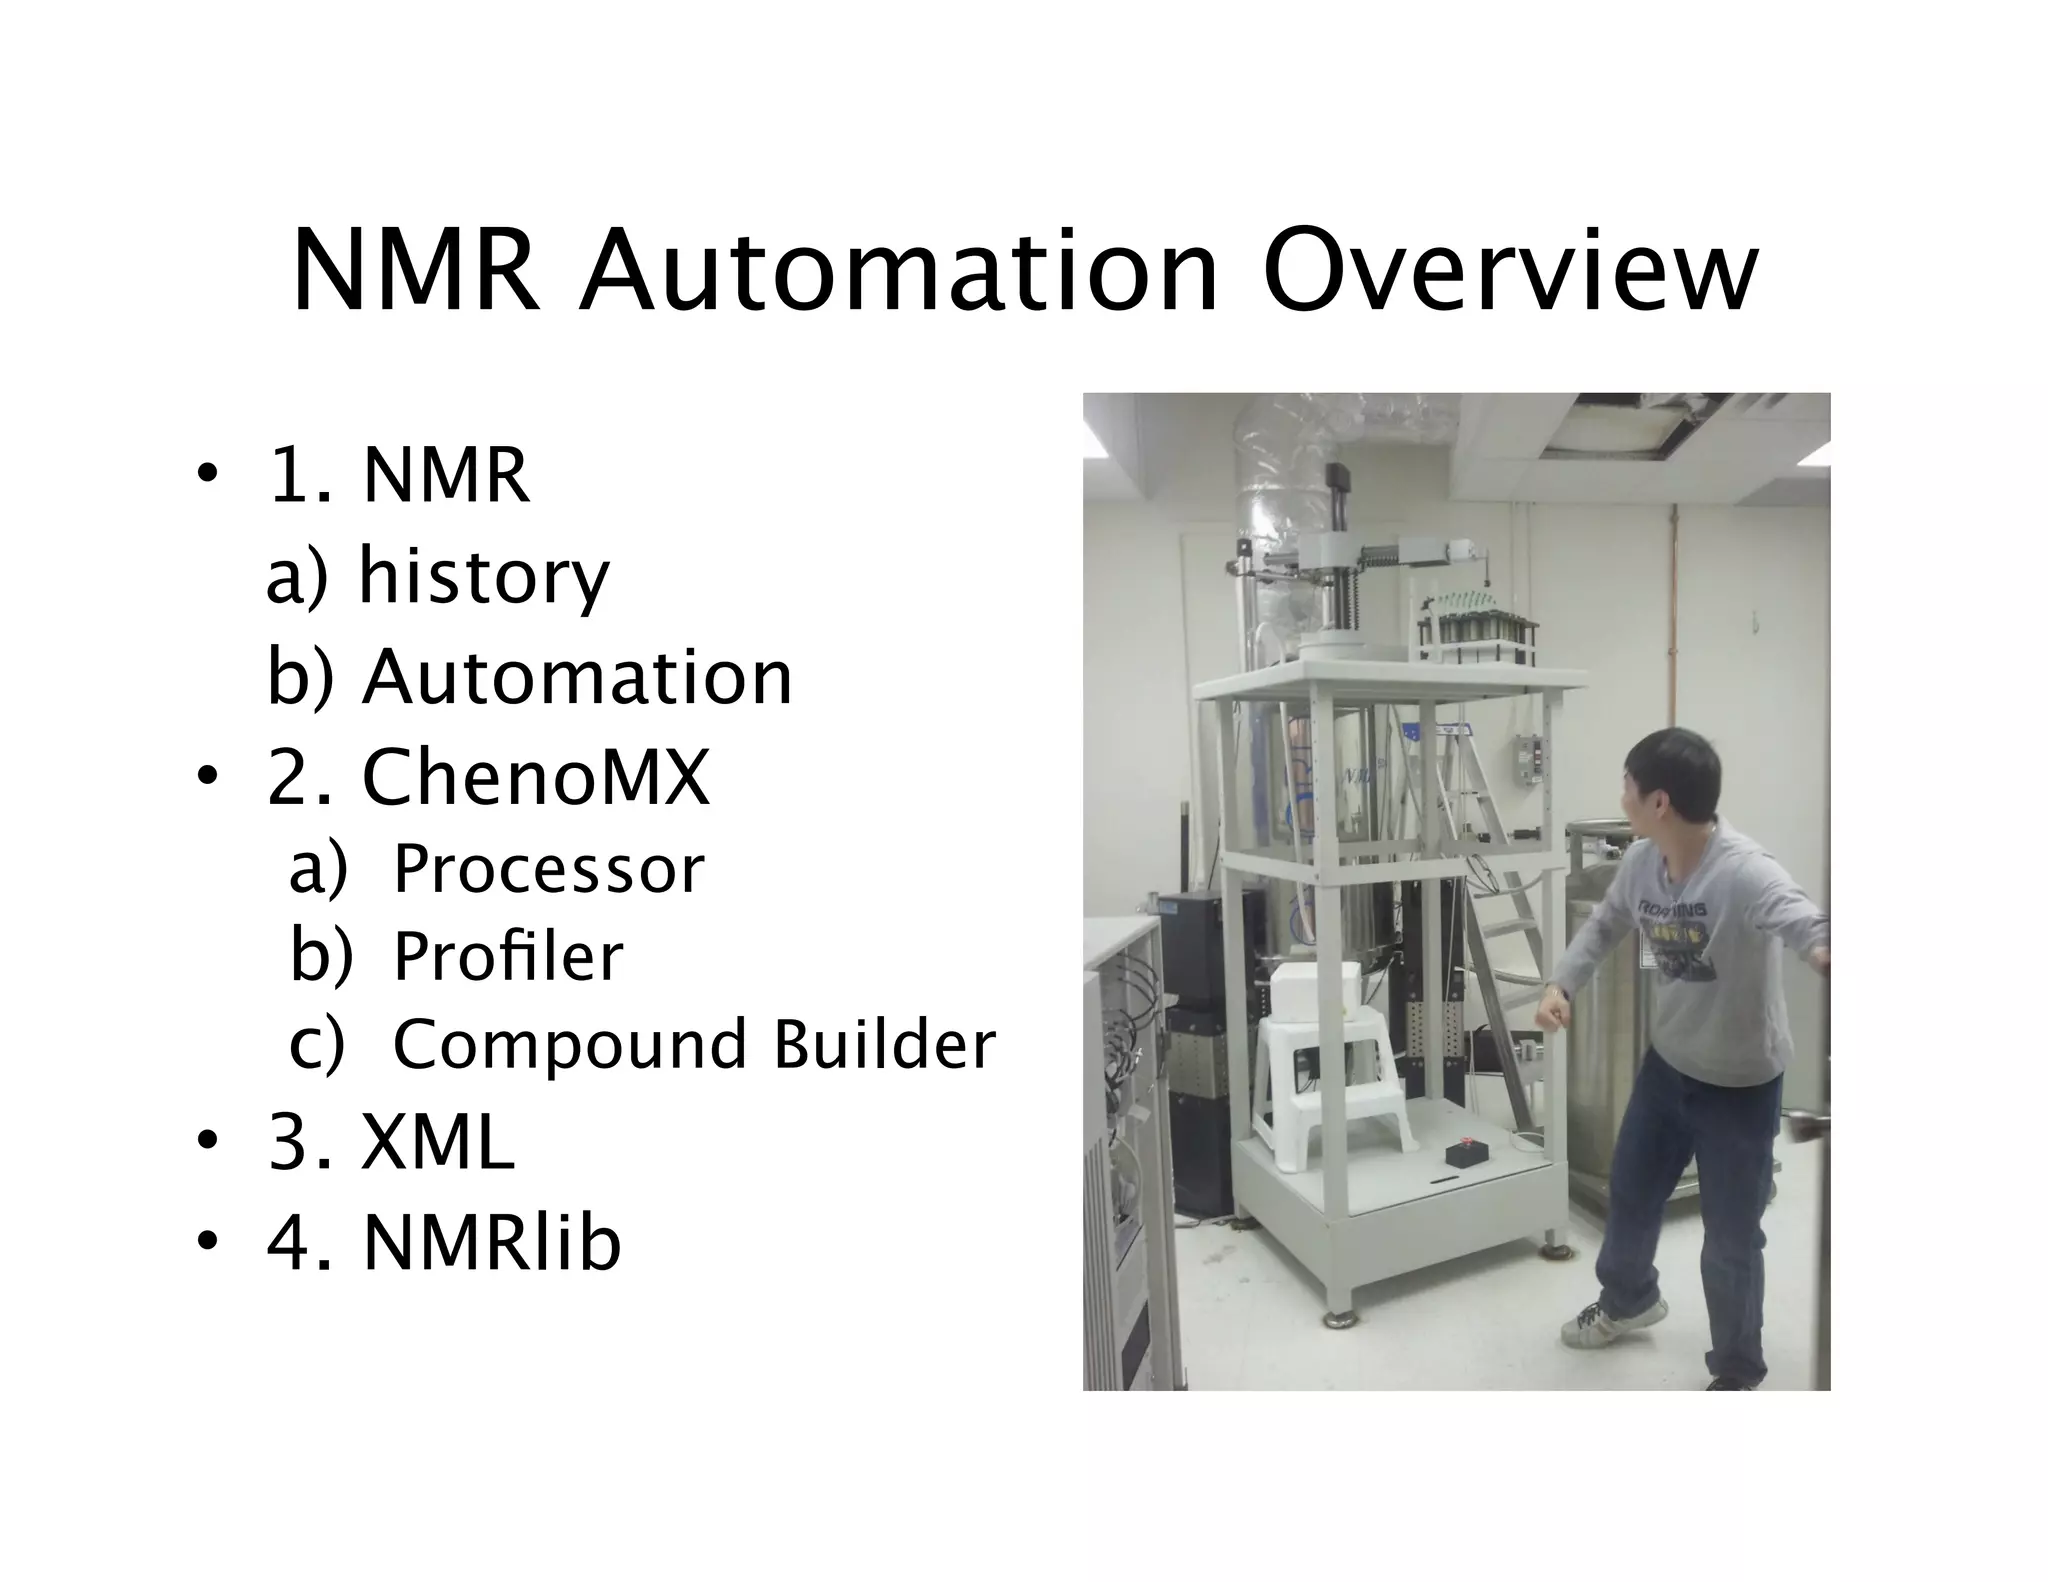
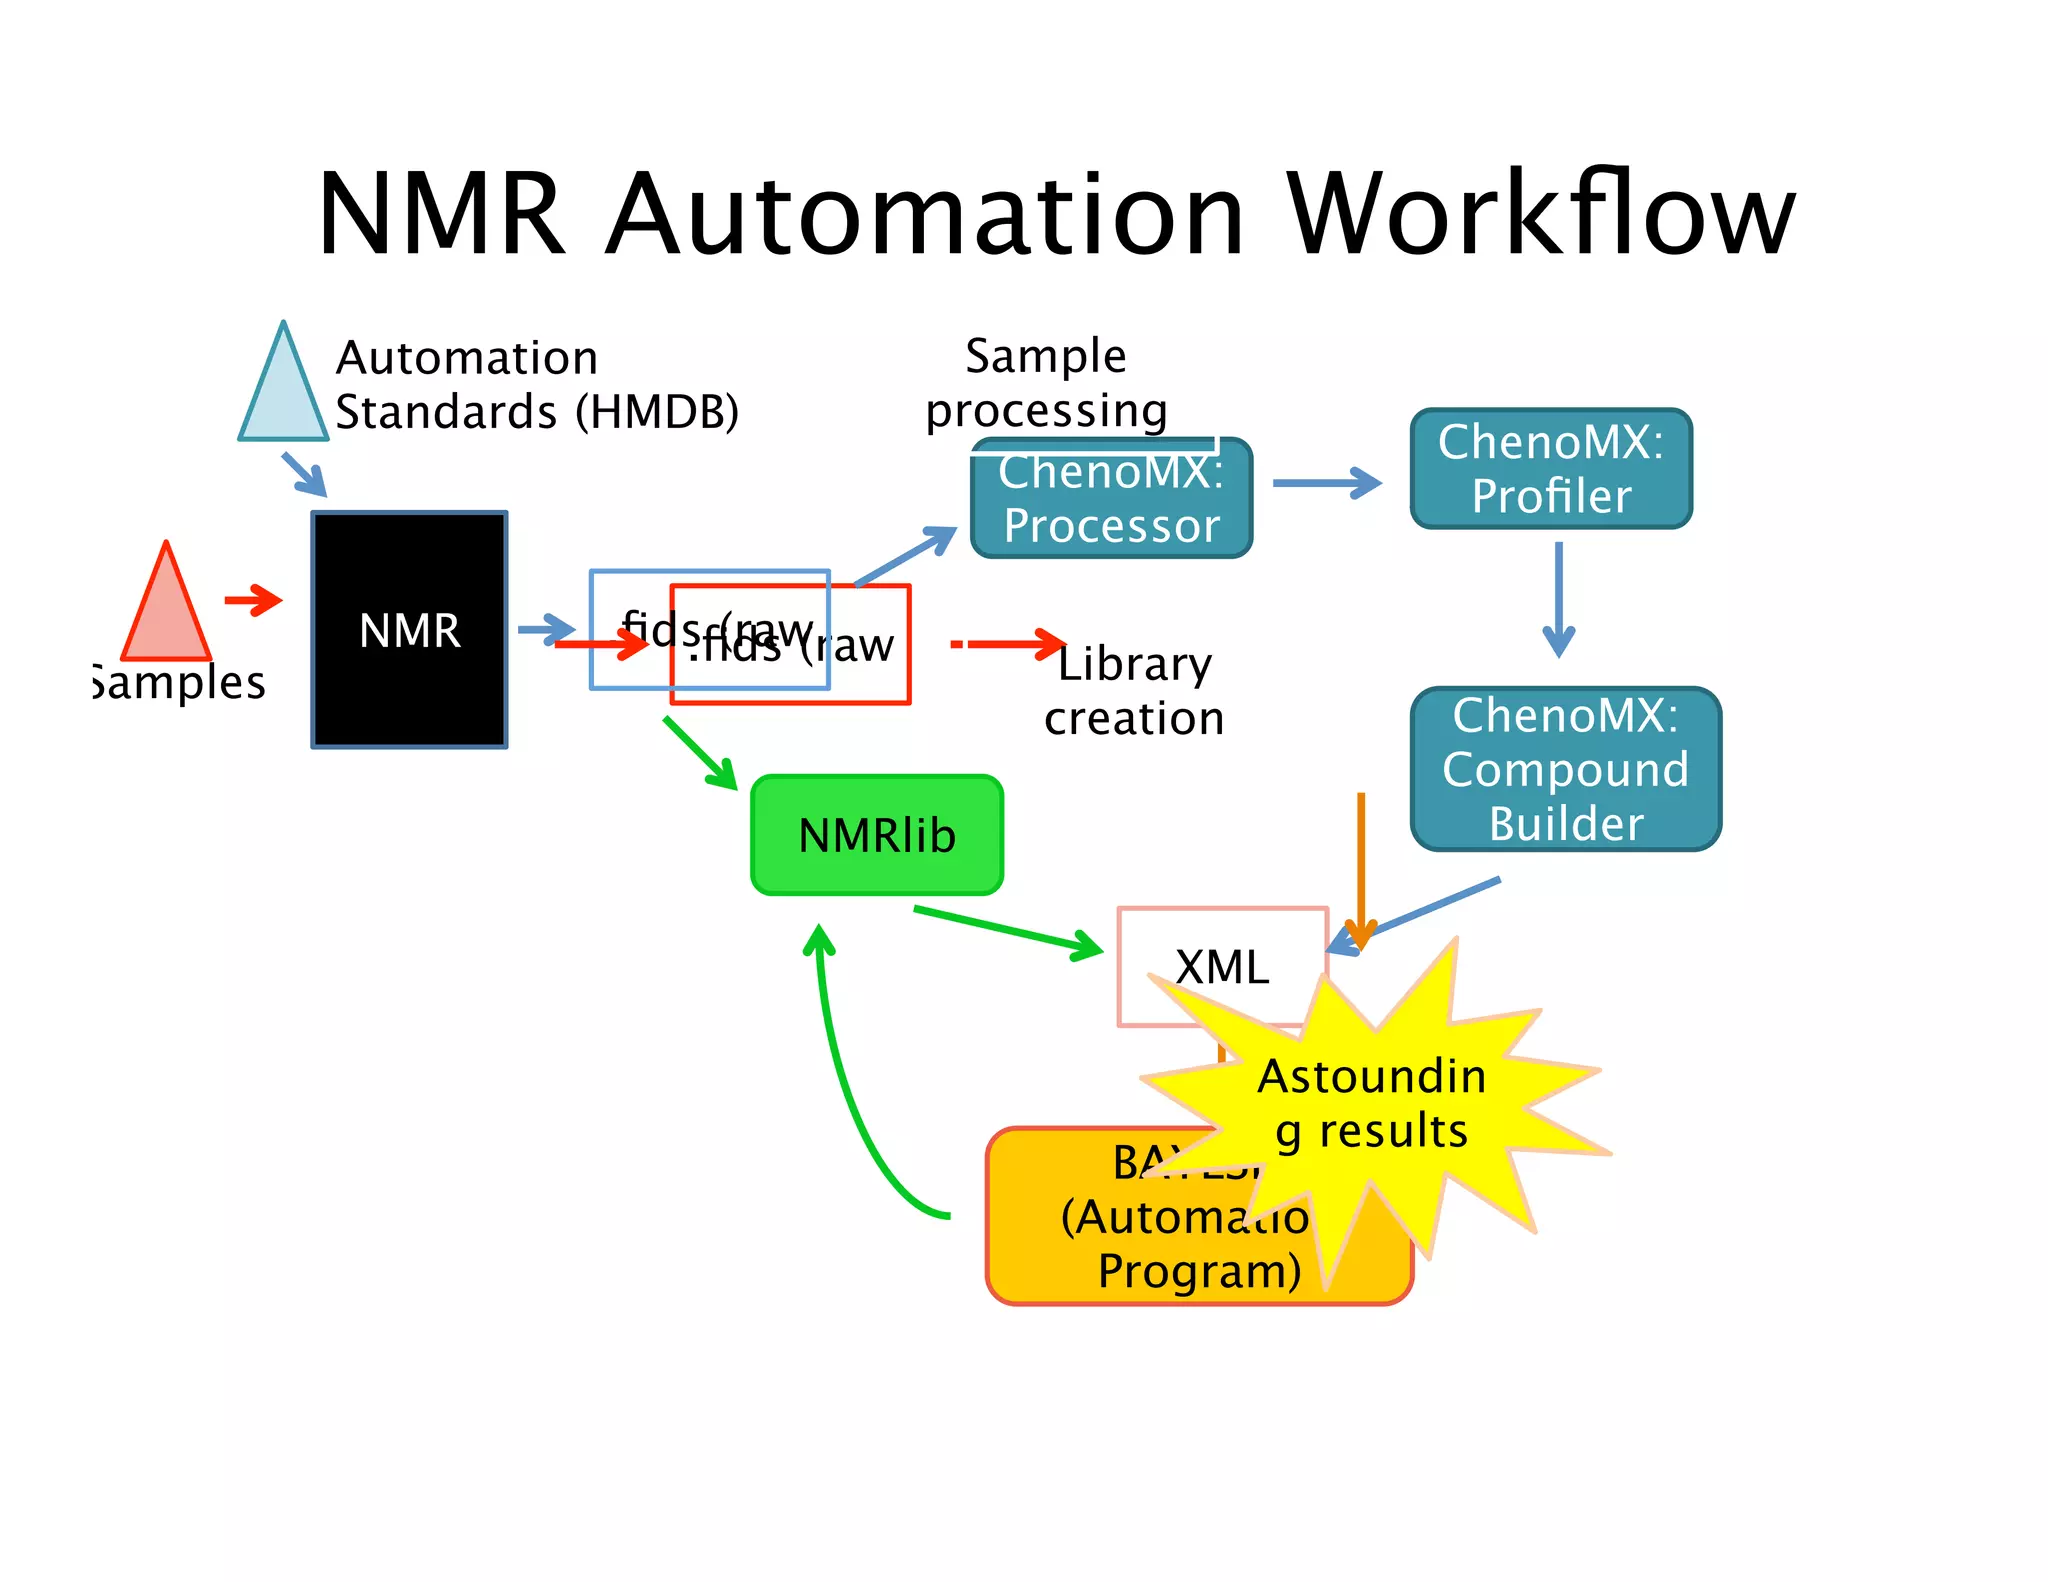
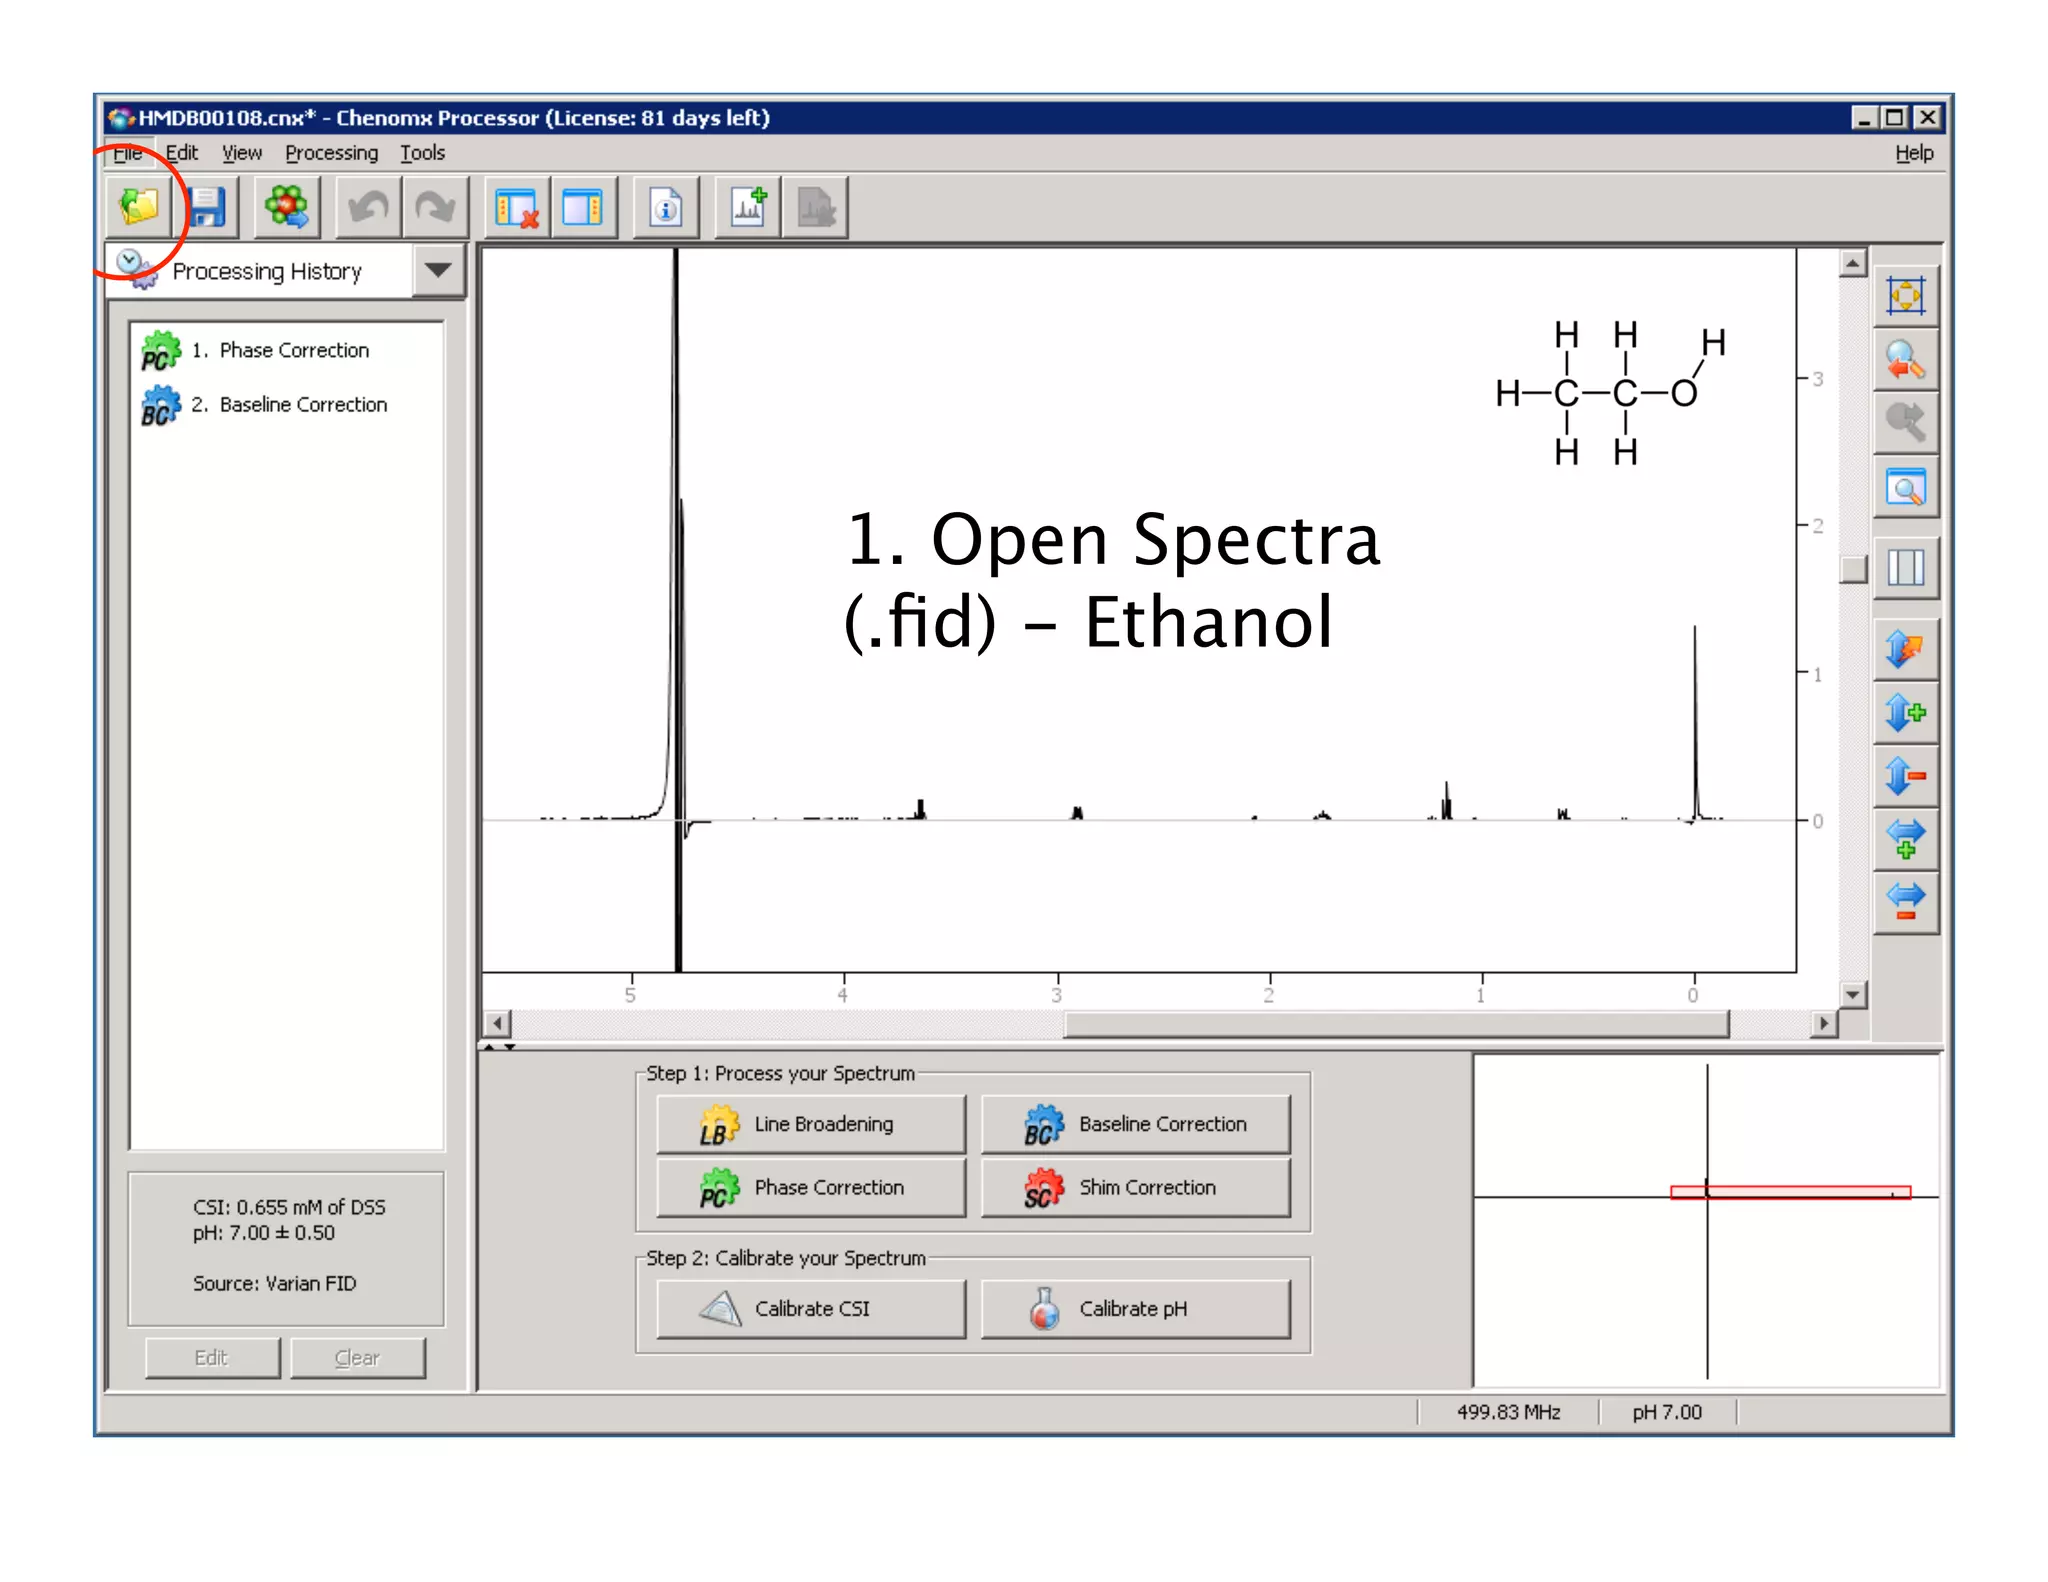
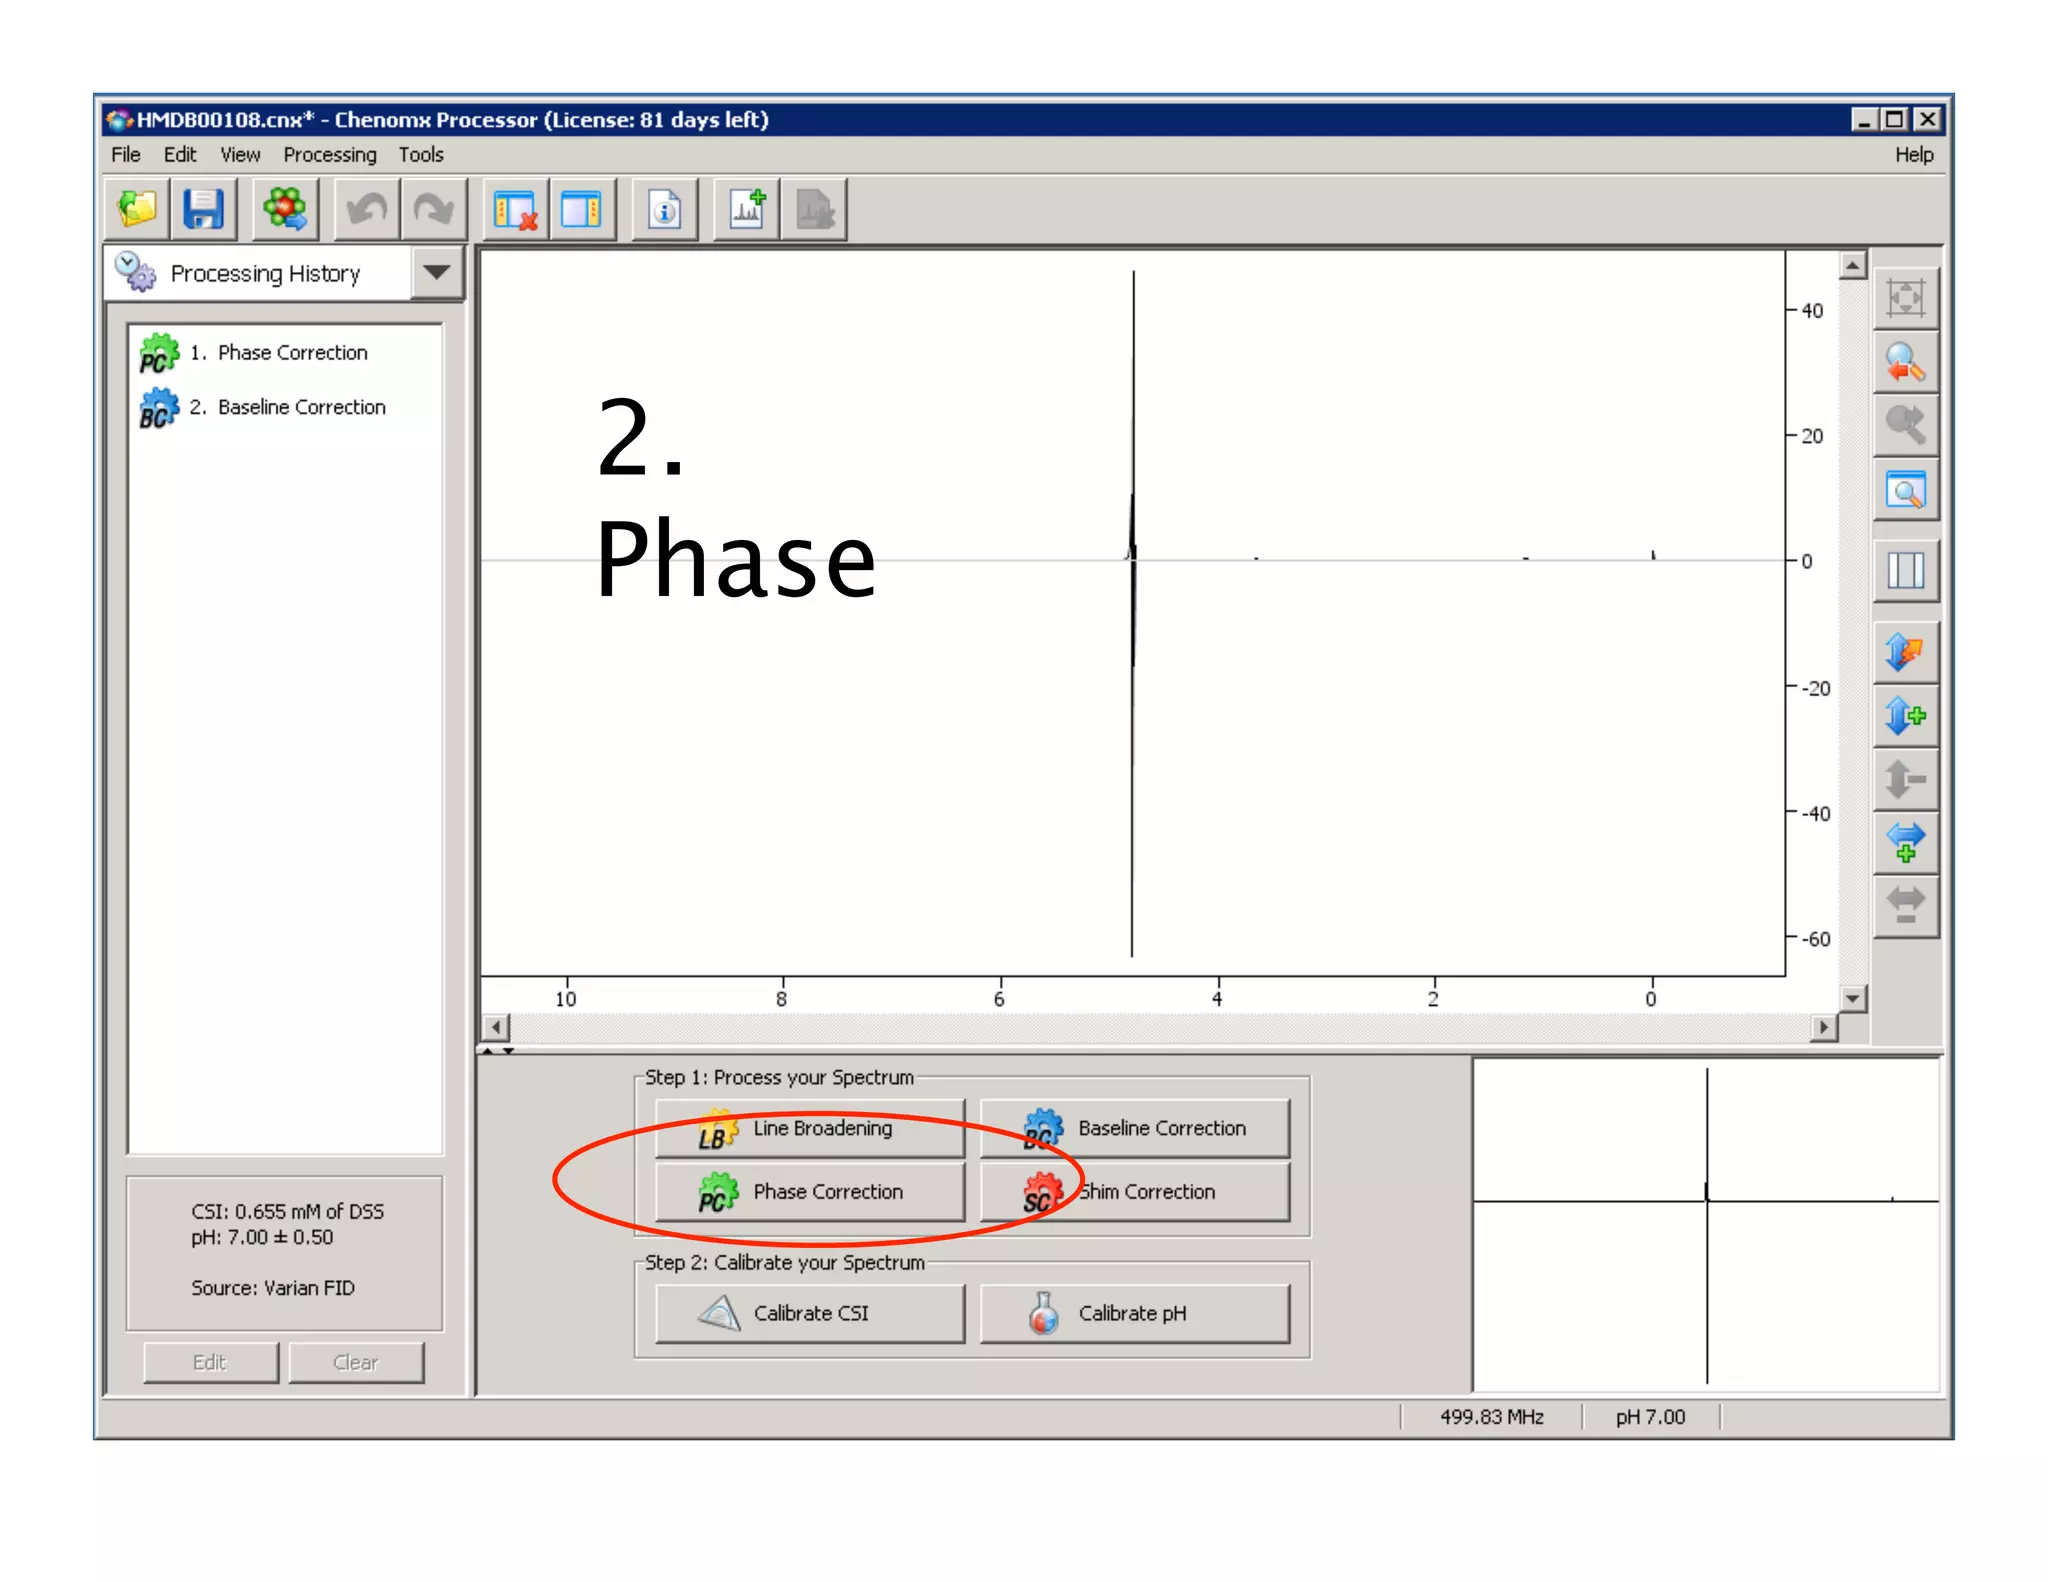
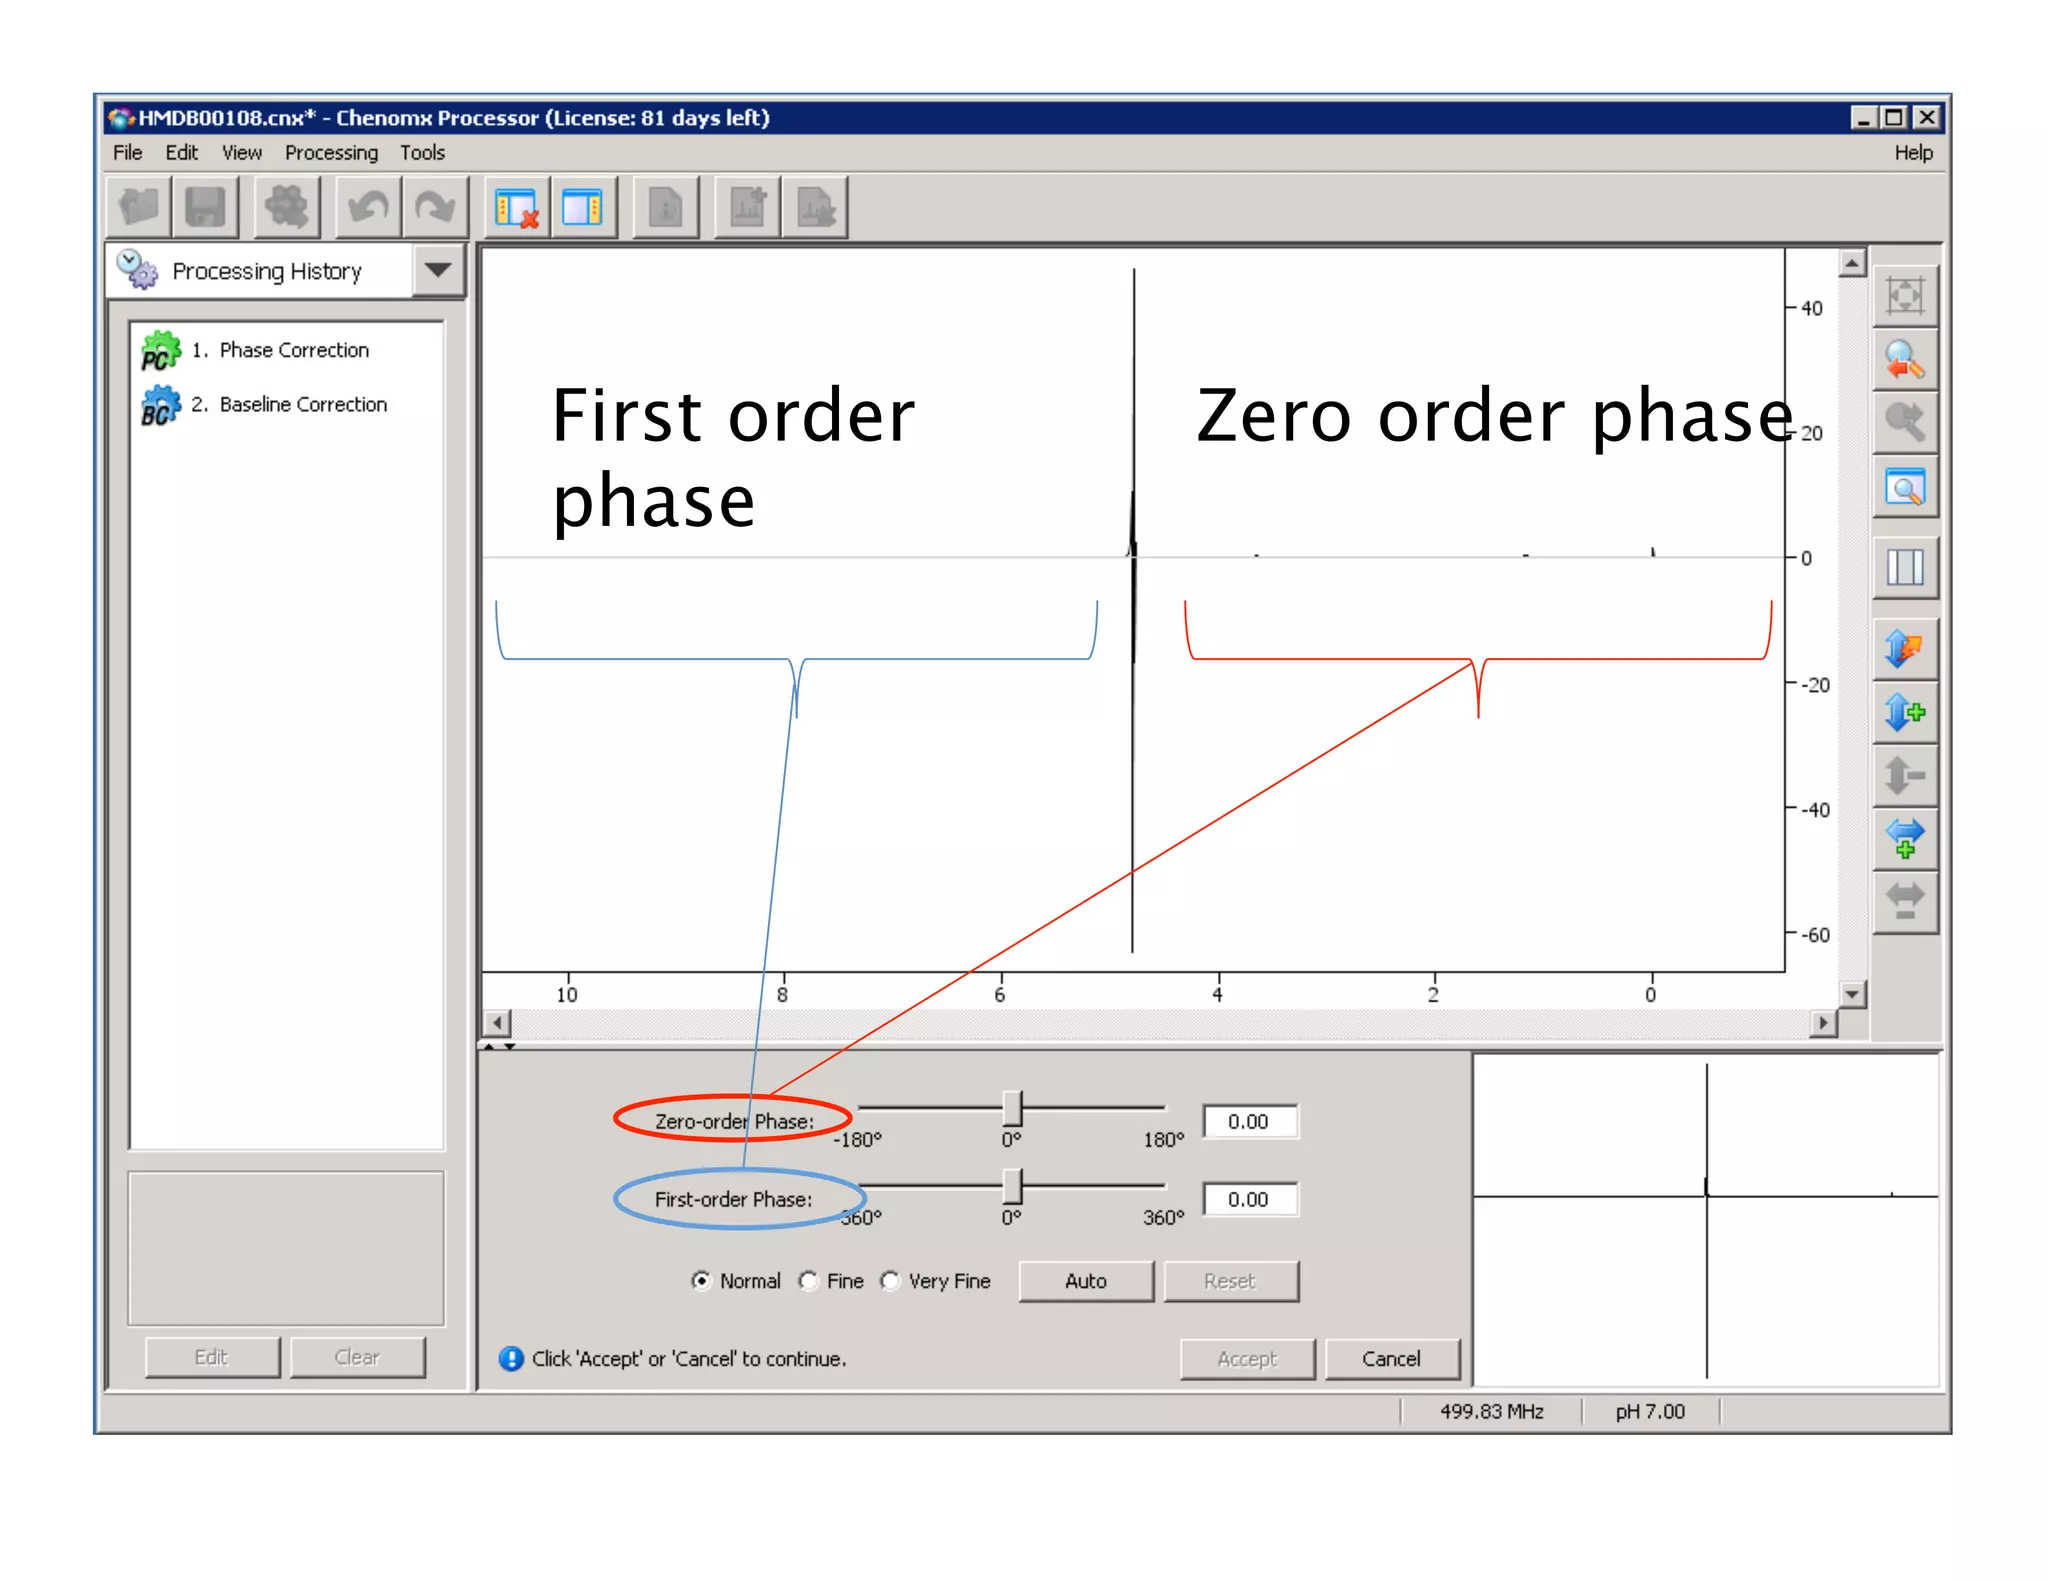
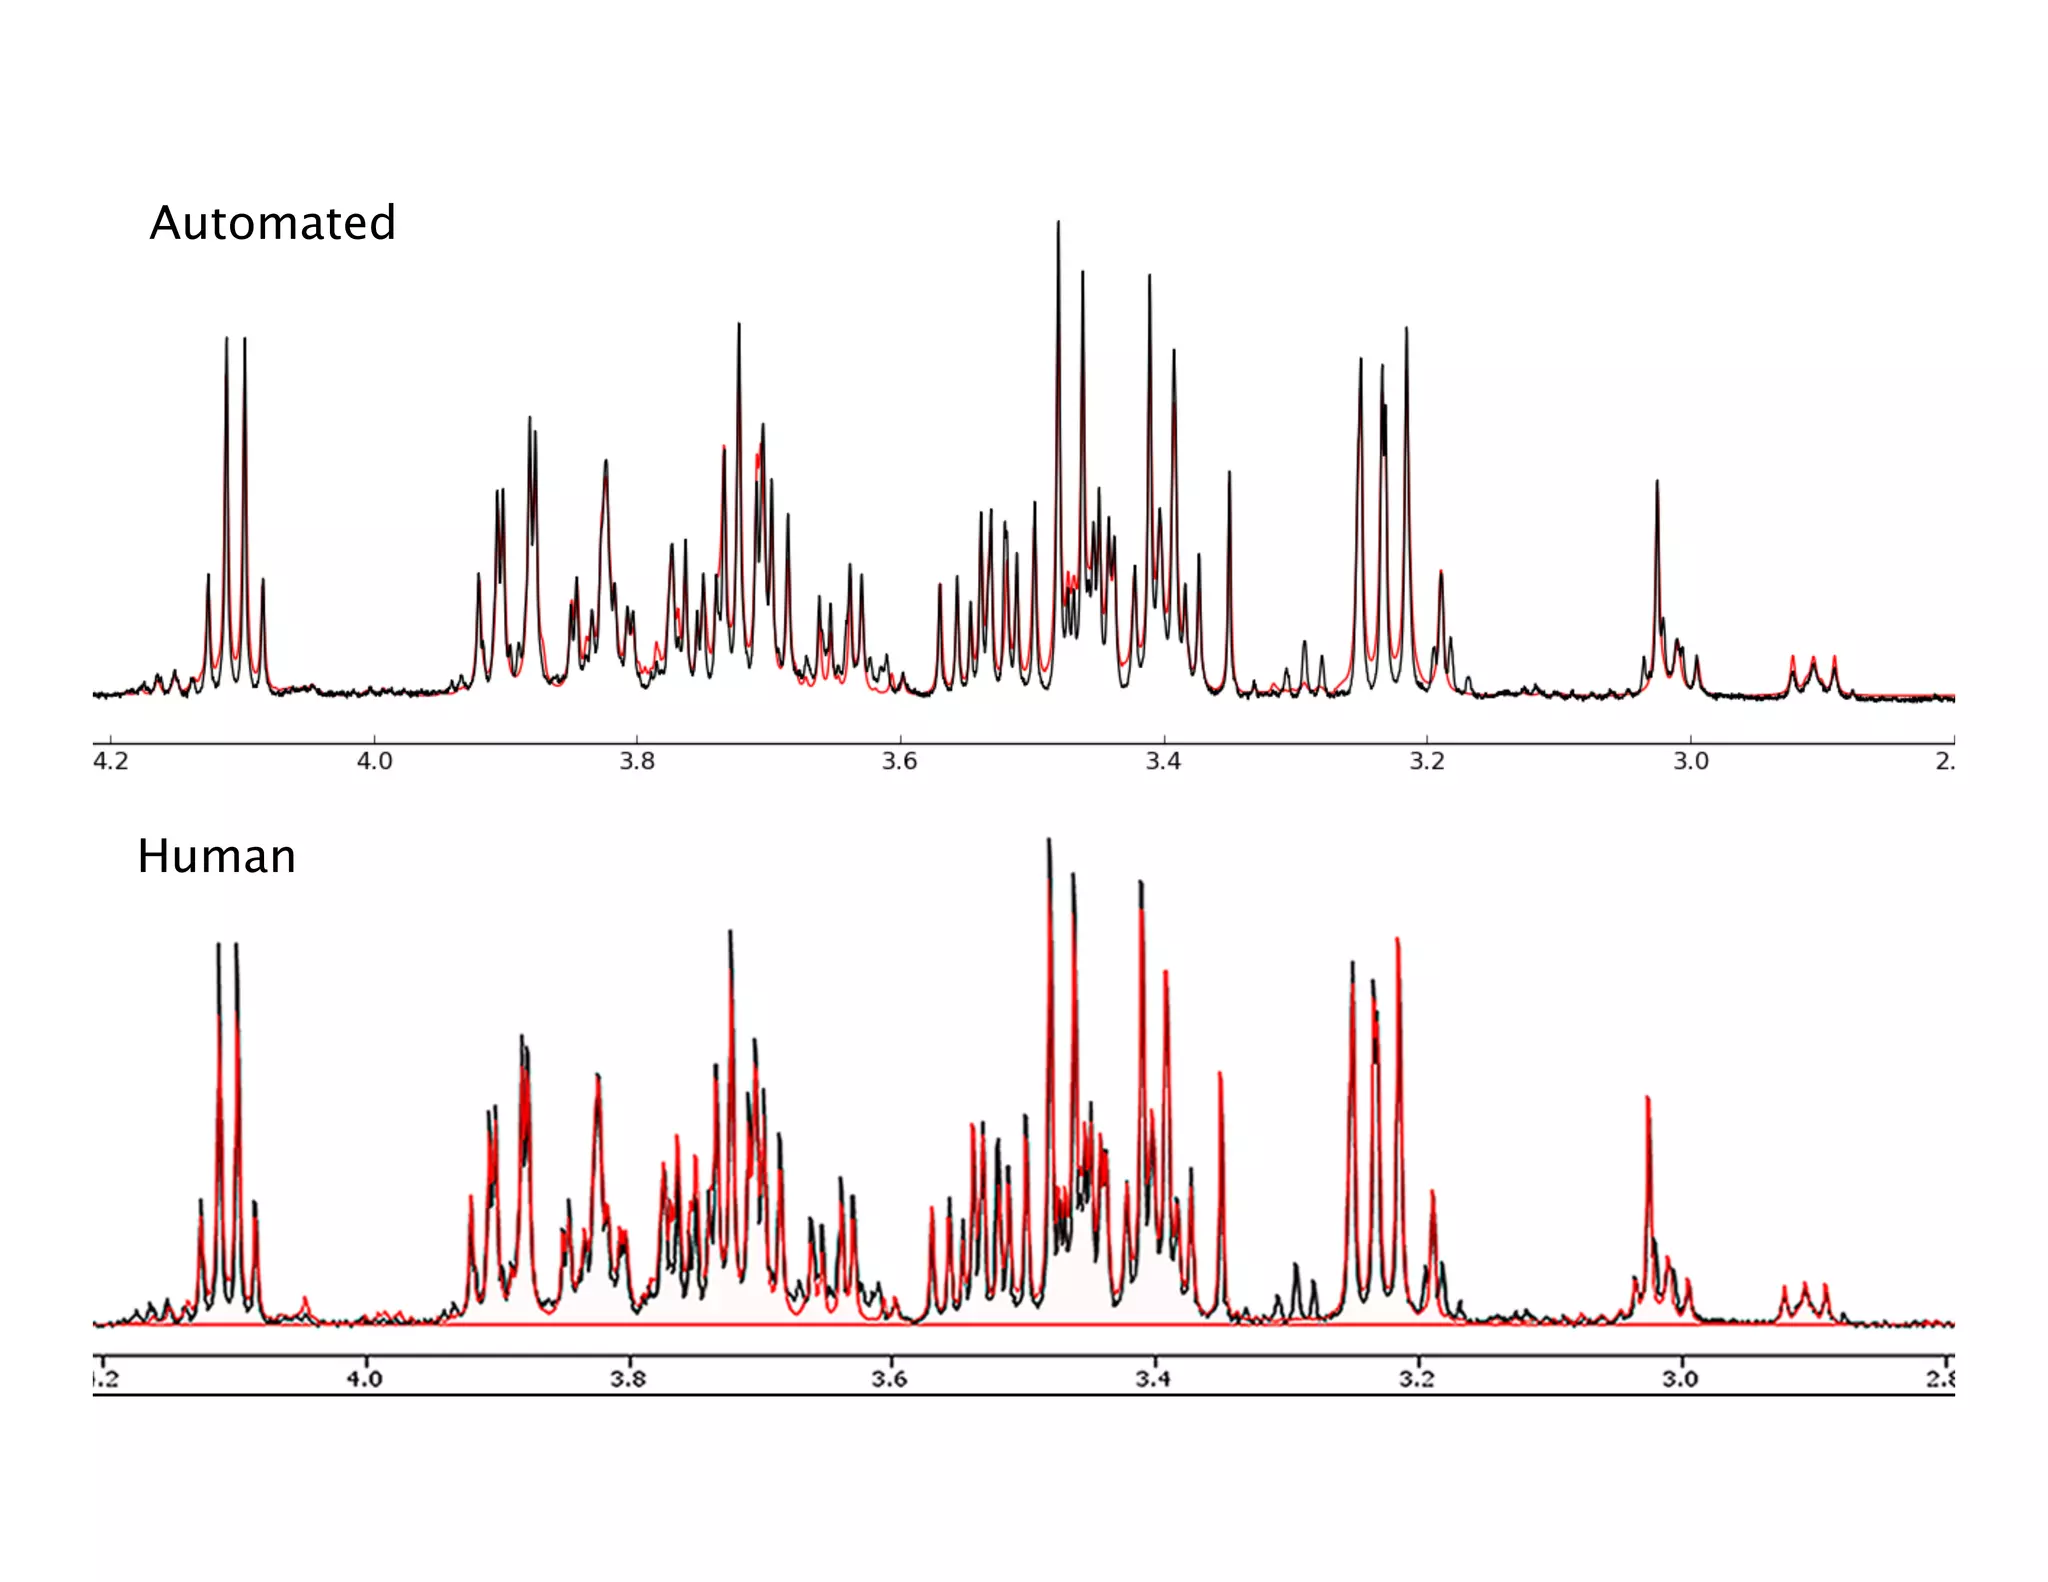
NMR Automation involves using programs like ChenoMX, Bayesil and NMRlib to automate the processing, profiling and identification of compounds from NMR spectra. ChenoMX is used to preprocess raw NMR data, profile identified compounds and build compound libraries. Bayesil and NMRlib then use these libraries to automatically process and identify compounds in spectra with minimal human input. This automation saves significant time over manual processing while improving consistency and reducing errors.


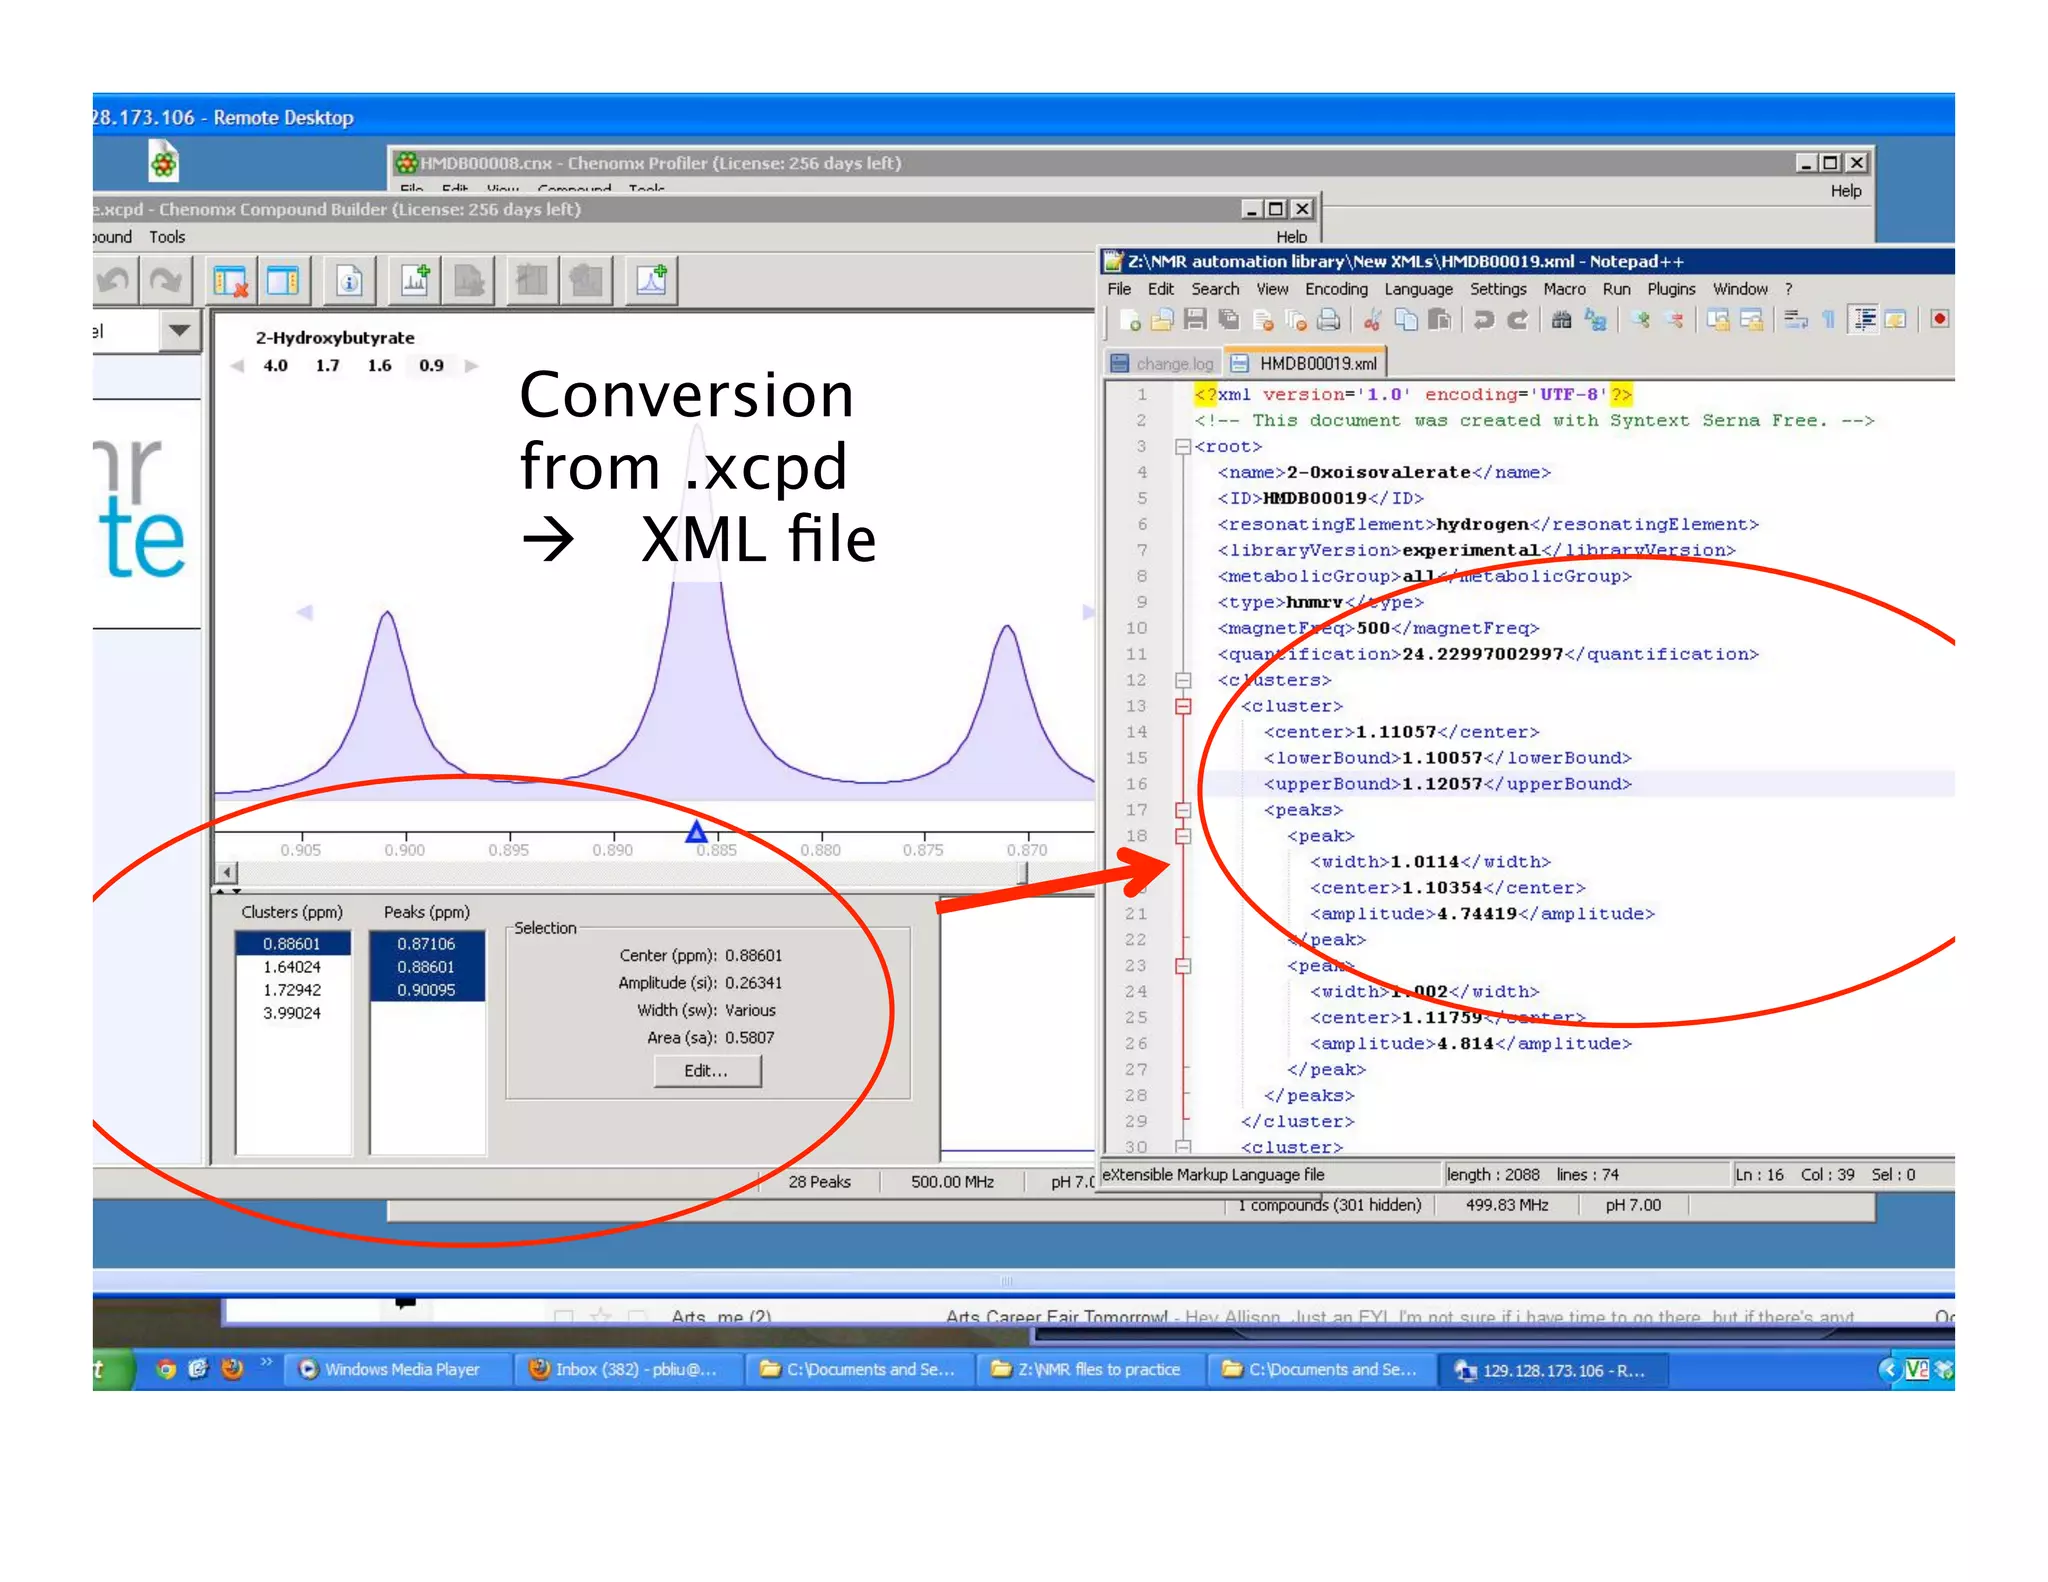
![3. XML
• Extensible Markup
Language (.xml files)
• A (document) markup
language is a modern
system for annotating
a document in a way
that is syntactically
distinguishable from
the text. [Wikipedia]
• Advantage: Machine
and Human readable](https://image.slidesharecdn.com/nmrautomation-130502123152-phpapp02/75/NMR-Automation-61-2048.jpg)


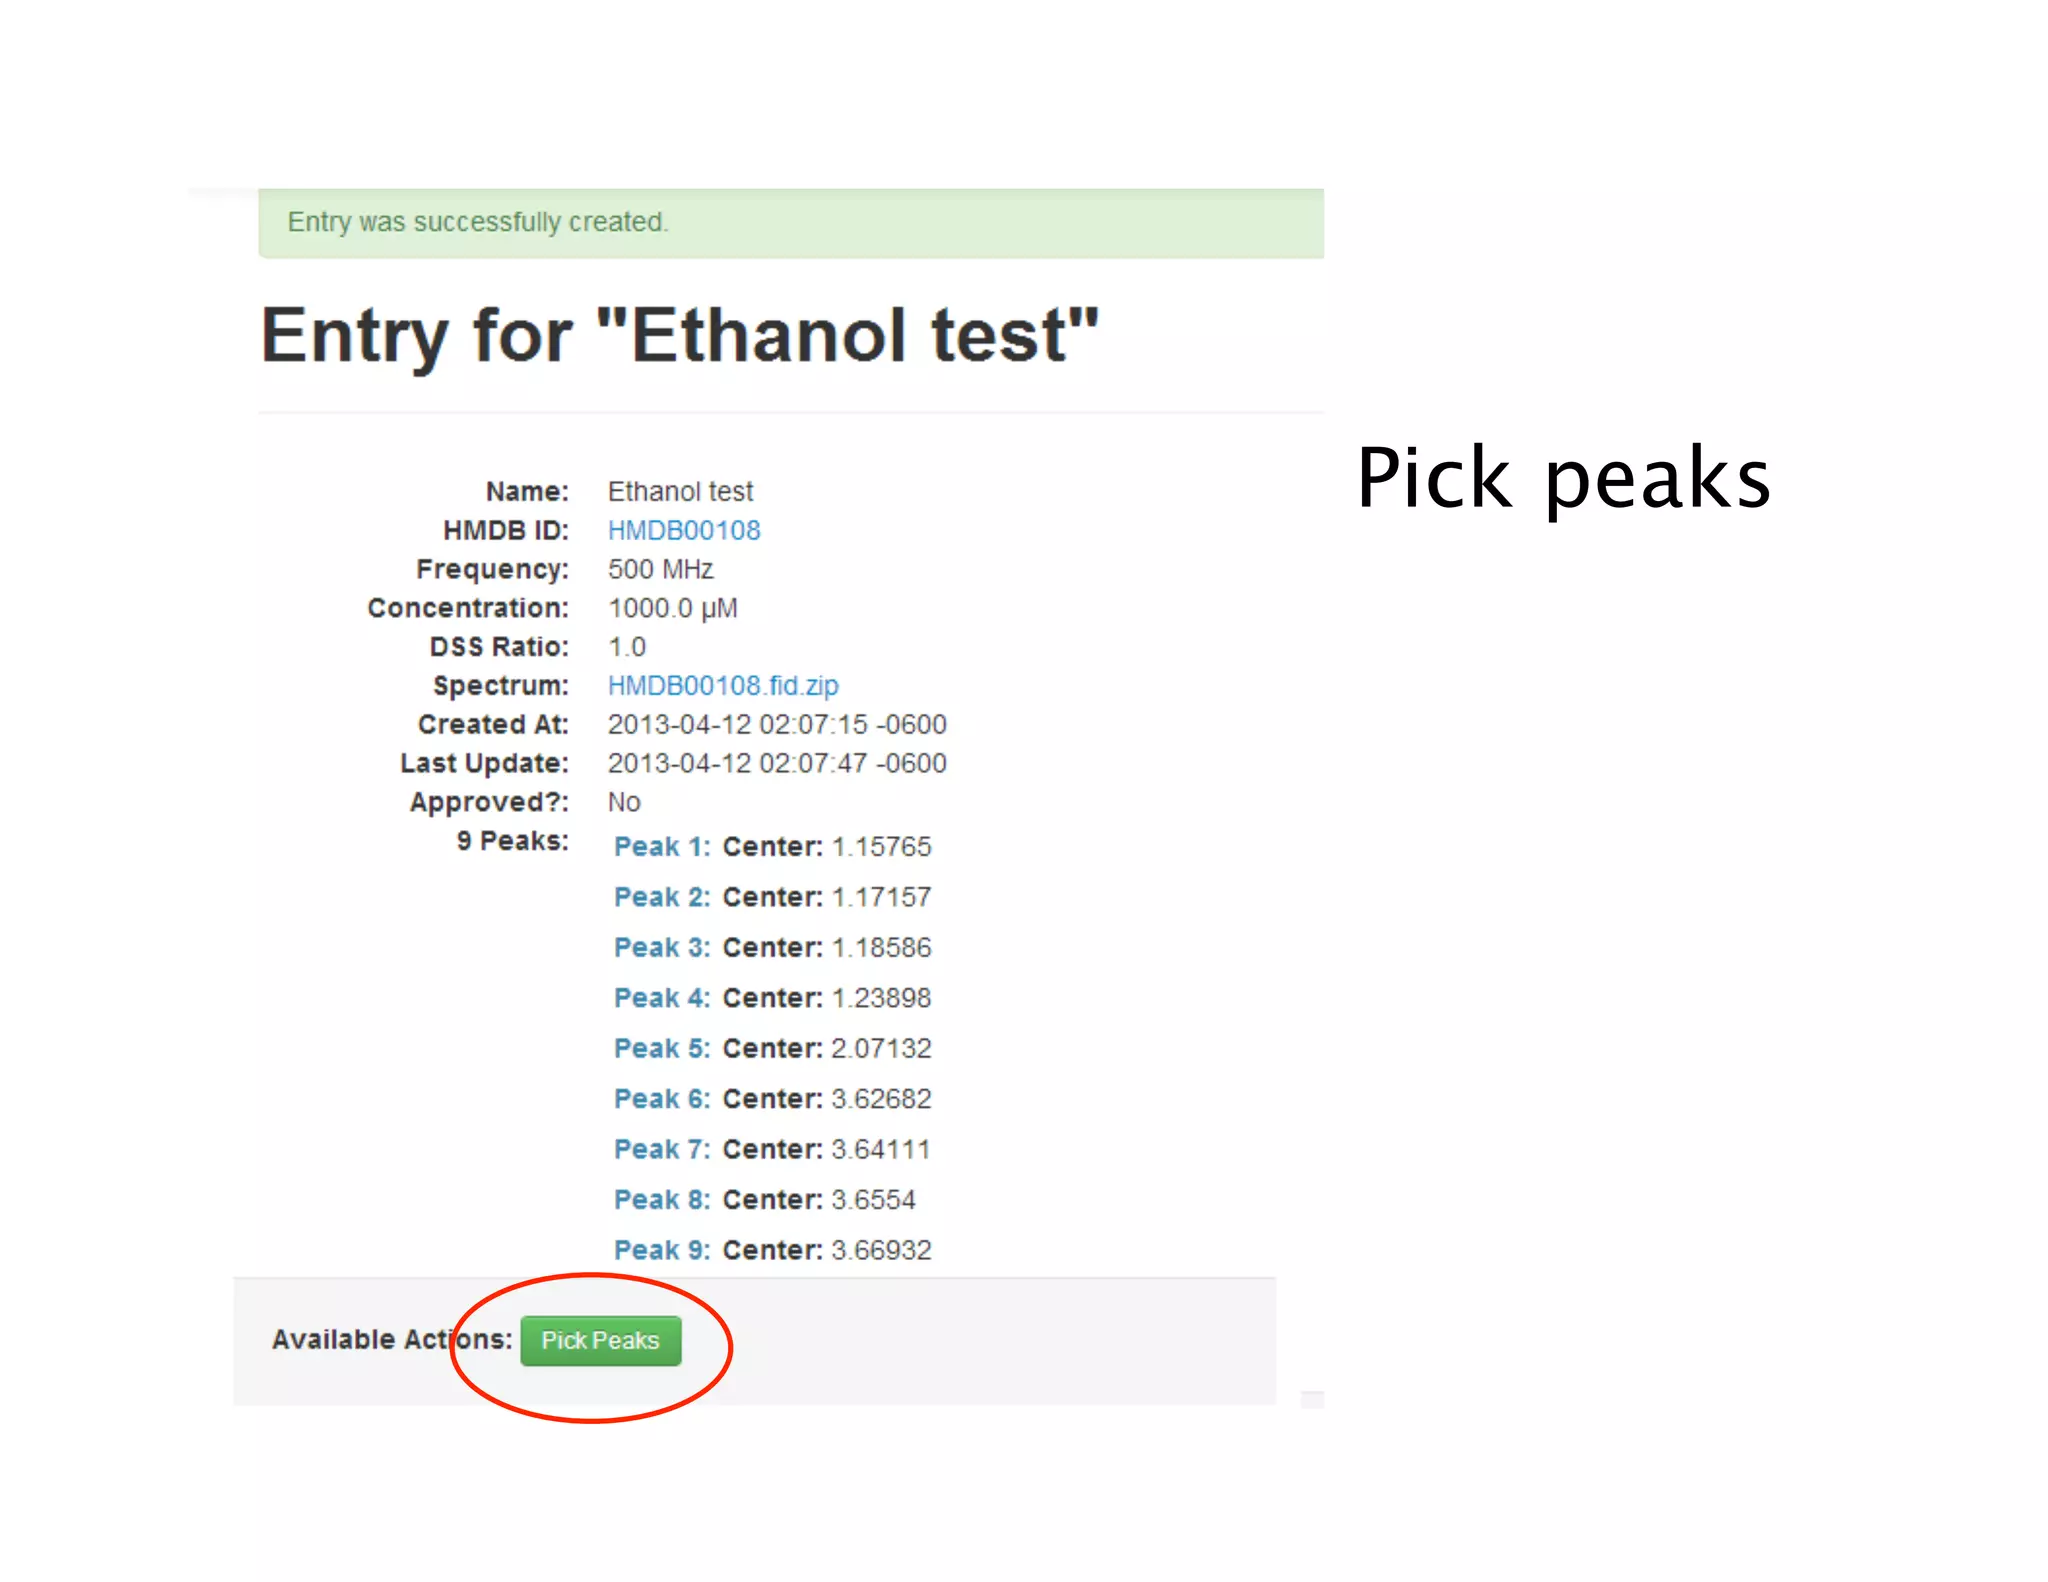
![NMRlib
• Fill in fields, Name,
HMDBID, NMR Freq.
Metabolite
concentration (as
measured by
ChenoMX or
experimental), and
ratio of [metabolite]/
[DSS]
• -Spectrum files must
be .zip files and the
fid must be in a
folder named
HMDBxxxxx.fid
eg.](https://image.slidesharecdn.com/nmrautomation-130502123152-phpapp02/75/NMR-Automation-72-2048.jpg)