The document provides a market summary and update for January 22, 2020. It includes the following key points:
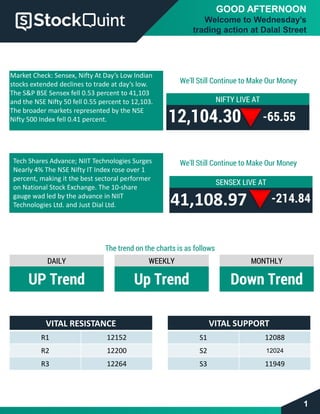
- Indian stocks extended declines, with the Sensex falling 0.53% and Nifty 50 falling 0.55% to their day's lows.
- Tech shares advanced, with the Nifty IT index rising over 1% led by gains in NIIT Technologies and Just Dial.
- On charts, the daily trend for Nifty is up, weekly trend is up, but monthly trend is down. Key resistance levels are at 12,152 and 12,200, while support levels are at 12,088 and 12,024.
The document provides an update on the Indian stock market on 7 January 2020. It reports that equity benchmarks extended declines, with the Sensex falling 0.5% and Nifty 50 falling 0.59%. Most sectors traded lower, led by a 1.2% fall in the media index, while the IT index gained 1.66%. It provides closing values for various global indices. It also lists the top gainers and losers by change in open interest.
Indian equity benchmarks extended their declines, with the Sensex falling 0.5% and the Nifty 50 falling 0.59%. Most sectoral indices traded lower led by the 1.2% fall in the media index, while the IT index gained 1.66%. The daily trend for Nifty is shown as up, while the weekly and monthly trends are up and down respectively, with vital resistance levels at 12,128 and 12,201 along with support at 11,969 and 11,880.
- Indian equity benchmarks extended declines, with the Sensex falling 0.5% and the Nifty 50 falling 0.59% as most sectoral indices traded lower led by the 1.2% fall in the media index.
- The daily, weekly and monthly trends on the Nifty charts are up, up and down respectively.
- Key resistance levels are at 12,050, 12,124 and 12,198 while support levels are at 11,939, 11,886 and 11,852.
The document provides an update on the Indian stock market indices on January 3rd, 2020. It states that the key indices (Sensex and Nifty) extended their declines and were trading at their day's lows, down around half a percent. Most sectoral indices also traded lower, led by a over 1% fall in the media index, while the IT index gained over 1.6%. It provides closing values and changes for other global indices like Dow Jones, FTSE, CAC, and DAX. It also lists some top gainers and losers among individual stocks.
The document provides an afternoon market update from Dalal Street in India on January 21, 2020. It reports that the key Indian stock indices, Sensex and Nifty, declined by around 0.25-0.23% as Asian stocks and US futures also dropped. Global indices like Dow, FTSE, CAC and DAX are also noted to be trading lower. Top gainers and losers by change in open interest in the Indian market are also listed.
Indian equity benchmarks traded marginally lower in morning trade on Wednesday, with the Nifty 50 falling 0.09% to 12,251 points. Six sectors gained led by metals, while IT was the top loser. Global markets were mixed, with the Dow up 0.04% while the DAX fell 0.12%. Top gainers and losers by futures open interest were noted.
The document provides an update on the Indian stock market indices Sensex and Nifty on 11 December 2019. It mentions that the indices recovered in the afternoon after an unexpected pause in the rate cut by India's Monetary Policy Committee. It provides the daily, weekly and monthly trends for Nifty. It also gives vital resistance and support levels for Nifty. Finally, it states that the benchmarks fluctuated without direction after the monetary policy decision to keep the repo rate unchanged.
- The Nifty was trading at 12,265.40, up slightly from the previous day. On charts, it showed an upward trend weekly and monthly but downward trend monthly. Key support was at 12,198 and resistance at 12,287.
- Trading activity was high in Nifty put options expiring that day as their premium rose over 5%.
- Sectorally, metal stocks gained over 1% while banking stocks fell nearly 1%. Global indices were also up in the range of 0.5-1.7%.
- The Indian equity benchmarks erased morning gains and were trading lower in the afternoon. The Sensex fell 0.36% and the Nifty 50 fell 0.16%.
- Nine of the 11 sectoral indices compiled by the NSE traded higher led by the metal index, while the realty index saw the largest decline.
- Global markets were mostly higher with the Dow up 155 points, while the FTSE and DAX rose slightly and the CAC gained 32.5 points.
The document provides an update on the Indian stock market indices Sensex and Nifty on 5 December 2019. It mentions that the indices recovered in the afternoon after the Monetary Policy Committee unexpectedly kept the repo rate unchanged. The trends on daily, weekly and monthly charts for Nifty are given. Key resistance and support levels for Nifty are also provided. Market fluctuations and closing numbers for Sensex, Nifty and some global indices are noted. Top gainers and losers by change in open interest in the futures market are listed.
- The Indian equity benchmarks fell nearly 1% in morning trading on Wednesday as the Sensex dropped 0.9% and the Nifty 50 fell 0.88%. Most sectoral indices traded lower led by a 2.78% fall in the banking sector index.
- The daily, weekly and monthly trends for the Nifty are all showing downtrends on the charts. Key support levels for the Nifty are 11,461 and 11,377 while resistance levels are at 11,517 and 11,629.
- Ten out of 11 sectoral gauges compiled by NSE traded lower led by the 2.78% fall in the banking sector index, while the IT sector index rose 0.33%.
- The Sensex fell over 250 points or 0.63% to 40,323 and the Nifty fell 0.6% to 11,895 on weakness in broader markets.
- Trends showed the daily trend as up, weekly as up, and monthly as down for Nifty. Key support levels were S1 11884, S2 11874, and S3 11825. Key resistance levels were R1 11949, R2 11978, and R3 12020.
- Asian stock markets were mixed with Japan and Hong Kong adding gains while Shanghai slipped as investors awaited details on US-China trade discussions.
- The Indian equity benchmarks recovered from losses in the afternoon session after the Monetary Policy Committee unexpectedly kept the repo rate unchanged.
- The daily, weekly, and monthly trends for the Nifty are up, up, and down respectively based on the charts.
- Key support levels for the Nifty are 11907, 11874, and 11819 while resistance levels are 11984, 12026, and 12077.
- Global indices such as the Dow Jones, FTSE, CAC, and DAX closed lower on the day.
The document provides an update on the Indian stock market indices and various stocks. It mentions that the key indices rose led by gains in Infosys and HDFC Bank. It provides technical analysis details like daily, weekly and monthly trends for Nifty. It also lists top gainers and losers among stocks by change in open interest. Global market indices values are also listed.
The Indian market is under pressure due to lack of positive triggers and weak global cues. Nine of 11 sectoral gauges traded lower led by the NSE Nifty PSU Bank Index, which fell 1.85%. The NSE Nifty IT Index was the only major gainer, rising 0.1%. Investors are cautious ahead of earnings reports from heavyweights like IndusInd Bank and TCS.
- The key Indian stock market indices, Nifty and Sensex, opened trading on Thursday little changed from the previous day.
- Six out of 11 sectors were higher led by a 4.83% gain in the media sector, while metals fell 0.94%.
- The daily, weekly and monthly trends for Nifty are up, up and down respectively based on technical charts. Vital support and resistance levels are provided.
- Global markets were mixed with declines in Dow, FTSE and CAC but figures not provided for other indices.
The document provides an update on the trading of Indian equity benchmarks on Wednesday. It mentions that the key indices (Sensex and Nifty) opened lower but fluctuated between gains and losses throughout the day. It also provides analysis of daily, weekly and monthly trends in the markets. Additionally, it mentions that US stock futures slipped along with Asian shares as investors awaited developments in US-China trade talks.
- The S&P BSE Sensex rose 0.8% and the NSE Nifty 50 rose 0.8% on Monday. The broader markets also rose, represented by the 0.73% gain in the NSE Nifty 500 Index.
- Ten of 11 sectoral indices on the NSE traded higher, led by the 2.5% gain in the NSE Nifty Metal Index. The only loser was the NSE Nifty Media Index, down 0.6%.
- Global indices were mostly higher, with the DOW up 71.5 points, FTSE up 49.5 points, and DAX up 68.5 points.
The stock market indices in India rose in morning trading on Wednesday. The Sensex rose 0.46% and the Nifty 50 rose 0.43%. Most sectoral indices traded higher led by a 2% gain in banking stocks, while media stocks lost 1.2%. Key support and resistance levels for the Nifty 50 are noted.
- The Indian equity benchmarks continued to trade lower on Thursday, with the Sensex falling 0.76% and the Nifty 50 falling 0.75%. All 11 sectoral indices compiled by the NSE traded lower, led by the media index's 2.57% fall.
- The daily, weekly, and monthly trends on the Nifty charts are all showing a downward trend. Key resistance levels are at 10,872 and 10,885, while key support levels are at 10,642 and 10,600.
- Global markets were also trading lower, with declines seen in the Dow, FTSE, CAC, and DAX indices.
The document provides an afternoon market update for Monday, November 4th. It summarizes the performance of key indices such as the Nifty, Sensex, and global markets. Specific stocks gaining and losing from changes in open interest are also mentioned. Trend analysis is given for various periods. Resistances and support levels are identified for the Nifty.
The document provides an update on stock market indices and individual stocks in India on September 9, 2019. It discusses the performance of key indices like Sensex and Nifty, noting that both rose during the day's trading. It also lists the top gainers and losers among individual stocks. Global market updates for indexes in Dow, FTSE, CAC and DAX are also provided.
- The Nifty index was trading at 12,166.45, with sectoral indices like metal gaining over 1% while banking fell nearly 1%
- On charts, Nifty trends were up in daily and weekly but down in monthly
- Resistance levels were at 12,202, 12,236 and 12,293 while support was at 12,158, 12,099 and 12,040
- Put options contracts on Nifty expiring today saw increased trading volume and open interest
- The Sensex rose 0.28% while the Nifty declined 0.10% on Monday. The broader markets fell 0.48%.
- Trends show daily, weekly, and monthly declines for the Nifty. Support levels are at 11,160 and 11,135 while resistance levels are at 11,218 and 11,233.
- Global markets declined with the Dow falling 102.50 points, FTSE falling 27.80 points, CAC falling 26.40 points, and DAX falling 58.80 points.
- The key Indian stock market indices, including the Sensex and Nifty 50, rose around 0.5% in morning trading on Wednesday.
- Six of the 11 sectoral indices compiled by NSE traded higher led by a 0.5% gain in the financial services index, while the IT index lost 1%.
- The daily, weekly and monthly trends on the Nifty charts are all showing down trends currently.
- The document provides an update on stock market indices and trends in India for October 15, 2019.
- Key indices like the Sensex and Nifty rose in early trading on gains in auto and other sectors.
- Charts show daily, weekly and monthly trends remaining in down trends for the Nifty.
- Global indices like the Dow, FTSE and DAX were also up in early trading.
- The Sensex rose as much as 0.698 percent to hit an all-time high of 40,328. The Nifty 50 rose 0.64 percent to 11,919.
- The daily, weekly, and monthly trends for the Nifty are up, up, and down respectively. Key resistance levels are at 11,960 and 12,045. Key support levels are at 11,804 and 11,704.
- The next level for the Nifty to watch is its all-time high of 12,103. Profit booking may extend towards 11,700-11,650 if the market starts trading below 11,785.
The Nifty and Sensex indices fell in morning trading on Monday as most sectoral indices declined. The Nifty fell 0.56% to 11,447 and the Sensex fell 0.5% to 38,612. Ten of the 11 sectoral indices traded lower led by a 3.4% fall in the banking index. Nifty IT was the only sectoral gainer, up 1.35%. Trend indicators showed downward trends on the daily, weekly and monthly charts for the Nifty. Key support and resistance levels for the Nifty are also mentioned.
Indian equity benchmarks extended their declines, with the Sensex falling 0.5% and the Nifty 50 falling 0.59%. Most sectoral indices traded lower led by the 1.2% fall in the media index, while the IT index gained 1.66%. The daily trend for Nifty is shown as up, while the weekly and monthly trends are up and down respectively, with vital resistance levels at 12,128 and 12,201 along with support at 11,969 and 11,880.
- The Indian stock market surged on Friday, with the Sensex jumping nearly 2,000 points and the Nifty 50 rising over 5.5% above 11,250 points.
- The daily, weekly, and monthly trends for the Nifty were all showing a downward trend. Key resistance levels were at 11,356 and 11,397 points while support levels were at 10,859 and 10,840 points.
- Most stocks on the NSE advanced, led by an 8.3% rally in the auto sector index. Global markets were mixed with the Dow up slightly but the FTSE and DAX falling.
The document provides an afternoon market update for the Indian stock market on 20 January 2020. It reports that:
- The Sensex fell 0.94% to 41,595.05 and the Nifty 50 fell 0.86% to 12,246 as the markets erased early gains.
- Nine of 11 sector gauges on the NSE traded lower, with the Nifty IT index falling 1%.
- Key support and resistance levels are provided for the Nifty.
- The Indian equity benchmarks pared losses on Wednesday, with the Nifty 50 rising 0.18% to 11,938.50 and the Sensex rising 0.2% to 40,335.34.
- Nifty futures were trading at 11,960.85, with the daily trend marked as up, weekly trend as up, and monthly trend as down. Key support levels were at 11934, 11876, and 11823, while resistance levels were at 12020, 12047, and 12116.
- Nifty's 11,900 call option contracts saw a 52.61% fall in premium to Rs 31.75 as they are set to expire on Thursday.
- The Indian stock market indices rose slightly on Friday afternoon, with the Sensex up 0.19% and the Nifty 50 up 0.16%. The broader Nifty 500 also rose 0.28%.
- Nifty futures were trading around 11,888, with daily, weekly, and monthly trends all showing upward movements. Key resistance levels were at 11,948 and 12,045. Key support levels were at 11,875 and 11,816.
- Global markets were mostly higher. Among Indian stocks, Nifty Bank, Cipla, and Bajaj Finserv saw increases in their share prices and open interest. Cummins India, Equitas, and Infratech saw decreases.
The document summarizes the daily performance of the Indian stock market indices. It mentions that the key indices, Sensex and Nifty 50, extended their morning gains and reached record high levels during the afternoon trading session. It provides the latest levels of Sensex and Nifty. It also summarizes the performance of various other global indices and the top gainers and losers among Indian stocks.
The document provides a daily market update for the Indian stock market. It summarizes that the key indices (Sensex and Nifty 50) opened higher but then traded flat, with some sectors like banks declining. It provides technical analysis showing daily, weekly and monthly trends for the Nifty. It also lists the top gainers and losers by change in open interest. Global market updates are given.
- The Sensex and Nifty indexes were trading higher supported by gains in private sector banks like ICICI Bank and Yes Bank.
- Nine of the 11 sector gauges compiled by NSE traded higher led by the banking index, while the auto index was the top loser.
- In global markets, indices like the Dow, FTSE, CAC and Dax were trading lower by up to 1%.
- The document provides an afternoon market update for Indian stocks on January 13th.
- Key indices like the Sensex and Nifty opened higher and reached record high levels, rising over 0.5%.
- The 12,300 call option for Nifty saw significant activity, with its premium rising 56% and open interest increasing over 5%.
- Top gainers and losers by change in open interest are listed from various sectors.
- The Nifty was down 0.4% at 11,865 and the Sensex fell 0.34% to 40,186. Six out of 11 sectors on the NSE were higher led by the 1.74% gain in the Media Index, while the IT Index fell 0.86%.
- On charts, the daily trend for the Nifty is up while the weekly is up and monthly is down. Key resistance levels are at 12,040 and 11,976 and support is at 11,849 and 11,820.
- In global markets, the Dow fell 116 points, FTSE fell 40.80 points, CAC fell 22.30 points and DAX fell 90.10 points
- The Indian stock market opened higher on Monday, with the Sensex up 0.62% and the Nifty 50 up 0.62% as well.
- The daily, weekly, and monthly trends on the charts are all showing a downward trend for the Nifty 50.
- Key support levels for the Nifty 50 are 11,290, 11,259, and 11,227, while resistance levels are 11,378, 11,398, and 11,436.
The stock market indices rose slightly on Wednesday afternoon. The Sensex rose 0.23% and the Nifty 50 rose 0.28% led by gains in ten out of eleven sectoral indices, with media gaining the most. Losses in auto dragged the markets down. The trends on daily, weekly and monthly charts all showed downtrends, with key resistance and support levels outlined.
This document provides a summary of key economic data being released during the week of March 9-14, 2020. It lists the date, time, and country/region that the economic indicator is being released for, along with the specific indicator such as consumer confidence, GDP, manufacturing PMI, etc. There is also a disclaimer at the end related to the information provided and legal terms of using the website.
The document provides a report on gold and silver prices and analysis from the MCX (Multi Commodity Exchange) on March 21, 2020.
The 3 sentence summary is:
Gold prices on the MCX rose 0.75% to Rs. 40,129 per 10 grams as speculators created new positions amid a firm global trend, while silver prices soared Rs. 914 to Rs. 36,016 per kg as participants widened bets due to a firm global trend. The report provides technical analysis and recommendations to sell gold at Rs. 38,400 and silver at Rs. 33,047 based on support and resistance levels.
The document provides details of an option trading strategy for Ultratech Cement. It recommends buying 3400 call options of Ultratech Cement at Rs. 299 with a lot size of 200, maximum loss of Rs. 63,100, and unlimited profit potential. The strategy rationale is that Ultratech Cement has broken resistance and sustained above that level, indicating a high probability of the stock price rising further.
- The USD was higher against the INR on Friday after the Indian Prime Minister announced a nationwide curfew on Sunday to combat the spread of coronavirus.
- USD/INR was trading at 75.15, up 0.50% for the day. The research recommendation was to buy USD/INR at 75.24 with a target of 76.5 and stop loss of 74.2.
- The document provided a technical analysis of USD/INR along with a research recommendation for trading the currency pair.
The document provides analysis and recommendations on the Indian stock market and some specific stocks. It discusses key support and resistance levels for indexes like Nifty and Bank Nifty. It provides both short term and medium term buy recommendations for stocks like Reliance, Tata Steel, and Maruti among others. The document also summarizes global market conditions and movements in crude oil prices.
Silver, gold and crude oil futures prices rose on Friday according to the commodity snapshot document. Natural gas markets fluctuated after rising on Thursday. Nickel futures also gained on Friday due to rising demand. The aluminum industry may see reduced production and loads due to the automotive sector slowing down as a result of the coronavirus crisis in Germany and Europe. Rubber prices declined as tyre makers and domestic stockists were not interested in increasing commitments.
- The document provides a sector-wise breakdown of the movement in the Indian stock market on March 21, 2020. Most sectors saw gains ranging from 3.4% to 10.1%.
- It also lists support and resistance levels for the Nifty and Bank Nifty indexes. Foreign and domestic institutional investor activity is shown for the past few days.
- The indexes saw gains on March 20 on hopes of a government stimulus and positive global cues, breaking a four-day losing streak. However, the market remains sell-on-rally due to coronavirus pessimism.
JSW Steel is an Indian steel company and one of the fastest growing in India. It has a footprint in over 140 countries. JSW Steel is India's second largest private sector steel company with an installed capacity of 18 MTPA. The document provides a rating of "Buy" for JSW Steel with a target price of INR 250 and discusses the company's financial performance, growth, capacity expansion plans, and valuation compared to peers.
- The stock market indices in India ended lower for the fourth consecutive session on March 19 due to concerns over the COVID-19 pandemic and its economic impact. The Sensex closed down 581 points and Nifty fell 205 points.
- The economic impact of the COVID-19 pandemic is being felt globally via supply chain disruptions and a slowdown in demand as more countries implement lockdowns and social distancing measures. This will likely weaken the global economy in the first half of 2020.
- The effects of the pandemic are expected to be prolonged, with supply chain disruptions in China gradually easing by mid-April but the impact on travel and tourism likely lasting until June. Weak demand from lockdowns
- Gold futures rose on Friday due to safe haven demand amid the accelerated spread of COVID-19, lower US equities, and a weaker US dollar.
- The Dow Jones fell 0.8% and the US Dollar Index fell 0.25%, both lending support to gold prices.
- Silver markets also rallied, piercing the $13 level and looking to build a base as the market has been oversold, though industrial demand for silver will be negatively impacted by the pandemic.
Sector weekly perfomance 21 st mar - 2020stockquint
This document provides a weekly sector performance report covering several industries in India. It discusses how the continued spread of COVID-19 is negatively impacting the automobile sector through supply chain disruptions from China and potential declines in demand. It also notes challenges for the banking sector from the pandemic's economic effects. The FMCG sector continues to see a slowdown, especially in rural areas. The pharmaceutical industry may need to reduce dependence on China for active pharmaceutical ingredients. The NBFC, oil and gas, and stressed asset management sectors are also addressed.
Derivative weekly report 21 st mar - 2020stockquint
The document provides analysis of the Indian stock market and recommends buying Hindustan Unilever Limited futures. It analyzes technical indicators for the Nifty 50 index and Bank Nifty index, noting support and resistance levels. It also discusses currency movements between the Indian rupee and US dollar. Open interest data for various securities is presented.
- Several key sectors saw declines last week, with the BSE PSU index falling -133.2 points and the BSE Bankex index declining -236.68 points.
- The Nifty index failed to break above previous highs and closed the week down 32.6 points at 12,080.85. Technical indicators suggest the potential for further declines in the short term.
- Mobile carriers including Vodafone Idea were ordered to pay thousands of crores in dues following a Supreme Court ruling. Official macroeconomic data will be monitored for signs of economic revival.
This document provides a weekly sector analysis and stock picks for the third week of February 2020. It includes:
- A performance summary of various sectors for the week.
- Potential stock picks to buy or sell for the week, including entry prices and targets.
- A discussion of developments in sectors such as banking, auto, energy, and telecom.
This document provides a summary of key economic data being released for the week of February 24, 2020 to February 29, 2020 from various countries including New Zealand, Eurozone, Australia, Canada, China, and the United States. It also includes disclaimers about investment risks and responsibilities for the information provided.
- The weekly market report provides an overview of the performance of key indices like Nifty and Bank Nifty for the week ending February 20, 2020. Nifty ended the week lower by 32 points at 12,080 levels while Bank Nifty closed lower by 287 points at 30,942 levels.
- Most sectors ended in red for the week with auto, metal and PSU banking indices falling the most. IT was the only sector in green, gaining over 1%. Foreign institutional investors were net sellers in the cash market during the week.
- Going forward, analysts will monitor official economic data for signs of recovery in the slowing Indian economy. The report provides technical levels for the indices along with details of sector performances.
Abhay Bhutada, the Managing Director of Poonawalla Fincorp Limited, is an accomplished leader with over 15 years of experience in commercial and retail lending. A Qualified Chartered Accountant, he has been pivotal in leveraging technology to enhance financial services. Starting his career at Bank of India, he later founded TAB Capital Limited and co-founded Poonawalla Finance Private Limited, emphasizing digital lending. Under his leadership, Poonawalla Fincorp achieved a 'AAA' credit rating, integrating acquisitions and emphasizing corporate governance. Actively involved in industry forums and CSR initiatives, Abhay has been recognized with awards like "Young Entrepreneur of India 2017" and "40 under 40 Most Influential Leader for 2020-21." Personally, he values mindfulness, enjoys gardening, yoga, and sees every day as an opportunity for growth and improvement.
^%$Zone1:+971)581248768’][* Legit & Safe #Abortion #Pills #For #Sale In #Duba...mayaclinic18
Whatsapp (+971581248768) Buy Abortion Pills In Dubai/ Qatar/Kuwait/Doha/Abu Dhabi/Alain/RAK City/Satwa/Al Ain/Abortion Pills For Sale In Qatar, Doha. Abu az Zuluf. Abu Thaylah. Ad Dawhah al Jadidah. Al Arish, Al Bida ash Sharqiyah, Al Ghanim, Al Ghuwariyah, Qatari, Abu Dhabi, Dubai.. WHATSAPP +971)581248768 Abortion Pills / Cytotec Tablets Available in Dubai, Sharjah, Abudhabi, Ajman, Alain, Fujeira, Ras Al Khaima, Umm Al Quwain., UAE, buy cytotec in Dubai– Where I can buy abortion pills in Dubai,+971582071918where I can buy abortion pills in Abudhabi +971)581248768 , where I can buy abortion pills in Sharjah,+97158207191 8where I can buy abortion pills in Ajman, +971)581248768 where I can buy abortion pills in Umm al Quwain +971)581248768 , where I can buy abortion pills in Fujairah +971)581248768 , where I can buy abortion pills in Ras al Khaimah +971)581248768 , where I can buy abortion pills in Alain+971)581248768 , where I can buy abortion pills in UAE +971)581248768 we are providing cytotec 200mg abortion pill in dubai, uae.Medication abortion offers an alternative to Surgical Abortion for women in the early weeks of pregnancy. Zone1:+971)581248768’][* Legit & Safe #Abortion #Pills #For #Sale In #Dubai Abu Dhabi Sharjah Deira Ajman Fujairah Ras Al Khaimah%^^%$Zone1:+971)581248768’][* Legit & Safe #Abortion #Pills #For #Sale In #Dubai Abu Dhabi Sharjah Deira Ajman Fujairah Ras Al Khaimah%^^%$Zone1:+971)581248768’][* Legit & Safe #Abortion #Pills #For #Sale In #Dubai Abu Dhabi Sharjah Deira Ajman Fujairah Ras Al Khaimah%^^%$Zone1:+971)581248768’][* Legit & Safe #Abortion #Pills #For #Sale In #Dubai Abu Dhabi Sharjah Deira Ajman Fujairah Ras Al Khaimah%^^%$Zone1:+971)581248768’][* Legit & Safe #Abortion #Pills #For #Sale In #Dubai Abu Dhabi Sharjah Deira Ajman Fujairah Ras Al Khaimah%^^%$Zone1:+971)581248768’][* Legit & Safe #Abortion #Pills #For #Sale In #Dubai Abu Dhabi Sharjah Deira Ajman Fujairah Ras Al Khaimah%^^%$Zone1:+971)581248768’][* Legit & Safe #Abortion #Pills #For #Sale In #Dubai Abu Dhabi Sharjah Deira Ajman Fujairah Ras Al Khaimah%^^%$Zone1:+971)581248768’][* Legit & Safe #Abortion #Pills #For #Sale In #Dubai Abu Dhabi Sharjah Deira Ajman Fujairah Ras Al Khaimah%^^%$Zone1:+971)581248768’][* Legit & Safe #Abortion #Pills #For #Sale In #Dubai Abu Dhabi Sharjah Deira Ajman Fujairah Ras Al Khaimah%^^%$Zone1:+971)581248768’][* Legit & Safe #Abortion #Pills #For #Sale In #Dubai Abu Dhabi Sharjah Deira Ajman Fujairah Ras Al Khaimah%^^%$Zone1:+971)581248768’][* Legit & Safe #Abortion #Pills #For #Sale In #Dubai Abu Dhabi Sharjah Deira Ajman Fujairah Ras Al Khaimah%^^%$Zone1:+971)581248768’][* Legit & Safe #Abortion #Pills #For #Sale In #Dubai Abu Dhabi Sharjah Deira Ajman Fujairah Ras Al Khaimah%^^%$Zone1:+971)581248768’][* Legit & Safe #Abortion #Pills #For #Sale In #Dubai Abu Dhabi Sharjah Deira Ajman Fujairah Ras Al Khaimah%^^%$Zone1:+971)581248768’][* Legit & Safe #Abortion #Pills #For #Sale In #Dubai Abu Dhabi Sharjah Deira Ajman
5 Tips for Creating Standard Financial ReportsEasyReports
Well-crafted financial reports serve as vital tools for decision-making and transparency within an organization. By following the undermentioned tips, you can create standardized financial reports that effectively communicate your company's financial health and performance to stakeholders.
The Rise of Generative AI in Finance: Reshaping the Industry with Synthetic DataChampak Jhagmag
In this presentation, we will explore the rise of generative AI in finance and its potential to reshape the industry. We will discuss how generative AI can be used to develop new products, combat fraud, and revolutionize risk management. Finally, we will address some of the ethical considerations and challenges associated with this powerful technology.
BONKMILLON Unleashes Its Bonkers Potential on Solana.pdfcoingabbar
Introducing BONKMILLON - The Most Bonkers Meme Coin Yet
Let's be real for a second – the world of meme coins can feel like a bit of a circus at times. Every other day, there's a new token promising to take you "to the moon" or offering some groundbreaking utility that'll change the game forever. But how many of them actually deliver on that hype?
OJP data from firms like Vicinity Jobs have emerged as a complement to traditional sources of labour demand data, such as the Job Vacancy and Wages Survey (JVWS). Ibrahim Abuallail, PhD Candidate, University of Ottawa, presented research relating to bias in OJPs and a proposed approach to effectively adjust OJP data to complement existing official data (such as from the JVWS) and improve the measurement of labour demand.
STREETONOMICS: Exploring the Uncharted Territories of Informal Markets throug...sameer shah
Delve into the world of STREETONOMICS, where a team of 7 enthusiasts embarks on a journey to understand unorganized markets. By engaging with a coffee street vendor and crafting questionnaires, this project uncovers valuable insights into consumer behavior and market dynamics in informal settings."
Falcon stands out as a top-tier P2P Invoice Discounting platform in India, bridging esteemed blue-chip companies and eager investors. Our goal is to transform the investment landscape in India by establishing a comprehensive destination for borrowers and investors with diverse profiles and needs, all while minimizing risk. What sets Falcon apart is the elimination of intermediaries such as commercial banks and depository institutions, allowing investors to enjoy higher yields.
2. GOOD AFTERNOON
Welcome to Wednesday’s
trading action at Dalal Street
1
Market Check: Sensex, Nifty At Day’s Low Indian
stocks extended declines to trade at day’s low.
The S&P BSE Sensex fell 0.53 percent to 41,103
and the NSE Nifty 50 fell 0.55 percent to 12,103.
The broader markets represented by the NSE
Nifty 500 Index fell 0.41 percent.
We'll Still Continue to Make Our Money
NIFTY LIVE AT
12,104.30
The trend on the charts is as follows
DAILY
UP Trend
WEEKLY
Up Trend
MONTHLY
Down Trend
VITAL RESISTANCE
R1 12152
R2 12200
R3 12264
VITAL SUPPORT
S1 12088
S2 12024
S3 11949
Tech Shares Advance; NIIT Technologies Surges
Nearly 4% The NSE Nifty IT Index rose over 1
percent, making it the best sectoral performer
on National Stock Exchange. The 10-share
gauge wad led by the advance in NIIT
Technologies Ltd. and Just Dial Ltd.
We'll Still Continue to Make Our Money
SENSEX LIVE AT
41,108.97
-65.55
-214.84
3. GOOD AFTERNOON
Welcome to Wednesday’s
trading action at Dalal Street
1
GLOBAL UPDATE
DOW
29,257.50
+78.50
FTSE
7,559.80
+15.30
CAC
6,044.50
+2.50
DAX
13,584.50
+54.50
OI GAINER OI LOSER
Security Price(Futures) % Change OI % Change
HCLTECH 593.5 1.41% 167.02%
UBL 1280.7 0.70% 113.72%
ZEEL 293.4 3.20% 109.28%
CADILAHC 272 0.48% 60.78%
GRASIM 796.95 2.73% 54.92%
Security Price(Futures) % Change OI % Change
HDFCBANK 1243.65 -0.83% 170.65%
COALINDIA 192.05 -4.93% 36.17%
NTPC 112.2 -4.75% 30.17%
ONGC 116.45 -5.25% 24.67%
BEL 101.8 -3.19% 18.22%
4. The information and views in this website & all the services we provide are believed to be reliable, but we do not accept any responsibility (or liability) for errors of fact or opinion. Users have the right to choose the product/s that
suits them the most.
Investment in equity shares has its own risks. Sincere efforts have been made to present the right investment perspective. The information contained herein is based on analysis and on sources that we consider reliable. We,
however, do not vouch for the consistency or the completeness thereof. This material is for personal information and we are not responsible for any loss incurred due to it & take no responsibility whatsoever for any financial
profits or loss which may arise from the recommendations above.
Investment bulls does not purport to be an invitation or an offer to buy or sell any financial instrument. Analyst or any person related to investment bulls might be holding positions in the stocks recommended.
Our clients (paid or unpaid), any third party or anyone else have no rights to forward or share our calls or sms or reports or any information provided by us to/with anyone which is received directly or indirectly by them. If found so
then serious legal actions can be taken.
By accessing stock quint.Com or any of its associate/group sites, you have read, understood and agree to be legally bound by the terms of the following disclaimer and user agreement.
stock quint.Com has taken due care and caution in compilation of data for its web site. The views and investment tips expressed by investment experts on stock quint.Com are their own, and not that of the website or its
management. stock quint.Com advises users to check with certified experts before taking any investment decision. However, stock quint.Com does not guarantee the consistency, adequacy or completeness of any information and
is not responsible for any errors or omissions or for the results obtained from the use of such information. stock quint.Com especially states that it has no financial liability whatsoever to any user on account of the use of
information provided on its website.
stock quint.Com is not responsible for any errors, omissions or representations on any of our pages or on any links on any of our pages. stock quint.Com does not endorse in anyway any advertisers on our web pages. Please verify
the veracity of all information on your own before undertaking any alliance.
The information on this website is updated from time to time. stock quint.Com however excludes any warranties (whether expressed or implied), as to the quality, consistency, efficacy, completeness, performance, fitness or any of
the contents of the website, including (but not limited) to any comments, feedback and advertisements contained within the site.
This website contains material in the form of inputs submitted by users and stock quint.Com accepts no responsibility for the content or consistency of such content nor does stock quint.Com make any representations by virtue of
the contents of this website in respect of the existence or availability of any goods and services advertised in the contributory sections. stock quint.Com makes no warranty that the contents of the website are free from infection
by viruses or anything else which has contaminating or destructive properties and shall have no liability in respect thereof.
Part of this website contains advertising and other material submitted to us by third parties. Kindly note that those advertisers are responsible for ensuring that material submitted for inclusion on the website complies with all legal
requirements. Although acceptance of advertisements on the website is subject to our terms and conditions which are available on request, we do not accept liability in respect of any advertisements.
This website will contain articles contributed by several individuals. The views are exclusively their own and do not necessarily represent the views of the website or its management. The linked sites are not under our control and
we are not responsible for the contents of any linked site or any link contained in a linked site, or any changes or updates to such sites. stock quint.Com is providing these links to you only as a convenience, and the inclusion of any
link does not imply endorsement by us of the site.
There are risks associated with utilizing internet and short messaging system (sms) based information and research dissemination services. Subscribers are advised to understand that the services can fail due to failure of hardware,
software, and internet connection. While we ensure that the messages are delivered in time to the subscribers mobile network, the delivery of these messages to the customer's mobile phone/handset is the responsibility of the
customer's mobile network. Sms may be delayed and/or not delivered to the customer's mobile phone/handset on certain days, owing to technical reasons and stock quint.Com cannot be held responsible for the same.
stock quint.Com hereby expressly disclaims any implied warranties imputed by the laws of any jurisdiction. We consider ourselves and intend to be subject to the jurisdiction only of the court of chennai in india. If you don't agree
with any of our disclaimers above please do not read the material on any of our pages. This site is specifically for users in the territory of india. Although the access to users outside india is not denied, stock quint.Com shall have no
legal liabilities whatsoever in any laws of any jurisdiction other than india. We reserve the right to make changes to our site and these disclaimers, terms, and conditions at any time.
Stock trading is inherently risky and you agree to assume complete and full responsibility for the outcomes of all trading decisions that you make, including but not limited to loss of capital. None of the stock trading calls made by
stock quint.Com and gro up companies associated with it should be construed as an offer to buy or sell securities, nor advice to do so. All comments and posts made by stock quint.Com, group companies associated with it
and employees/owners are for information purposes only and under no circumstances should be used for actual trading. Under no circumstances should any person at this site make trading decisions based solely on the
information discussed herein. We are not a qualified financial advisor and you should not construe any information discussed herein to constitute investment advice. It is informational in nature.
You should consult a qualified broker or other financial advisor prior to making any actual investment or trading decisions. You agree to not make actual stock trades based on comments on the site, nor on any techniques
presented nor discussed in this site or any other form of information presentation. All information is for educational and informational use only. You agree to consult with a registered investment advisor, which we are not, prior to
making any trading decision of any kind. Hypothetical or simulated performance results have certain inherent limitations. Unlike an actual performance record, simulated results do not represent actual trading. No representation is
being made that any account will or is likely to achieve profits or losses similar to those shown.
stock quint.Com operates a real time chat room intended to provide a private forum for users to exchange information and to discuss various investing techniques. You agree, by accessing this or any associated site, stock
quint.Com bears no liability for any postings on the website or actions of associate site. We reserve the right to deny service to anyone. You, and not stock quint.Com, assume the entire cost and risk of any trading you choose to
undertake. You are solely responsible for making your own investment decisions. If you choose to engage in such transactions with or without seeking advice from a licensed and qualified financial advisor or entity, then such
decision and any consequences flowing there from are your sole responsibility. The information and commentaries are not meant to be an endorsement or offering of any stock purchase. They are meant to be a guide only, which
must be tempered by the investment experience and independent decision making process of the subscriber. stock quint.Com or any employees are in no way liable for the use of the information by others in investing or trading in
investment vehicles utilizing the principles disclosed herein. stock quint.Com or any of its employees do not represent themselves as acting in the position of an investment advisor or investment manager for the use of the
information in this service. The materials and information in, and provided by, this site are not, and should not be construed as an offer to buy or sell any of the securities named in materials, services, or on-line postings.
We encourage all investors to use the information on the site as a resource only to further their own research on all featured companies, stocks, sectors, markets and information presented on the site. Nothing published on this
site should be considered as investment advice.
stock quint.Com, its management, its associate companies and/or their employees take no responsibility for the veracity, validity and the correctness of the expert recommendations or other information or research. Although we
attempt to research thoroughly on information provided herein, there are no guarantees in consistency. The information presented on the site has been gathered from various sources believed to be providing correct information.
stock quint.Com, group, companies, associates and/or employees are not responsible for errors, inaccuracies if any in the content provided on the site. Any prediction made on the direction of the stock market or on the direction
of individual stocks may prove to be incorrect. Users/visitors are expected to refer to other investment resources to verify the consistency of the data posted on this site on their own.
stock quint.Com does not represent or endorse the consistency or reliability of any of the information, conversation, or content contained on, distributed through, or linked, downloaded or accessed from any of the services
contained on this website (hereinafter, the "service"), nor the quality of any products, information or other materials displayed, purchased, or obtained by you as a result of any other information or offer by or in connection with
the service.
Neither stock quint.Com nor its principals, agents, associates or employees, are licensed to provide investment advice. No materials in stock quint.Com, either on behalf of stock quint.Com or any site host, or any participant in
stock quint.Com or any of its associated sites should be taken as investment advice directly, indirectly, implicitly, or in any manner whatsoever, including but not limited to trading of stocks on a short term or long term basis, or
trading of any financial instruments whatsoever. Past performance is not an indicator of future returns. All the analyst commentary provided on stock quint.Com is provided for information purposes only. This information is not a
recommendation or solicitation to buy or sell any securities. Your use of this and all information contained on stock quint.Com is governed by these terms and conditions of use. This material is based upon information that we
consider reliable, but we do not represent that it is consistent or complete, and that it should be relied upon, as such. You should not rely solely on the information in making any investment. Rather, you should use the information
only as a starting point for doing additional independent research in order to allow you to form your own opinion regarding investments. By using stock quint.Com including any software and content contained therein, you agree
that use of the service is entirely at your own risk. stock quint.Com is not a registered investment advisor or a broker dealer. You understand and acknowledge that there is a very high degree of risk involved in trading securities.
Past results of any trader published on this website are not an indicator of future returns by that trader, and are not an indicator of future returns which be realized by you. Any information, opinions, advice or offers posted by any
person or entity logged in to stock quint.Com or any of its associated sites is to be construed as public conversation only. stock quint.Comm makes no warranties and gives no assurances regarding the truth, timeliness, reliability, or
good faith of any material posted on stock quint.Com. stock quint.Com does not warranties that trading methods or systems presented in their services or the information herein, or obtained from advertisers or members will
result in profits or losses.
Any surfing and reading of the information is the acceptance of this disclaimer.
All rights reserved.
DISCLAIMER
2