Each week the utility sector of the Financial Markets Program presents a weekly update highlighting the performance of the XLU compared to the specific names we hold. The report provides insight into the weekly news, technical analysis & the catalysts we see going forward.
Each week the utility sector of the Financial Markets Program presents a weekly update highlighting the performance of the XLU compared to the specific names we hold. The report provides insight into the weekly news, technical analysis & the catalysts we see going forward.
While the politically charged Solyndra case made the headlines, the “real news” is the beginning of the phase-out of several federal support programs, which is going to be a game-changing factor in the field of renewable energy in the US.
This webinar addresses the key industry trends impacting transmission development, FERC Order 1000 and the impacts of the removal of the right of first refusal for transmission developers.
Nextera Energy University of Southern California Investment CTimothy O'Brien
This past spring Zane Laws, Quinn Peebles and I competed in the University of Southern California Spring 2018 Investment Competition at USC in Los Angeles. We pitched a long position in NextEra Energy Inc, ticker NEE.
:: CAPITAL RENOVABLE :: "Smart Energy Solutions"
--- 2014 Brochure -_________________________________________________
Capital Renovable is a company dedicated to the
development, construction and operation of projects for
generation and sale of electricity based on nonconventional
renewable energy (NCRE).
1. For Sale: Abortion Pills available in Dubai, Abu Dhabi, Sharjah, Ajman, Fujairah, Al Ras Khaimah (RAK) City, Al Ain-UAE. Contact: +971581248768.
2. Safe Abortion Pills in Dubai, Abu Dhabi, Sharjah, Ajman, Fujairah, Al Ras Khaimah (RAK) City, Al Ain-UAE for sale. Contact: +971581248768.
3. Contact +971581248768 for the availability of Abortion Pills in Dubai, Abu Dhabi, Sharjah, Ajman, Fujairah, Al Ras Khaimah (RAK) City, Al Ain-UAE.
4. Looking for Abortion Pills? Contact +971581248768. Available in Dubai, Abu Dhabi, Sharjah, Ajman, Fujairah, Al Ras Khaimah (RAK) City, Al Ain-UAE.
5. Abortion Pills on sale! Dubai, Abu Dhabi, Sharjah, Ajman, Fujairah, Al Ras Khaimah (RAK) City, Al Ain-UAE. Call +971581248768 for details.
6. Get Safe Abortion Pills in Dubai, Abu Dhabi, Sharjah, Ajman, Fujairah, Al Ras Khaimah (RAK) City, Al Ain-UAE. Contact +971581248768.
7. Contact +971581248768 to purchase Abortion Pills in Dubai, Abu Dhabi, Sharjah, Ajman, Fujairah, Al Ras Khaimah (RAK) City, Al Ain-UAE.
8. Abortion Pills available in Dubai, Abu Dhabi, Sharjah, Ajman, Fujairah, Al Ras Khaimah (RAK) City, Al Ain-UAE. Call +971581248768 for more information.
9. Seeking Abortion Pills? Look no further. Contact +971581248768 for availability in Dubai, Abu Dhabi, Sharjah, Ajman, Fujairah, Al Ras Khaimah (RAK) City, Al Ain-UAE.
10. +971581248768 is the number to call for Abortion Pills in Dubai, Abu Dhabi, Sharjah, Ajman, Fujairah, Al Ras Khaimah (RAK) City, Al Ain-UAE.
11. Abortion Pills in Dubai, Abu Dhabi, Sharjah, Ajman, Fujairah, Al Ras Khaimah (RAK) City, Al Ain-UAE. Contact +971581248768 for purchase.
12. Safe and reliable Abortion Pills available in Dubai, Abu Dhabi, Sharjah, Ajman, Fujairah, Al Ras Khaimah (RAK) City, Al Ain-UAE. Call +971581248768.
13. Looking for Abortion Pills? Call +971581248768. Available in Dubai, Abu Dhabi, Sharjah, Ajman, Fujairah, Al Ras Khaimah (RAK) City, Al Ain-UAE.
14. Contact +971581248768 for Abortion Pills in Dubai, Abu Dhabi, Sharjah, Ajman, Fujairah, Al Ras Khaimah (RAK) City, Al Ain-UAE.
15. Abortion Pills for sale in Dubai, Abu Dhabi, Sharjah, Ajman, Fujairah, Al Ras Khaimah (RAK) City, Al Ain-UAE. Dial +971581248768.
16. Get in touch with +971581248768 to purchase Abortion Pills in Dubai, Abu Dhabi, Sharjah, Ajman, Fujairah, Al Ras Khaimah (RAK) City, Al Ain-UAE.
17. Abortion Pills available in Dubai, Abu Dhabi, Sharjah, Ajman, Fujairah, Al Ras Khaimah (RAK) City, Al Ain-UAE. Call +971581248768 to order.
18. Need Abortion Pills? Contact +971581248768. Available in Dubai, Abu Dhabi, Sharjah, Ajman, Fujairah, Al Ras Khaimah (RAK) City, Al Ain-UAE.
19. Contact +971581248768 for the purchase of Abortion Pills in Dubai, Abu Dhabi, Sharjah, Ajman, Fujairah, Al Ras Khaimah (RAK) City, Al Ain-UAE.1. Contact +971581248768 for 100% original and safe abortion pills available for sale in Dubai and Abu Dhabi!
2. Call +971581248768 to purchase in Dubai and Abu DhabiLooking for 100% original and safe abortion pills?
1000-1250 words
Table of Contents
Abstract 2
Introduction 3
Organizational analysis 3
Leadership 3
Market 3
Operations 3
Finance 4
Performance 4
Regulatory environment 4
Critical incidents 4
Investment potential 4
Recommendation 4
References 5
Abstract
The goal of this case study is to provide a detailed outline for potential addition into the company’s investment portfolio. The company targeted for potential investment is Pacific Gas and Electric Company or PG&E. Covered herein is the organizational analysis, critical incidents, the company’s investment potential, and recommendations based on findings.
Introduction
PG&E Corporation (PG&E or the company) is an energy-based holding company for Pacific Gas and Electric Company (Pacific Gas and Electric). PG&E subsidiaries provide customers with public utility services, and services relating to the generation of energy, transmission of electricity and natural gas, generation of electricity, and the distribution of energy. The company primarily operates in the US. It is headquartered in San Francisco, California, and employed 21,166 people as on December 31, 2013.Organizational analysisLeadership
PG&E is an energy-based holding company for Pacific Gas and Electric. Pacific Gas and Electric is engaged primarily in the following businesses: electricity and natural gas distribution; electricity generation, procurement, and transmission; and natural gas procurement, transportation, and storage. PG&E operates through two segments: electric and natural gas. The company's strength lies in its strong distribution network in electricity and natural gas segments, which provide it with a competitive edge. However, volatility of the natural gas and electricity markets may adversely impact its financial condition, results of operations, and cash flows.Market
PG&E's subsidiary, Pacific Gas and Electric, has a strong distribution network for the supply of electricity and natural gas. As on December 31, 2013, the company owned approximately 18,115 circuit miles of interconnected transmission lines operated at voltages of 500 kV to 60 kV and transmission substations with a capacity of 62,289 MVA. Pacific Gas and Electric's electricity distribution network consists of approximately 141,000 circuit miles of distribution lines (of which approximately 20% are underground and approximately 80% are overhead), 58 transmission-switching substations, and 603 distribution substations. The strong distribution network provides competitive advantage to the company.Operations
As on December 31, 2013, Pacific Gas and Electric's natural gas system consisted of approximately 42,559 miles of distribution pipelines, over 6,000 miles of backbone and local transmission pipelines, and various storage facilities. Pacific Gas and Electric owns and operates three underground natural gas storage fields connected to its transmission and storage system and has a 25% interest in the new Gill Ranch Storage Field. In addition, three indep.
How cleantech can close the financing gaptonymaull92
The most fundamental element of disruptive business models is financing. the article explores creating, adopting and adapting proven models for new industries.
The global renewable energy market has grown rapidly over the past few years. Driven by improving sector dynamics, renewable energy witnessing emergence of newer investment options in the capital markets segment.
Equity Market Reactions based on Company’s Financial StrategiesRUPANJAN NAYAK
Equity Market Reactions based on Company’s Financial Strategies on a POWER UTILITY COMPANY: CESC PVT LTD.
1. Contains equity stock market reactions based on company financial restructuring strategies like: following a lean business model, layoff and retrenchments, going full digital from offline business model etc.
2. The impact on the shareholders due to diversification.
3. Impact on the shareholders due to company strategic restructuring.
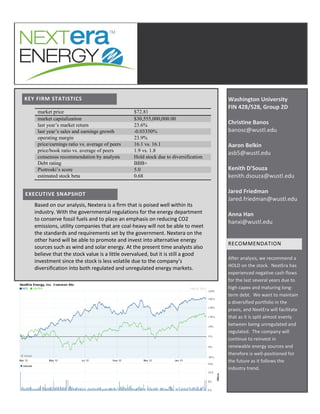
1. market price $72.81
market capitalization $30,555,000,000.00
last year’s market return 23.6%
last year’s sales and earnings growth -0.03350%
operating margin 23.9%
price/earnings ratio vs. average of peers 16.1 vs. 16.1
price/book ratio vs. average of peers 1.9 vs. 1.8
consensus recommendation by analysts Hold stock due to diversification
Debt rating BBB+
Piotroski’s score 5.0
estimated stock beta 0.68
Washington University
FIN 428/528, Group 2D
Christine Banos
banosc@wustl.edu
Aaron Belkin
asb5@wustl.edu
Kenith D’Souza
kenith.dsouza@wustl.edu
Jared Friedman
Jared.friedman@wustl.edu
Anna Han
hanxi@wustl.edu
RECOMMENDATION
After analysis, we recommend a
HOLD on the stock. NextEra has
experienced negative cash flows
for the last several years due to
high capex and maturing long-
term debt. We want to maintain
a diversified portfolio in the
praxis, and NextEra will facilitate
that as it is split almost evenly
between being unregulated and
regulated. The company will
continue to reinvest in
renewable energy sources and
therefore is well-positioned for
the future as it follows the
industry trend.
KEY FIRM STATISTICS
Based on our analysis, Nextera is a firm that is poised well within its
industry. With the governmental regulations for the energy department
to conserve fossil fuels and to place an emphasis on reducing CO2
emissions, utility companies that are coal-heavy will not be able to meet
the standards and requirements set by the government. Nextera on the
other hand will be able to promote and invest into alternative energy
sources such as wind and solar energy. At the present time analysts also
believe that the stock value is a little overvalued, but it is still a good
investment since the stock is less volatile due to the company’s
diversification into both regulated and unregulated energy markets.
EXECUTIVE SNAPSHOT
2. OVERVIEW OF NEXTERA ENERGY, INC.
For a brief introduction into what NextEra Energy, Inc. is, the New York Times explains that the company
“provides retail and wholesale electric services to approximately four million customers and owns
generation, transmission and distribution facilities to support its services. It also purchases electric
power for resale to its customers and provides risk management services related to power and gas
consumption for a limited number of customers.”1
As stated on their company website, “NextEra
Energy, Inc. is a leading clean-energy company with revenues of more than $15.3 billion, more than
41,000 megawatts (MW) of generating capacity, and approximately 15,000 employees in 24 states and
Canada as of year-end 2011.”2
It has garnered several awards over the years, including Forbes 2011-
2012 No.1 overall gas and utilities company, for its countless efforts towards environmental
sustainability and renewable energy procedures.
SUBSIDIARIES
NextEra is currently composed of three subsidiaries:
Florida Power & Light: As U.S.’s third largest utility company and NextEra’s largest subsidiary,
FPL distributes power at regulated rates over four million customers in Florida.
NextEra Energy Resources: NER composes the company’s clean energy portion and serves as
the country’s leader in the production of energy through wind and solar processes.
FPL FiberNet: Started by FPL in the 1980’s, FPL FiberNet provides fiber-optic solutions to
customers in both Florida and Texas.
MAIN PRODUCTS/SERVICES
NextEra provides several products and services for its customers. These include:
Wind energy: One of the world’s largest generators, with facilities throughout the United
States and Canada.
Solar energy: Largest generator using both photovoltaic and solar thermal technologies.
Hydroelectric energy: All 22 facilities located in Maine
Fossil fueled facilities
Nuclear energy: Three nuclear-powered plants in Iowa, Wisconsin, and New Hampshire.
Energy marketing: Leading electricity and natural gas marketers in the country while
additionally responsible for electricity and fuel management of the company’s generation.
Specialized wind: Under its WindLogics program, NextEra “researches historical wind resource
data and wind patterns” by providing “engineering, technical analysis and consulting services in
the field of studying, modeling, and forecasting meteorological air flow.”3
1
http://topics.nytimes.com/top/news/business/companies/fpl_group_inc/index.html
2
http://www.investor.nexteraenergy.com/phoenix.zhtml?c=88486&p=irol-homeProfile
3
http://www.nexteraenergyresources.com/what/specialized_wind.shtml
3. Retail market: Under Gexa Energy, this service provides electricity to both residential and
commercial customers.
Exhibit 1 provides a more detailed breakdown of the products provided.
COMPETITORS
NextEra’s competition includes Progress Energy, Inc. (privately held), Southern Company, and TECO
Energy, Inc with their respective market capitalizations listed below.
4
RECENT DEVELOPMENTS AND NEWS STORIES
FLORIDA POWER AND LIGHT COMPANY
FPL, a subsidiary of NextEra, announced on January 29th
that they have launched a new website,
PoweringFlorida.com, which serves as a resource to help businesses in Florida to start, relocate, or
expand their companies. As CEO of Boyette Strategic Advisors, Del Boyette explains,
“PoweringFlorida.com has achieved a first: bringing the best planning and workforce data together
in one click. What that means for companies and their site selectors is unfiltered and unparalleled
insight – county by county and block by block. What that means for Florida is a competitive
advantage for the right types of jobs and investment.”5
SELLING RESOURCES
On December 21, 2012, NextEra Resources, a subsidiary of NextEra, took part in an agreement to sell its
hydro generating assets to Brookfield Energy Partners, L.P. As Armando Pimentel, the CEO of NextEra
Energy Resources, explains, “While this is an attractive portfolio in many respects, this transaction
enables us to further optimize our power generation portfolio and concentrate our resources on areas
with greater growth potential for our business."6
The transaction is still in its pending stages and is
4
http://finance.yahoo.com/q/co?s=NEE+Competitors
5
http://www.nexteraenergy.com/news/contents/2013/012913_1.shtml
6
http://markets.on.nytimes.com/research/stocks/news/press_release.asp?docTag=201212211920PR_NEWS_USPR
X____FL34195&feedID=600&press_symbol=109578
Competition Market Capitalization
NextEra Energy, Inc. 30.77B
Progress Energy, Inc. N/A
Southern Company 39.11B
TECO Energy, Inc. 3.67B
Industry 6.97B
4. expected to be completed by the end of the first quarter of the 2013 fiscal year. While there is an
anticipated result of a gain upon completion, it is not expected to have a significant impact on the
current or future financial position of NextEra.
WHERE NEXTERA IS HEADED7
NextEra’s future within the utilities industry looks strong and profitable. Both of their main subsidiaries,
FPL and NER, have proven successful over the last decade as they have continued to bring in profits and
spark growth. Overall, the company’s shareholder return maintains an edge over the electric utility
industry and has exceeded expectations. For example, at year-end 2011 NextEra informed the public
that its total shareholder return over the past decade was 209%, a percentage nearly double that of the
S&P 500 Electric Utilities Index.
NextEra will continue to expend the $15 billion of capital it anticipated to use between 2010-2014. This
includes more than $6 billion of major generation and advanced metering projects as well as an
investment of an additional $6 billion in new wind and solar projects. This will not only continue but
expand NextEra’s position as the renewable energy leader.
Additionally, NextEra expects that its adjusted earnings per share for 2013 and 2014 will be from $4.70-
$5.00 and $5.05-$5.65, respectively and its growth to be 5%-7% in the long-run. We were bullish on the
renewable sector of the industry and therefore this increase in stock, however slight, between 2013 and
2014 makes sense as the industry sees an expansion and dominant presence of renewable energy
sources in the utilities industry.
With the recent climatic changes and disasters, new utility infrastructure is being researched and
developed, a trend seen for much of the entire industry. As a result, NextEra will invest nearly $7.5
billion in this area and in turn garner higher returns and drive earnings growth until at least 2015.
In regards to the company’s renewable energy program, NextEra continues to increase its capacity
generation in natural gas-fired plants and wind energy. Specifically concerning its wind energy, NextEra
already experiences great advantages over other companies, including access to wind turbines and
operational excellence. As a result, the company increases its appeal to other utilities looking to have a
greater mix of wind energy in their portfolio.
Overall, with the industry’s and government’s increased focus on environmental regulations, NextEra
appears well-positioned. The company will continue to see growth as Florida’s economy advances.
ANALYST OPINIONS8
Nextera is a company that is deals in both regulated and unregulated energy. Analysts believe that
Nextera is a safe and steady option with annual earnings growth rate of 6.5% and dividend growth rate
of 10%. In terms of regulated energy since the recession there has been a stagnation of growth, but
after the ruling on the rates for energy prices this growth should resume. Also due to its prime
7
http://www.investor.nexteraenergy.com/phoenix.zhtml?c=88486&p=earningsRelease12
8
NEE Morningstar Report
5. geographic location in Florida, Nextera is poised to plunge ahead into multiple alternative energy
markets such as wind energy and solar energy. This is beneficial to the company since it is so diversified.
If the regulated market takes a hit and the prices for energy go down then the company can invest more
in the unregulated market. Also with increased governmental regulation on preserving the environment
and fossil fuel regulation, Nextera’s decision to move ahead into alternative energy is a great idea.
Nextera’s current stock value is a little over-valued, but all in all it seems like a good stock to invest in
terms of steady growth and dividend yield.
SWOT ANALYSIS9
Strengths:
o Established operations in Florida
o Diverse customer base
o Balanced fuel mix
Weaknesses:
o Limited presence
o Substantial debt
o Dependence on subsidiaries
Opportunities:
o Focus on renewable energy
o Rising demand for electricity
Threats:
o Risks associated with nuclear operations
o Weather conditions
o Compliance to environmental regulations
FINANCIAL STATEMENT ANALYSIS
Nextera’s 2012 10-K had not yet been released at the time of our analysis, we will focused our
evaluation on the company’s third quarter 10-Q SEC filing, as well as the unaudited earnings releases for
the fourth quarter of 2012 and the entire year of 2012.
After reviewing Nextera’s 2011 annual report and its quarterly report for the third quarter, we turned to
the most recent earnings release to examine trends in performance and growth. The amount of energy
being sold has noticeably decreased over the past four years, although the drop was not as significant
between 2011 and 2012. This past year, the majority of the decrease occurred in the Residential
segment, which is still the largest customer segment. Total energy sales (in Kilowatt-hours) have
decreased from 105,414 million kwh in 2009 to 81,002 million kwh in 2012. Similarly, the average price
of power is slowly decreasing, from 11.19 cents/kwh to 9.53 center/kwh four years later. Despite these
disappointing trends, we do see that the number of customer accounts is increasing, in both the
commercial and the residential sectors.
9
Market Line
6. To see how these trends fit into the big picture, we evaluated Nextera’s changes in net income over the
past 10 years. Graphing the net income from 2002 to 2012, we noticed a clear cyclical pattern; however,
the profitably was noticeably decreasing over time. Superimposing a linear line over the percentage
changes in net income, we roughly estimate a 4.94% annual decrease in net income (smoothing out the
cyclical patterns). These trends seem to fall in line with our industry analysis: energy consumption per
capita is decreasing, but an overall increase in population is making up for the lost demand marginally.
Change in net income by itself is far from conclusive. We also examined the consolidated balance sheets
from the past five years for trends in a number of items. First, the amount of cash and cash equivalents
has been volatile over the years, with seemingly no clear direction of whether it is increasing or
decreasing. With a high of $535 million in 2008 to a low of $238 million the next year, 2012 was in
between at $329 million. Next, net debt is calculated as the sum of short term and long term debt,
subtracted by the working capital. Over the past four years we see a trend of increasing net debt; from
$18.6 million in 2009 gradually rising to $27.0 million in 2012. This increase is also reflected in the
leverage ratio, which has climbed from 1.4 in 2009 to 1.7 today. In addition, working capital continues
to be below zero and has become more negative in 2012 than in the past five years at -$3,492,000.
This increase in debt could be related to a corresponding increase we see in the amount of fixed asset.
Electric utility plant in service and other property assets have increased by over two million dollars or
more each year. In addition, Nextera remains without any minority interest invested in the company.
To better understand what these financial statement numbers mean going into the future, we
calculated several profitability ratios. First, the gross margin ratio we found to be noticeably increasing
over the past four years, from 0.373 in 2009 to 0.544 in 2012. Similarly, the operating margin ratio has
also increased from 0.166 to 0.230 over the same four years. On the other hand, return on equity and
return on asset both appear to be slowly decreasing; ROE from 0.125 in 2009 down to 0.119 in 2012,
while ROA decreased from 0.0333 in 2009 to 0.0297 in 2012.
DCF VALUATION
In establishing projections for NextEra’s expected free cash flows for the next 5 years we first examined
historical data to uncover operating trends and margins. More specifically, we looked at the 5-year
historical revenue growth rate and how operating costs, depreciation, capital expenditures and net
working capital changed as a percentage of revenue over the same 5-year period. Our analysis showed
that over this 5-year historical period, operating costs trended downward, averaging approximately
71.37% of revenue, depreciation and amortization 10.17%, capital expenditures 34.37%, and net
working capital 7.06%.
Going forward, we projected that almost all of these historical margins will continue at approximately
the same percentages; however, we believe that operating costs and capital expenditures will change
slightly. We believe that operating costs as a percentage of revenue will trend downwards slightly as
higher utility rates are approved by Florida’s regulatory agencies to sustain approved ROE levels,
increasing revenues while maintaining level operating expenses. Additionally, while we believe capital
7. expenditures will drop to their long-term historical average, which is approximately 20%, in the short-
term we expect NextEra to take advantage of the low interest rate environment and maintain capital
expenditures on new solar and wind investments at levels commensurate with their 5-year historical
average of 34.37%.
With respect to revenue growth, we assumed an immediate annual growth of 6% driven primarily by
new wind and solar investment. Subsequently, we believe that revenue growth will trend downwards
and ultimately level off at a terminal growth rate comparable to that of GDP, or 2% (Exhibit 11).
12. EXHIBIT 7
From NextEra 2012 4
th
quarter earnings summary and non-GAAP reconciliations
EXHIBIT 8
-4
-2
0
2
4
6
8
EBITDA and Working Capital of NEE and 18 Utilities in $Billion sorted by
decreasing Market Capitalization
EBITDA $B Working Cap $B
13. EXHIBIT 9
Price-to-Earnings Ratio for NEE and 18 other Utilities Companies
0 5 10 15 20 25 30 35 40 45 50
DUK
SO
NEE
Exelon
PCG
PPL
XEL
NU
ETR
CNP
CPN
AEE
NI
AWK
CMS
PNW
POM
NVE
TE